11email: vincent.minier@cea.fr 22institutetext: Onsala Space Observatory, Chalmers University of Technology, 439 92 Onsala, Sweden 33institutetext: European Southern Observatory, Casilla 19001, Santiago 19, Chile 44institutetext: Max Planck Institut für Radioastronomie, Auf dem Hügel 69, D-53121 Bonn, Germany 55institutetext: Institut d’Astrophysique de Paris, UPMC (Université Paris 6), 98b Bd Arago, 75014 Paris, France
Evidence of triggered star formation in G327.3-0.6
Abstract
Aims. Expanding HII regions and propagating shocks are common in the environment of young high-mass star-forming complexes. They can compress a pre-existing molecular cloud and trigger the formation of dense cores. We investigate whether these phenomena can explain the formation of high-mass protostars within an infrared dark cloud located at the position of G327.3-0.6 in the Galactic plane, in between two large infrared bubbles and two HII regions.
Methods. The region of G327.3-0.6 was imaged at 450 m with the CEA P-ArTéMiS bolometer array on the Atacama Pathfinder EXperiment telescope in Chile. APEX/LABOCA and APEX-2A, and Spitzer/IRAC and MIPS archives data were used in this study.
Results. Ten massive cores were detected in the P-ArTéMiS image, embedded within the infrared dark cloud seen in absorption at both 8 and 24 m. Their luminosities and masses indicate that they form high-mass stars. The kinematical study of the region suggests that the infrared bubbles expand toward the infrared dark cloud.
Conclusions. Under the influence of expanding bubbles, star formation occurs in the infrared dark areas at the border of HII regions and infrared bubbles.
Key Words.:
interstellar – star formation – HII region1 Introduction
A necessary prerequisite to star formation is the existence of dense cores of self-gravitating gas. How the dense cores form, evolve and give birth to new stars remains a matter of debate for high-mass star formation (e.g., Motte et al. 2007). Possible phenomena responsible for their formation include external events such as expanding HII regions and propagating shocks, which are common in the environment of young high-mass star-forming complexes (e.g., Zavagno et al. 2007) . The ionised front of an HII region can compress a pre-existing molecular cloud and trigger the formation of dense cores (e.g., Purcell et al. 2009). Stellar winds or shocks from supernovae can also lead to the formation of similar objects (e.g., Koo et al. 2008). The Galactic Legacy Infrared Mid-Plane Survey Extraordinaire (GLIMPSE; Churchwell et al. 2006) detected many infrared bubbles in the Galactic plane close to active sites of high-mass star formation. The infrared emission tracing the bubbles was interpreted as a signature of PAH emission in the photo-dissociation regions (PDRs) at the borders of HII regions. The bubbles may also be inflated by strong stellar winds.
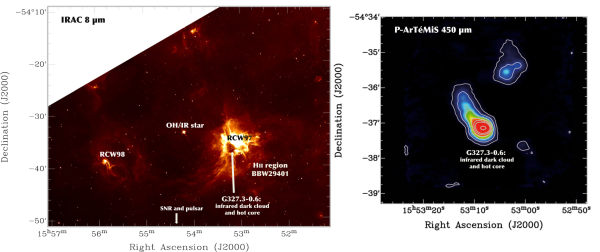
We present the first 450 m map of massive protostar progenitors within the high-mass star-forming region near the hot molecular core G327.3-0.6 (Wyrowski et al. 2006) at the projected extremity of an infrared dark cloud (Fig. 1). At a distance of 2.9 kpc (Bergman 1992), G327.3-0.6 is surrounded by two large scale infrared bubbles and two HII regions, as shown in Fig. 1. The objective of this letter is to (1) provide a census of the objects in an early phase of star formation that are embedded in the infrared dark areas and (2) investigate the relationship between early phases of high-mass star formation and the influence of the expansion of nearby infrared bubbles and HII regions.
2 P-ArTéMiS 450 m continuum imaging
2.1 Observations
The region of G327.3-0.6 was imaged at 450 m in November 2007 with the P-ArTéMiS bolometer array on the Atacama Pathfinder Experiment (APEX) telescope located at an altitude of 5100 m at Llano de Chajnantor in Chile. The P-ArTéMiS detector is a -pixel prototype of the ArTéMiS large-format bolometer camera being built by CEA Saclay for APEX (e.g., Talvard et al. 2008). Three individual maps, corresponding to a total effective integration time of 1.4 hours, were obtained with P-ArTéMiS at m toward the G327.3-0.6 region using a total-power, on-the-fly scanning mode. Each of these maps consisted of a series of scans in either Azimuth or Right Ascension taken with a scanning speed of 16′′ s-1. The cross-scan step between consecutive scans was 2′′.
The atmospheric opacity at zenith was monitored by taking skydips with P-ArTéMiS and was found to be between 0.6 and 0.8 at m, corresponding to precipitable water vapour amount between 0.5 mm and 0.7 mm. No dedicated pointing model was derived for P-ArTéMiS, but the pointing corrections proved to be very similar i.e., to within 10′′ of the corrections appropriate for the APEX-2A instrument. Pointing, focus, and calibration measurements were achieved by taking both short “spiral” scans and longer on-the-fly beam maps of Mars and Saturn. We estimated the absolute pointing accuracy to be 5′′. The flux amplitude was to within uncertainty. As estimated from Mars maps, whose angular diameter was 14′′, the main beam had a full width at half maximum of and contained of the power. Offline data reduction, including baseline subtraction, removal of correlated skynoise and 1/f noise, and subtraction of uncorrelated 1/f noise using a method exploiting the high level of redundancy in the data, were performed with in-house IDL routines (André et al. 2008).
2.2 Results and analysis
The 450 m emission originates in a large infrared dark cloud ( pc2) near G327.3-0.6 and at the south-eastern border of the RCW97 HII region (Fig. 1). Spitzer IRAC and MIPS images as well as LABOCA/APEX and APEX-2A archives observations were used in addition to the P-ArTéMiS data set.
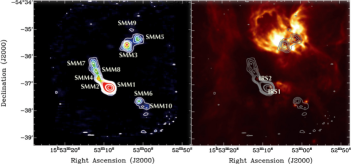
Ten submillimetre sources (SMM) were identified using a version of the Gauss-clumps program and the MRE multi-resolution program based on wavelet transforms (Starck & Murtagh 2006), which has been customised for continuum images (see Appendix B in Motte et al. 2007). This method allowed us to first detect and then characterise SMM2, 4, 7, and 8, which were not identified by eye in the original 450 m map (Fig. 1). We used MRE to complete a series of filtering operations and provided views of the image on different spatial scales. A cutoff angular size of (i.e., 0.3 pc at 2.9 kpc), on which scale SMM2, 4, 7, and 8 were resolved, was estimated. All wavelet planes of the original image up to this scale were summed to create images such as those shown in Fig. 2. We note that the original image can be described by the sum of all wavelet views plus the smoothed image (last plane containing all remaining scales). Table 1 presents the SMM source characteristics (, the peak flux in the original map; , the peak flux in the filtered map; , the full width half maximum size; , the integrated flux) from both the filtered map (Fig. 2) and the original map (Fig. 1). The brightest source, SMM1, coincides with the position of the hot core and an infrared source (IRS1 in Fig. 2). SMM4 coincides with a 8 and 24 m infrared source (IRS2 in Fig. 2). Other sources do not have any infrared source counterpart in the MIPS or IRAC image.
Assuming optically thin dust continuum emission at 450 m, the gas masses of the sources were derived from the measured flux densities (either or ) using
| (1) |
where is the distance to the source, is the dust opacity per unit (gas + dust) mass column density at , and is the Planck function for the dust temperature . We adopted , which is consistent with the dust opacity law estimated by Hill et al. (2007) and appropriate in regions of moderately high gas densities ( ). The mean dust temperatures of SMM1, 2, 3, 5, 6, 9, 10 were estimated from the observed 450 and 870 m flux density ratio by assuming optically thin dust emission with an emissivity index . The 870 m flux density was derived from LABOCA/APEX observations. For SMM1, the hot core, and SMM 3, 5, and 9 in the RCW97 PDR, the temperature estimates are probably lower limits, corresponding to upper mass limits. For three sources, SMM4, 7, and 8, the flux density ratio map did not provide any accurate measurement. A mean temperature for this part of the dark cloud was estimated to be K and used for these three sources (see Table 1).
| Fragment | RA | Dec | 111using the original map in Fig. 1. | 222using the filtered map in Fig. 2. SMM2 needs confirmation. | FWHM | 333 value is uncertain within 5 K. | 444with a factor 2 of uncertainty on either side of the mass value. | b,d | |
| name | J2000 | J2000 | [Jy/beam] | [Jy/beam] | [″ ″] | [Jy] | [K] | [M⊙] | [M⊙] |
| SMM1 | 15:53:08.6 | -54:37:09 | 140 | 101 | 440 | 20 | 3769 | 184 | |
| SMM2b | 15:53:10.1 | -54:37:01 | - | 19 | 35b | 25 | 197b | 23 | |
| SMM3 | 15:53:04.0 | -54:35:34 | 24 | 13 | 132 | 15 | 2129 | 45 | |
| SMM4b | 15:53:11.5 | -54:36:46 | - | 11 | 25b | 20 | 214b | 20 | |
| SMM5 | 15:53:01.4 | -54:35:20 | 17 | 8 | 100 | 40 | 265 | 4 | |
| SMM6 | 15:53:00.9 | -54:37:40 | 10 | 8 | 22 | 15 | 354 | 27 | |
| SMM7b | 15:53:12.8 | -54:36:11 | - | 5 | 9b | 20 | 77b | 9 | |
| SMM8b | 15:53:12.1 | -54:36:31 | - | 3 | 3b | 20 | 25b | 5 | |
| SMM9 | 15:53:03.3 | -54:34:58 | 8 | 3 | 60 | 20 | 514 | 5 | |
| SMM10 | 15:52:59.1 | -54:37:52 | 7 | 2 | 20 | 20 | 171 | 4 |
Mass estimates of the SMM sources were derived from both the peak fluxes and the integrated fluxes over their deconvolved sizes. There was an uncertainty of a factor of 2 on either side, mainly because of uncertain value of . SMM sources have masses that vary from 25 to 3800 M⊙ (Table 1). A second set of mass values, M, was also derived, which correspond to the estimate of the gas envelope masses of possibly dominant protostellar objects embedded within each SMM source. The diameter of the protostellar envelope is set to be 6000 AU (the typical fragmentation length-scale observed in high-mass star-forming regions - e.g., Longmore et al. 2006). The value of M was obtained by first calculating the mass corresponding to the peak flux density in the 10 beam and then applying a scaling factor to that mass, assuming a density distribution so that the measured mass scales as the aperture size. The value of M varies from 4 to 190 M⊙ (see Table 1). The overall mass of the dark cloud was estimated to be M⊙ assuming a mean dust temperature of 20 K and taking into account the extended emission.
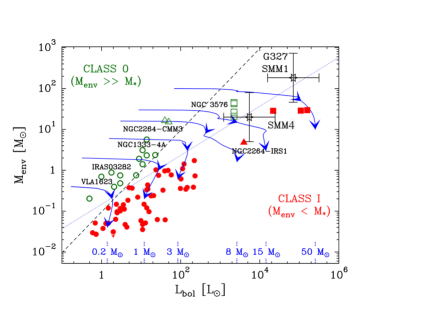
SMM1 and SMM4 are associated with infrared sources at both 8 and 24 m (Fig. 2). Based on fits to approximate their spectral energy distribution from 24 to 870 m, the luminosities of SMM1 and SMM4 are estimated to be within the ranges of L⊙ and L⊙, respectively. The luminosities of the other SMM sources were not calculated because of the lack of mid-infrared emission at 24 in the Spitzer/MIPS image. However, their luminosities were estimated to be within L⊙ using their flux at 450 m to extrapolate the luminosity values from those estimated for SMM1 and SMM4. The positions of SMM1 and SMM4 in an diagram suggests that they are border-line Class 0/Class I objects that will evolve into massive stars of masses M⊙ and M⊙, respectively (Fig. 3). The other SMM sources, which have no detected IR emission, might represent earlier phases such as highly embedded class 0 protostars or massive prestellar cores. Their mass estimates suggest that they contain enough material to form new high-mass stars. In particular, SMM3 might represent a candidate massive prestellar object that has formed at the border of the RCW97 HII region.
3 Triggered star formation in the dark cloud ?
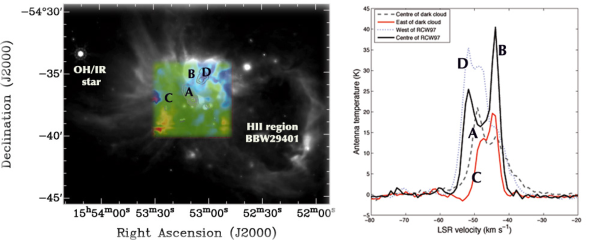
The MIPS 24 m emission image clearly exhibits two infrared bubbles (Fig. 4). The eastern one corresponds to the large bubble seen in the IRAC image (Fig. 1). It is centred on a OH/IR type star (IRAS15502-5424) that is associated with circumstellar outflows of blueshifted OH maser velocities of between -20 and -47 km s-1 (Te Lintel Hekkert et al. 1991). The star LSR velocity is estimated to be -8 km s-1. Interestingly, many molecular clouds and high-mass star-forming regions (SFO75; RCW98) are observed around the bubble with LSR velocities close to the systemic velocity of G327.3-0.6 (Russeil & Castets 2004; Urquhart et al. 2006). Two HII regions are also present near G327.3-0.6. To the north west of the infrared dark cloud is RCW97. To the south west, lies the HII region known as BBW29401, which is the brightest object in the H image at -48 km s-1 (Russeil 2003). The second largest 24 m infrared bubble encompasses BBW29401 (Fig. 4).
The region of G327.3-0.6 was imaged in 12CO using the APEX-2A receiver on the APEX telescope (Wyrowski et al. 2006) . Using these archives observations, a first moment map and line spectra were created to determine whether the infrared bubbles expand, compress the infrared dark cloud, and trigger star formation in G327.3-0.6. The velocity field around G327.3-0.6 can be divided, to a first approximation, across an east-west axis in two velocity colours: a blueshifted velocity ( km s-1) domain to the west, mainly located west of RCW97 (position D in Fig. 4); and a redshifted velocity ( km s-1) domain to the east (position C in Fig. 4). Along the eastern border of the infrared dark cloud traced by the curved infrared filament, the velocity remains at the value of -46 km s-1. The CO line toward the RCW97 HII region exhibits a double profile with peaks at -50 and -46 km s-1 (position B in Fig. 4). Moving to the west and south-west of RCW97, the velocity shifts toward -50 km s-1. The morphology of RCW97 in the infrared also divides into two regions, with SMM3, 5, and 9 in between (Fig. 2). The CO spectrum at the position of SMM4 exhibits multiple velocity components of velocity between -50 and -40 km s-1 (position A in Fig. 3). The 4 km s-1 range of velocity peaks might indicate that the bubbles expand if they are not located at the distance of G327.3-0.6, but in its foreground and background. Similar profiles of CO spectra are modelled by Hennebelle et al. (2006) to explain a rapid increase in external pressure driving a compression wave in the Coalsack region, but of a far smaller velocity range. In any case, the CO line emission is probably self-absorbed by the cloud, which to some extent could also explain the spectra.
The kinematical properties and the detection of the infrared bubbles at both 8 m, a signature of PAH, and at 24 m, a signature of heated interstellar dust, suggest that they possibly trace the interface between expanding fronts traced by PAH emission and the molecular cloud traced by thermal dust emission and gas.
4 Conclusions
The P-ArTéMiS image has detected massive cores embedded within the infrared dark cloud seen in absorption at both 8 and 24 m. Three SMM sources are detected at the western border of the RCW97 HII region. These SMM sources also coincide with infrared dark areas. The luminosity estimates of SMM sources indicate that the massive cores host luminous objects and therefore form high-mass stars.
The RCW97 HII region and the infrared dark cloud emit CO lines within the same velocity range. A possible interpretation is that both the infrared dark cloud and RCW97 are embedded in the same parent molecular cloud. Under the influence of expanding bubbles, star formation now occurs on the edge of RCW97, in the infrared dark cloud and at the border of HII region itself. In conclusion, circumstantial evidence of triggered star formation has been observed toward G327.3-0.6.
Acknowledgements.
This research work has been funded by the Agence Nationale de la Recherche (ANR project: ArTéMiS). Part of this work is based on observations made with the Spitzer Space Telescope, which is operated byJPL and Caltech under a contract with NASA.References
- (1) André, P., Minier, V., Gallais, P. et al. 2008, A&A, 490L, 27
- (2) Bergman, P. 1992, PhD thesis, Chalmers University of Technology, Sweden
- (3) Churchwell, E., Povich, M. S., Allen, D. et al. 2006, ApJ, 649, 759
- (4) Hennebelle, P., Whitworth, A.P., & Goodwin S.P., 2006, A&A, 451, 141
- (5) Hill, T., Thompson, M. A., Burton, M. G. et al. 2006, MNRAS, 368, 1223
- (6) Koo, B.-C., McKee, C. F., Lee, J.-J. et al. 2008, ApJ, 673, 147
- (7) Longmore, S., Burton, M.G., Minier, V., Walsh, A. 2006, MNRAS
- (8) Maury, A., André, Ph., Li, Z.-Y. 2009, A&A, in press
- (9) Motte, F., Bontemps, S., Schilke, P. et al. 2007, A&A, 476, 1243
- (10) Purcell, C., Minier, V., Longmore S. et al. 2009, A&A, in press
- (11) Russeil, D., & Castets, A. 2004, A&A, 417, 107
- (12) Russeil, D., 2003, A&A, 397, 133
- (13) Starck, J.-L., Murtagh, F. 2006, Astronomical image and data analysis. Springer
- (14) Talvard, M., André, P., Rodriguez, L., et al. 2008, in Proceedings of SPIE, 7020
- (15) Te Lintel Hekkert, P., Caswell, J. L., Habing, H. J., et al. 1991, A&AS, 90, 327
- (16) Urquhart, J. S., Thompson, M. A., Morgan, L. K., et al. 2006, A&A, 450, 625
- (17) Wyrowski, F., Menten, K. M., Schilke, P., et al. 2006, A&A, 454L, 91
- (18) Zavagno, A., Pomarès, M., Deharveng, L., et al. 2007, A&A, 472, 835