Discovery of strongly blue shifted mid-infrared [Ne iii] and [Ne v] emission in ULIRGs
Abstract
We report the discovery of blue shifted (v200 km s-1) mid-infrared [Neiii] and/or [Nev] emission in 25 out of 82 ULIRGs (30% of our sample). The incidence of blue shifted [Nev] emission is even higher (59%) among the sources with a [Nev] detection — the tell-tale signature of an active galactic nucleus (AGN). Sixteen ULIRGs in our sample, eleven of which are optically classified as AGN, have [Neiii] blue shifts above 200 km s-1. A comparison of the line profiles of their 12.81 m [Neii], 15.56 m [Neiii] and 14.32 m [Nev] lines reveals the ionization of the blue shifted gas to increase with blue shift, implying decelerating outflows in a stratified medium, photo-ionized by the AGN. The strong correlation of the line width of the [Neiii] line with the radio luminosity indicates that interaction of expanding radio jets with the dense ISM surrounding the AGN may explain the observed neon line kinematics for the strongest radio sources in this sample.
1 Introduction
Galactic-scale outflows are now generally recognized to be important phenomena affecting or even regulating the evolution of galaxies. Starburst-driven winds, powered by the combined kinetic energy released in the outflows from massive stars and supernovae, are capable of depositing metals, dust and energy into the galaxy halo and beyond (Veilleux et al., 2005, and references therein). In galaxies hosting an active galactic nucleus (AGN), radiation-driven AGN winds and collimated outflows of radio plasma, or “jets”, offer another effective mechanism of transporting large amounts of energy and momentum out of the nucleus. In recent years, both processes have been implied in disrupting/fragmenting the obscuring cocoon in merger remnants (Hopkins et al., 2005; Holt et al., 2008).
In ultraluminous infrared galaxies (ULIRGs; LIR=1012-13 L⊙), molecular gas driven into the merging nuclei by the galaxy interaction is capable of supporting both a prolonged massive starburst and/or feeding a (nascent) AGN. This makes ULIRGs prime candidates for observing extreme AGN and/or starburst driven outflows. Indeed, observations of the interstellar Na i-D absorption line (e.g. Heckman et al., 2000; Martin, 2005; Rupke et al., 2005) and optical forbidden low and medium ionization lines (e.g. Heckman et al., 1990; Wilman et al., 1999; Holt et al., 2003; Lípari et al., 2003) indicate that outflows are ubiquitous in ULIRGs and that the momentum and energy injection is in most cases dominated by the starburst (Rupke et al., 2005; Veilleux et al., 2005).
Mid-infrared kinematic studies of forbidden line emission in AGN and ULIRGs are scarce. In their ISO-SWS survey of local AGN, Sturm et al. (2002) reported the detection of line asymmetries and line shifts for some of their sources. Detailed studies could, however, only be performed for the two brightest AGNs, NGC 4151 (Sturm et al., 1999) and NGC 1068 (Lutz et al., 2000). For these it was determined that dust entrained in outflows cannot explain the observed asymmetries in optical forbidden lines. With the advent of Spitzer-IRS sensitive medium-resolution spectroscopy has become available for kinematic studies of AGN and ULIRGs at a resolving power =600. Dasyra et al. (2008) have exploited these capabilities and found the line widths of the high-ionization AGN narrow line tracers 14.32 m [Nev] and 25.89 m [Oiv] to be correlated with the black hole mass for AGNs for which the narrow line region is dominated by virial motion. More recently, Spoon et al. (2009) presented the discovery of strongly blueshifted ionized Ne+, Ne2+ and Ne4+ gas in three ULIRGs and proposed that the outflowing gas may be tracing the disruption of the obscuring medium around buried AGNs in these mergers. In this Letter we report the mid-infrared discovery of strongly blue shifted neon line emission in another 22 ULIRGs.
2 Observations and data reduction
The results presented in this paper are based on high resolution (600; 500 km s-1) 10–37 m Spitzer (Werner et al., 2004) IRS (Houck et al., 2004) spectra of ULIRGs, AGN and starburst galaxies. The core sample is formed by the IRS GTO sample (Weedman et al., 2005; Farrah et al., 2007; Bernard-Salas et al., 2009) which is not complete in any sense.
All sources were observed in staring mode. The 10–19.5 m portion of the spectra were obtained in the IRS Short High (SH) module and the 19.3–37 m sections in the Long High (LH) module. The data reduction proceeded along the same steps as detailed in Spoon et al. (2009). The wavelength calibration of our spectra should be accurate to about 1/5 (SSC priv. comm.) of a resolution element (500 km s-1), which amounts to 100 km s-1. The accuracy is however known to vary from order to order and is generally lowest near the order edges and best toward the order center.
3 Analysis
We have used the non-linear least squares fitting IDL package MPFIT (Markwardt, 2008) to perform single and double component gauss fits to the high-resolution Spitzer emission line spectra of the galaxies in our sample. With these fits we computed the full width and velocity center at 20% of the peak flux (FW20 and VC20, respectively) for all detected lines. Our choice of evaluating at the 20% level rather than at the 50% level is motivated by the presence of weak blue wings in the neon lines.
In this particular study we focus on the mid-infrared fine structure lines of neon, because of their large range in ionization potential (IP = 21, 41, 97 and 127 eV for Ne+, Ne2+, Ne4+ and Ne5+, respectively) and their superior detectability compared to fine-structure lines of argon and sulphur. Also, the rest wavelengths of the five neon lines are well away from the strong Si–O stretching resonance of amorphous silicate grains at 8–12m which is responsible for a factor 3–5 increase in opacity compared to surrounding wavelengths. Furthermore, the three strongest lines, 12.81 m [Ne ii], 15.56 m [Ne iii] and 14.32 m [Ne v], all fall within the same IRS slit, SH, for redshifts up to 0.25. At higher redshifts the 15.56 m [Ne iii] line shifts from the SH slit into the LH slit, while above z=0.32 the 7.65 m [Ne vi] line shifts into the SH slit. Our neon line sample consists of 82 ULIRGs, 3 HyLIRGs, 33 AGNs (both Seyferts and QSOs) and 15 starburst galaxies suited for detailed line profile analysis.
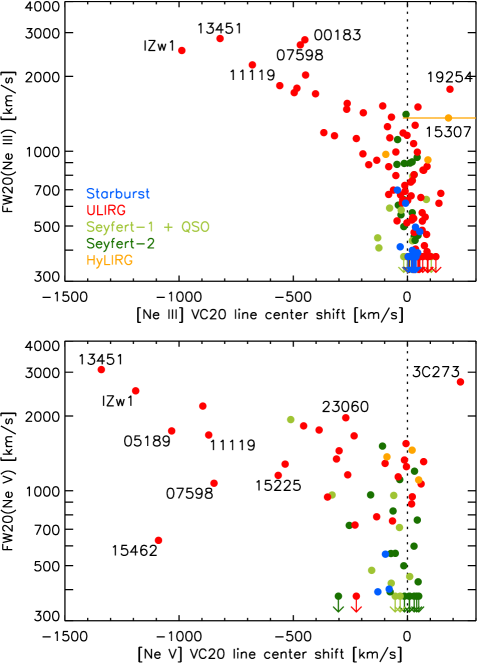
In Fig. 1 we plot for the [Ne iii] and [Ne v] lines the FW20 as a function of VC20 for all sources in our sample. The panels strikingly illustrate the predominance of blue over red shifts among the neon line detections, and the tendency for the VC20 blue shift to be correlated with the FW20 line width. The latter appears to be best established for the [Ne iii] line.
Among our ULIRG sample 25/82 sources (30%) show blue shifted [Ne iii] and/or [Ne v] emission. This fraction excludes sources with VC20 blue shifts less than 200 km s-1, for which we cannot rule out uncertainties in the order-to-order wavelength calibration to mimick a real blue shift. 21/25 ULIRGs (84%) are optically classified as AGN. Among the 32/82 ULIRGs with a [Ne v] detection, the [Ne v] line is found to be blue shifted (VC20-200 km s-1) for 19 ULIRGs (59%), 6 of which are optically classified as type-i and 10 as type-ii AGN.
In Fig. 1 the broadest [Nev] lines not showing clear indications for blue shifts have FW20 line widths of 1500 km s-1. Assuming these lines to arise in NLR gas in keplerian rotation around the central black hole, equation 1 of Dasyra et al. (2008) predicts their black hole masses to be of the order of 109.3 M⊙.
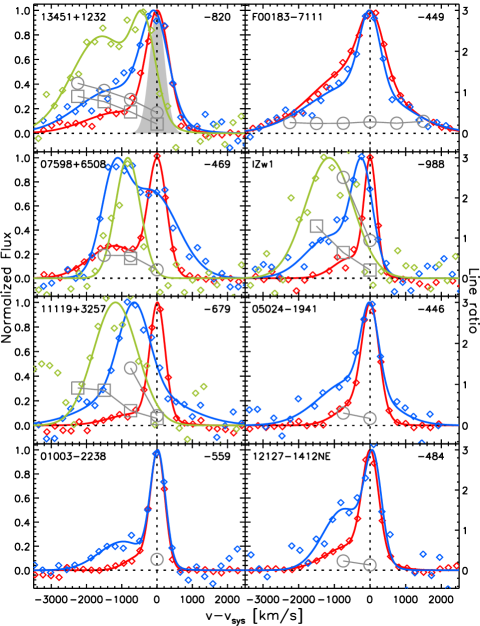
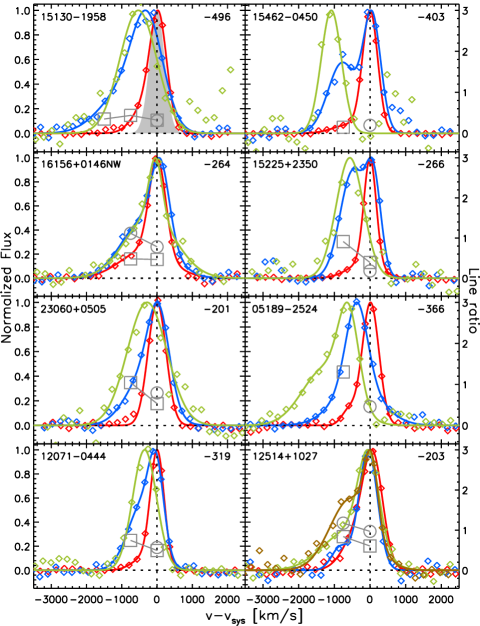
In Figs. 2 and 3 we show overlays of the velocity profiles of the mid-infrared neon lines for 16 sources which have [Neiii] VC20 line center blue shifts of 200 km s-1 or more. The sources are sorted by decreasing FW20 of the [Neiii] line. Eleven of these are optically classified as AGN. The 16 panels reveal a great diversity in line shapes and line center shifts, both from line to line for a single target, as well as from object to object. In some sources the VC20 line center shift is the result of a pronounced blue wing to the systemic component, while in others also the line peak is blue shifted. The latter is more often the case for the [Ne v] line than for the [Ne iii] line, and can also be more extreme. For other sources two gaussian components can be discerned, one at systemic velocity, the other at blue shifted velocities. Examples are the [Ne ii] line of IRAS 07598+6508 and the [Ne iii] line of IRAS 15462–0450. In Table 1 we list the measurements of the kinematic parameters for the sources in Figs. 2 and 3 along with their computed 8–1000 m infrared luminosities and 1.4 GHz radio luminosities.
With lines of various ionization stages of neon measured in the same aperture, it is possible to investigate how the ionization of the gas changes as a function of velocity relative to systemic. In Figs. 2 and 3 we show the change in [Ne iii]/[Ne ii] and [Ne v]/[Ne iii] line ratios at velocity intervals of 750 km s-1 with respect to systemic. Results are only shown for those velocity bins for which the ratio-ed lines are at least 1/20 of the peak line flux throughout the central 600 km s-1 of the velocity bin. For nearly all the sources for which either line ratio is defined over more than one velocity bin, the ionization appears to increase with increasing blue shift. In some cases this can be substantial, like for IZw1, where the [Ne v]/[Ne iii] ratio increases from 0.21 at systemic velocity to 1.3 in the velocity bin centered at -1500 km s-1. A clear exception is IRAS F00183–7111, for which the [Ne iii]/[Ne ii] ratio is remarkably constant over a wide velocity range (Spoon et al., 2009). The above trends can also be recognized in a more visual way by comparing for each source which neon lines have the most pronounced blue wings. This reveals that for the large majority of sources in Figs. 2 and 3 the blue wing of the [Ne v] line extends beyond that of the [Ne iii] line, while the blue wing of the [Ne iii] line extends beyond that of the [Ne ii] line; consistent with an increase in ionization with increasing blue shift.
All sources in Figs. 2 and 3 display an unresolved or barely resolved [Ne ii] component at systemic velocity. Some of these sources also have a [Ne iii] or even [Ne v] systemic component. The excitation of this neon gas holds clues as to the nature of the dominant nuclear ionizing source. In pure starburst galaxies the excitation of the nuclear starburst as measured from the [Ne iii]/[Ne ii] line ratio is usually low and in the range of 0.05–0.2 (Thornley et al., 2000; Bernard-Salas et al., 2009)111A notable exception may be the pure starburst galaxy NGC 7714, which has a measured [Ne iii]/[Ne ii] ratio of 0.75 (Bernard-Salas et al., 2009). In our sample of sixteen excitation conditions like these are met for the systemic components of IRAS 05024–1941, IRAS 07598+6508, IRAS 12127–1412NE, IRAS 15462–0450 and IRAS 15225+2350. Among these IRAS 15225+2350 is the only source optically classified as a starburst. For other sources, like IRAS 12514+1027 and IRAS 16156+0146NW, the [Ne iii]/[Ne ii] ratios for the velocity component at systemic velocity are far higher, 0.97 and 0.78, respectively. In these galaxies the AGN contributes to the systemic [Ne iii] emission, given the detection of a systemic [Ne v] emission component. For IRAS 05189–2524 and IRAS 11119+3257 the clear blue shift of both the [Neiii] and [Nev] emission implies that none of the higher ionization gas in these sources has a keplerian component.
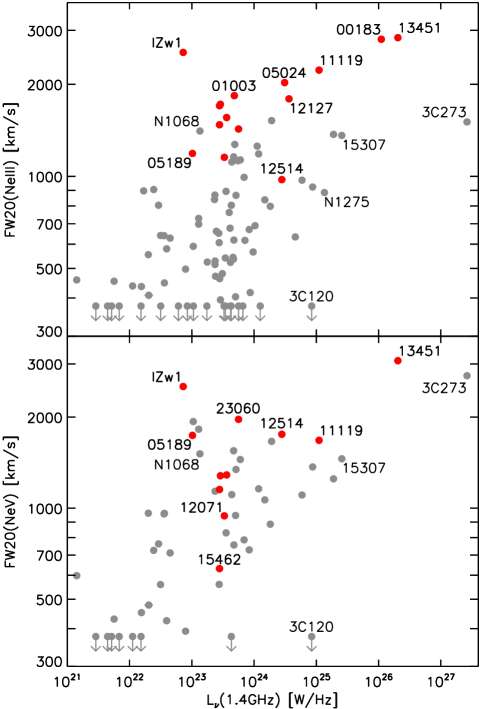
In Fig. 4 we plot the FW20 line width of the [Ne iii] and [Ne v] lines as a function of 1.4 GHz radio luminosity for all AGNs and ULIRGs in our sample. This reveals a clear trend of increasing line width with increasing radio power. A similar trend was first found for the 5007 Å [O iii] line by Wilson & Willis (1980) and Whittle (1985) for samples of radio quiet (L[1.4GHz]1023 W Hz-1) seyfert galaxies and QSOs. In our data the trend appears to persist – albeit with some outliers – well into the radio-loud domain. The sources with strong blue shifts in their [Neiii] lines, all labeled in red, appear to define the upper envelope of this trend or a separate one. This is especially clear in the upper panel. The only obvious exception is the prototypical narrow-line Seyfert 1 (NLS1) galaxy IZw1. Note that IRAS 07598+6508 is not included, as it lacks a 1.4 GHz flux measurement.
4 Discussion
A striking result of our study is the identification of a sizeable subsample of sources which show a strong blue shift of the [Nev] line center in combination with a smaller blue shift of the [Neiii] line center (Figs. 2 and 3) in their spectra. A per-source comparison of the [Neii], [Neiii] and [Nev] profiles strongly suggests these shifts to be the result of an increase in ionization with increasing blue shift in the line. This is supported by the behavior of the [Neiii]/[Neii] and [Nev]/[Neiii] line ratios as a function of line velocity. The most extreme sources in this subsample do not even exhibit a [Nev] component at systemic velocity. Examples are IZw1, IRAS 05189–2524, IRAS 07598+6508, IRAS 11119+3257 and IRAS 15462–0450. This strongly suggests that at least in these sources the observed [Nev] emission cannot arise in NLR gas in keplerian rotation. Instead, the observed line shifts and blue wings imply a nuclear outflow in a highly stratified ISM, ionized by the central source (e.g. IRAS 13451+1232; Spoon et al., 2009). The observed increase of ionization with increasing blue shift then indicates that the bulk of the observed neon gas is moving toward us, and that the outflow speed decreases with distance to the ionizing source. The absence of a matching redward line component to the [Nev] line implies that the line of sight to the far side of the outflow is blocked at mid-infrared wavelengths.
Note that most of these sources are also known from optical spectroscopy to exhibit outflows. Nine of the 16 sources in Table 1 are listed by Lípari et al. (2003) as showing optical outflow signatures, but also IZw1 and IRAS 23060+0505 have known optical outflows (Laor et al., 1997; Wilman et al., 1999).
Results similar to ours were recently reported for a sample of “blue outlier” NLS1 galaxies (Komossa et al., 2008). For these galaxies a similar correlation seems to exist between blue shift and line width of the 5007 Å [Oiii] line as we see for the 15.56 m [Neiii] line (and for the 14.32 m [Nev] line to a lesser degree). The authors favor a scenario in which gas clouds from the narrow line region are entrained in a decelerating wind, powered either by collimated radio plasma jets, or radiation pressure resulting from accretion close to or above the Eddington limit. Similar [Oiii] blue shifts and line widths have also been reported for two young dust-enshrouded radio galaxies: PKS 1549–79 (Tadhunter et al., 2001) and IRAS 13451+1232 (Holt et al., 2003). Both are late stage mergers and the latter is one is part of our sample (Table 1). The broad, blue shifted [Oiii] emission from these sources may trace the expansion of radio jets through the obscuring shell around the buried AGN (Holt et al., 2008).
Given the high radio luminosities for IRAS 13451+1232, IRAS F00183–7111, IRAS 11119+3257, IRAS 12127–1412NE, and IRAS 05024–1941, the apparent correlation between radio luminosity and [Neiii] line width in Fig. 4 may indicate that for these sources interaction of expanding radio jets with the dense ISM surrounding the AGN may explain the observed neon line kinematics.
Four of the sources in Fig. 2 which show outflow signatures in their neon lines do not show the tell-tale mid-infrared signature of AGN activity, the presence of a 14.32 m [Nev] line, in their spectrum. While this may indicate their outflows to be starburst-driven, three of these sources, IRAS F00183–7111, IRAS 05024–1941 and IRAS 12127–1412NE, display strong evidence for the presence of a powerful AGN – e.g. 1.4 GHz radio fluxes 4–10 times in excess of the value expected for star forming galaxies. In addition, IRAS F00183–7111 and IRAS 12127–1412NE have silicate strengths (Ssil; Spoon et al., 2007) below -2.5, indicating an apparent silicate optical depth of at least 2.5 toward the nucleus. Hence, it is conceivable that the non-detection of [Nev] emission in these sources is the result of obscuration (along our line of sight) of the interior, most highly ionized part of the outflow rather than the absence or insignificance of an AGN in these sources. For the fourth galaxy, IRAS 01003–2238, conflicting classifications exist. Several studies have concluded that this galaxy may be starburst-powered (Armus et al., 1988; Rigopoulou et al., 1999; Lutz et al., 1999; Wilman et al., 1999), whereas Allen et al. (1991) classify this galaxy as Seyfert-II and Lípari et al. (2003) refer to it as a QSO. Its Spitzer-IRS spectrum is continuum-dominated (class 1A; Spoon et al., 2007) with a 6.2 m PAH equivalent width more than ten times lower than for starburst galaxies. From the PAH luminosity we calculate a contribution of the starburst to the infrared luminosity of 10–20% (Peeters et al., 2004). This would imply that IRAS 01003–2238 is AGN-dominated222The non-detection of the 14.32 m [Nev] line and of the near-infrared AGN tracer 1.962 m [Sivi] (Veilleux, Sanders & Kim, 1997; Dannerbauer et al., 2005) is not exceptional among AGN-dominated ULIRGs. Other examples are Mrk 231 (Armus et al., 2007) and IRAS 00275–2859 and its outflow likely AGN-powered. The mere detection of blue wings in [Neii] and [Neiii] line profiles in Spitzer-IRS-SH galaxy spectra may hence be a general signpost of AGN activity.
References
- Allen et al. (1991) Allen, D.A., Norris, R.P., Meadows, V.S., Roche, P.F., 1991, /mnras, 248, 528
- Armus et al. (1988) Armus, L., Heckman, T.M., Miley, G.K., 1988, ApJ, 326, L45
- Armus et al. (1989) Armus, L., Heckman, T.M., Miley, G.K., 1989, ApJ, 347, 727
- Armus et al. (2007) Armus, L., et al. 2007, ApJ, 656, 148
- Bernard-Salas et al. (2009) Bernard-Salas, J., et al., 2009, ApJ, submitted
- Buchanan et al. (2006) Buchanan, C.L., McGregor, P.J., Bicknell, G.V., Dopita, M.A., 2006, AJ, 132, 27
- Condon et al. (1998) Condon, J.J., et al. 1998, AJ, 115, 1693
- Dasyra et al. (2008) Dasyra, K.M., et al. 2008, ApJ, 674, L9
- Dannerbauer et al. (2005) Dannerbauer, H., Rigopoulou, D., Lutz, D., Genzel, R., Sturm, E., Moorwood, A.F.M., 2005, A&A, 441, 999
- Drake et al. (2004) Drake, C.L., Bicknell, G.V., McGregor, P.J., Dopita, M.A., 2004, AJ, 128, 969
- Farrah et al. (2007) Farrah, D., et al., 2007, ApJ, 667, 149
- Heckman et al. (1990) Heckman, T.M., Armus, L., Miley, G.K., 1990, ApJS, 74, 833
- Heckman et al. (2000) Heckman, T.M., Lehnert, M.D., Strickland, D.K., Armus, L., 2000, ApJS, 129, 493
- Holt et al. (2003) Holt, J., Tadhunter, C.N., Morganti, R., 2003, MNRAS, 342, 227
- Holt et al. (2008) Holt, J., Tadhunter, C.N., Morganti, R., 2008, MNRAS, 387, 639
- Hopkins et al. (2005) Hopkins, P.F., Hernquist, L., Cox, T.J., Di Matteo, T., Martini, P., Robertson, B., Springer, V., 2005, ApJ, 630, 705
- Houck et al. (2004) Houck, J.R., et al. 2004, ApJS, 154, 18
- Komossa et al. (2006) Komossa, S., et al., 2006, ApJ, 132, 531
- Komossa et al. (2008) Komossa, S., Xu, D., Zhou, H., Storchi-Bergmann, T., Binette, L., 2008, ApJ, 680, 926
- Laor et al. (1997) Laor, A.. Januzzi, B.T., Green, R.F., Boroson, T.A., 1997, ApJ, 489, 656
- Lípari (1994) Lípari, S., 1994, ApJ, 436, 102
- Lípari et al. (2003) Lípari, S., Terlevich, R., Zheng, W., Garcia-Lorenzo, B., Sanchez, S.F., Bergmann, M., 2003, MNRAS, 360, 416
- Lutz et al. (1999) Lutz, D., Veilleux, S., Genzel, R., 1999, ApJ, 517, L13
- Lutz et al. (2000) Lutz, D., et al., 2000, ApJ, 536, 697
- Markwardt (2008) Markwardt, C.B., 2008, in proc. Astronomical Data Analysis Software and Systems XVIII, eds. D. Bohlender, P. Dowler & D. Durand, (San Francisco: Astronomical Society of the Pacific) (astro-ph0902.2850)
- Martin (2005) Martin, C.L., 2005, ApJ, 621, 227
- Peeters et al. (2004) Peeters, E., Spoon, H.W.W., Tielens, A.G.G.M., 2004, A&A, 613, 986
- Rigopoulou et al. (1999) Rigopoulou, D., Spoon, H.W.W., Genzel, R., Lutz, D., Moorwood, A.F.M., Tran, Q.D., 1999, AJ, 118, 2625
- Rupke et al. (2005) Rupke, D.S., Veilleux, S., Sanders, D.B., 2005, ApJ, 632, 751
- Sanders & Mirabel (1996) Sanders, D.B., Mirabel, I.F., 1996, ARA&A, 34, 749
- Spoon et al. (2007) Spoon, H.W.W., Marshall, J.A., Houck, J.R., Elitzur, M., Hao, L., Armus, L., Brandl, B.R., Charmandaris, V., 2007, ApJ, 654, 49
- Spoon et al. (2009) Spoon, H.W.W., Armus, L., Marshall, J.A., Bernard-Salas, J., Farrah, D., Charmandaris, V., Kent, B.R., 2009, ApJ, 693, 1223
- Sturm et al. (1999) Sturm, E., Alexander, T., Lutz, D., Sternberg, A., Netzer, H., Genzel, R., 1999, ApJ, 512, 197
- Sturm et al. (2002) Sturm, E., Lutz, D., Verma, A., Netzer, H., Sternberg, A., Moorwood, A.F.M., Oliva, E., Genzel, R., 2002, A&A, 393, 821
- Tadhunter et al. (2001) Tadhunter, C., Wills, K., Morganti, R., Oosterloo, T., Dickson, R., 2001, MNRAS, 327, 227
- Thornley et al. (2000) Thornley, M.D., Förster Schreiber, N.M., Lutz, D., Genzel, R., Spoon, H.W.W., Kunze, D., Sternberg, A., 2000, ApJ, 539, 641
- Veilleux, Sanders & Kim (1997) Veilleux, S., Sanders, D.B., Kim, D.-C., 1997, ApJ, 484, 92
- Veilleux et al. (1999) Veilleux, S., Kim, D.-C., Sanders, D.B., 1999, ApJ, 522, 113
- Veilleux et al. (2002) Veilleux, S., Kim, D.-C., Sanders, D.B., 2002, ApJS, 143, 315
- Veilleux et al. (2005) Veilleux, S., Cecil, G., Bland-Hawthorn, J., 2005, ARA&A, 43, 769
- Véron-Cetty et al. (2001) Véron-Cetty, M.-P., Véron, P., Gonçalves, A.C., 2001, A&A, 372, 730
- Véron-Cetty & Véron (2006) Véron-Cetty, M.-P., Véron, P., 2006, A&A, 455, 773
- Weedman et al. (2005) Weedman, D.W., et al., 2005, ApJ, 633, 706
- Werner et al. (2004) Werner, M.W., et al., 2004, ApJS, 154, 1
- White et al. (1997) White, R.L., Becker, R.H., Helfand, D.J., Gregg, M.D., 1997, ApJ, 475, 479
- Whittle (1985) Whittle, M., 1985, MNRAS, 213, 33
- Wilman et al. (1999) Wilman, R.J., Crawford, C.S., Abraham, R.G., 1999, MNRAS, 309, 299
- Wilson & Willis (1980) Wilson, A.S., Willis, A.G., 1980, ApJ, 240, 429
- Yun et al. (2001) Yun, M.S., Reddy, N.A., Condon, J.J., 2001, ApJ, 554, 803
| Target name | zaaThe adopted redshift () is defined by the line center of the [Neii] line measured at 80% of the peak flux (VC80). | classbbOptical spectral classifications: (S1) Seyfert type 1, (NLS1) narrow-line Seyfert type 1, (S2) Seyfert type 2, (L) LINER, (H) Hii, (A) Ambiguous. Classifications were taken from (1) Armus et al. (1989), (2) Buchanan et al. (2006), (3) Véron-Cetty & Véron (2006), (4) Veilleux et al. (1999), (5) Veilleux et al. (2002), (6) Wilman et al. (1999), (7) Allen et al. (1991) | FW20[NeII] | FW20[NeIII] | FW20[NeV] | VC20[NeII] | VC20[NeIII] | VC20[NeV] | log L(IR)ccL(IR)=L(8–1000 m) as defined by Sanders & Mirabel (1996) | log L(1.4 GHz)ddRadio luminosities were compiled from: (1) Drake et al. (2004), (2) NVSS (Condon et al., 1998), (3) Yun et al. (2001), (4) FIRST (White et al., 1997) |
|---|---|---|---|---|---|---|---|---|---|---|
| (IRAS) | (km s-1) | (km s-1) | (km s-1) | (km s-1) | (km s-1) | (km s-1) | (L⊙) | (W Hz-1) | ||
| 00183–7111 | 0.3219 | L/A (1,2) | 3037 | 2807 | – | -393 | -449 | – | 12.93 | 26.04 (1) |
| IZw1 | 0.06089 | NLS1 (3) | 400 | 2543 | 2524 | 0 | -988 | -1190 | 11.95 | 22.86 (2) |
| 01003–2238 | 0.1179 | H/S2 (4,7) | 400 | 1837 | – | 0 | -559 | – | 12.29 | 23.68 (2) |
| 05024–1941 | 0.1937 | S2 (5) | 773 | 2026 | – | -66 | -446 | – | 12.39 | 24.49 (2) |
| 05189–2524 | 0.04274 | S2 (5) | 580 | 1189 | 1741 | 0 | -366 | -1032 | 12.16 | 23.01 (3) |
| 07598+6508 | 0.1484 | S1eeBroad absorption line (BAL) QSO (Lípari, 1994) (5) | 2109 | 2678 | 1073 | -626 | -469 | -847 | 12.53 | – |
| 11119+3257 | 0.1903 | S1 (5) | 473 | 2226 | 1677 | 0 | -679 | -870 | 12.66 | 25.04 (2) |
| 12071–0444 | 0.1286 | S2 (5) | 400 | 1155 | 945 | -23 | -320 | -350 | 12.39 | 23.52 (4) |
| 12127–1412NE | 0.1330 | L (5) | 986 | 1794 | – | -146 | -484 | – | 12.17 | 24.56 (2) |
| 12514+1027 | 0.3194 | S2 (6) | 969 | 977 | 1756 | 0 | -203 | -387 | 12.77 | 24.44 (2) |
| 13451+1232 | 0.1214 | S2 (5) | 1228 | 2841 | 3072 | -109 | -821 | -1340 | 12.29 | 26.31 (2) |
| 15130–1958 | 0.1103 | S2 (5) | 702 | 1721 | 1281 | 0 | -496 | -535 | 12.14 | 23.46 (2) |
| 15225+2350 | 0.1386 | H (5) | 400 | 1476 | 1154 | -14 | -266 | -566 | 12.16 | 23.44 (4) |
| 15462–0450 | 0.1001 | NLS1 (3) | 400 | 1703 | 634 | -16 | -403 | -1090 | 12.20 | 23.44 (4) |
| 16156+0146NW | 0.1326 | S2 (5) | 943 | 1558 | 1289 | -109 | -264 | -98 | 12.08 | 23.56 (4) |
| 23060+0505 | 0.1734 | S2/L (6) | 524 | 1429 | 1966 | 0 | -201 | -270 | 12.53 | 23.75 (4) |
Note. — Results from the 1 or 2-component gauss fits to the 12.81 [Neii], 15.56 [Neiii] and 14.32 [Nev] line profiles. FW20 is defined as the full width at 20% of the peak flux, and is corrected for the instrumental profile. We estimate the uncertainty in these quantities to be 5, 10 and 15% for the [Neii], [Neiii] and [Nev] line, respectively. VC20 is the velocity shift of the line center measured at 20% of the peak flux. The uncertainty in the VC20 values of the neon lines are limited to order-to-order wavelength calibration uncertainties which we estimate to be smaller than 150 km s-1.