UB-ECM-PF 09/20
ICCUB-09-222
May 2010
A Phenomenological Study
of Bottom Quark Fragmentation
in Top Quark Decay
G. Corcella1,2,3 and F. Mescia4
1Museo Storico della Fisica e Centro Studi e Ricerche
E. Fermi,
Piazza del Viminale 1, I-00184 Roma, Italy
2Scuola Normale Superiore, Piazza dei Cavalieri 7, I-56126, Pisa, Italy
3INFN, Sezione di Pisa, Largo Fibonacci 3, I-56127, Pisa, Italy
4Universitat de Barcelona,
Departamento d’Estructura i Constituents de la Materia (ECM)
and Institut de Ciencies del Cosmos (ICC),
Av. Diagonal 647, E-08028, Barcelona, Spain
Abstract
Top-quark physics is one of the main fields of investigation at the Tevatron accelerator and, ultimately, at the LHC. We perform a phenomenological analysis of events at hadron colliders, with a focus on observables relying on bottom-quark fragmentation in top-quark decay. In particular, we investigate the -lepton invariant-mass distribution in the dilepton channel and give an estimate of the contribution of bottom fragmentation to the Monte Carlo uncertainty on the top-quark mass reconstruction.
1 Introduction
Bottom-quark fragmentation in top decay () is one of the main sources of uncertainty in the measurements of the top-quark properties, such as its mass. In fact, -quark fragmentation enters in the uncertainty on the -energy scale, contributing to the Monte Carlo systematics on the top-mass reconstruction (see, e.g., the top quark analyses from CDF [1, 2, 3] and D0 [4] at the Tevatron accelerator).
Monte Carlo generators, such as the general-purpose HERWIG [5] and PYTHIA [6] codes, implementing hard-scattering processes, parton showers, hadronization and underlying event, are widely used to simulate events at hadron colliders. In particular, HERWIG and PYTHIA simulate the hadronization transition according to the cluster [7] and string [8] models111As an option, PYTHIA allows one to interface its showers to fragmentation functions, such as the Bowler [9] or Peterson [10] models., respectively, containing a few parameters which need to be tuned to the data, e.g., from LEP or SLD experiments.
In order to estimate the contribution of bottom fragmentation to the Monte Carlo systematic error on top-quark observables, one typically compares the results yielded by the two codes and varies the hadronization parameters describing the transition within suitable ranges. At the LHC, it is worthwhile mentioning the study [11], where it was proposed that one could reconstruct the top-quark mass in the dilepton channel, by using the decays and , being a -flavoured hadron. The top mass was then fitted from the peak value of the or invariant-mass spectra, being a charged lepton in decay . This analysis estimates that, in the phase of luminosity pb-1, after setting suitable cuts on transverse momenta and rapidities of final-state leptons, one can reconstruct the top mass with an error GeV. The contribution of -fragmentation to is found to be about 600 MeV and is estimated by using the PYTHIA generator along with the Peterson fragmentation function222The Peterson fragmentation function reads: , where is the hadron energy fraction, a normalization constant and a parameter to be tuned to the experimental data., varying the parameter in the range . At the Tevatron, the recent CDF analysis [3] identifies jets containing a candidate muon from semileptonic -decays (so-called ‘soft muon -tagging’) and measures the top mass by using the invariant mass , with still coming from -boson decay. The overall Monte Carlo uncertainty, due to the modelling of production and decay in HERWIG and PYTHIA, including -fragmentation as well333The uncertainties due to the treatment of initial- and final-state radiation were, however, calculated separately from the Monte Carlo systematic error., was estimated to be GeV [3].
From the point of view of Monte Carlo generators, however, the default parametrizations of both HERWIG and PYTHIA are unable to fit LEP and SLD data on -hadron production at the pole [12]. In Ref. [12] the cluster and string models were tuned to such data: after the fits, PYTHIA managed to describe the -energy spectrum very well, whereas HERWIG was only marginally consistent.
Following [12], in this paper we wish to perform a phenomenological study of events at hadron colliders, taking particular care about observables relying on -quark fragmentation in top decay, and investigate possible discrepancies between HERWIG and PYTHIA, which may affect the Monte Carlo systematic error on the top-mass reconstruction. In particular, our investigation will be especially useful for the top mass extractions according to Refs. [11, 3], as those methods strongly depend on the Monte Carlo simulation of the transition in top decay.
In Section 2 we shall briefly review the results of Ref. [12] on fitting cluster and string models to LEP and SLD -production data. In Section 3 we shall present a few results for observables in events depending on the description of -quark fragmentation. In Section 4, as an example of application of our analysis, we shall try to estimate the uncertainty on the extraction of in the dilepton channel from a fit of the invariant-mass distribution, being a lepton from decay. In Section 5 we shall summarize the main results of our study and make some concluding remarks.
2 Fitting hadronization models to LEP and SLD -production data
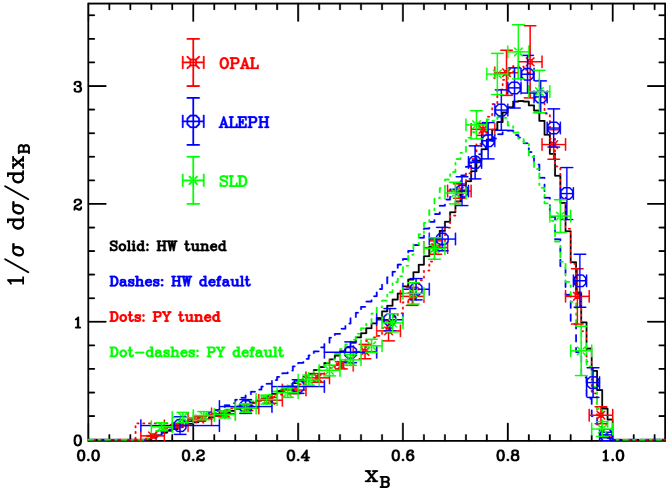
In this section we shall shortly summarize the main findings of Ref. [12], where the cluster and string models, which simulate hadronization in HERWIG and PYTHIA, were fitted to LEP and SLD data on the -hadron spectrum. Ref. [12] considered data on -flavoured hadron production from the LEP experiments ALEPH [13] and OPAL [14], and from SLD [15]. In particular, the ALEPH sample was made of -mesons, whereas OPAL and SLD also had a small fraction of -baryons, such as the . The spectrum in annihilation at the pole was studied in terms of the quantity
| (1) |
In Eq. (1), and are the and four-momenta, respectively. In rest frame, , the normalized -energy fraction. As for PYTHIA, it was chosen the scenario with parton showers ordered in virtuality, with an option to reject non-angular-ordered emissions. Angular ordering is correctly satisfied by the HERWIG cascades [16, 17].
The default parametrizations of HERWIG and PYTHIA 444 Ref. [12] used HERWIG 6.506 and PYTHIA 6.220. The latest FORTRAN versions do not actually present any new features which may change the conclusions of Ref. [12]. were unable to acceptably reproduce such data, yielding and 467.9/61, respectively. In [12], the two event generators were therefore fitted to the spectra: the choice of the authors was to tune only parameters associated with hadronization and leave unchanged the ones related to hard scattering and parton showers. As pointed out in [12], whenever one fits just one measured quantity, such as , the risk is that one may spoil the comparison with other observables, e.g., light-flavour fragmentation. Therefore, the fits performed in [12] are not an official tuning of HERWIG and PYTHIA, but just an attempt to understand whether the description of heavy-flavour fragmentation could be improved.
Table 1 summarizes the results of such fits: the per degree of freedom refers to all data points, as if they were coming from one single experiment. In HERWIG, one fitted CLSMR(1) and CLSMR(2), namely the Gaussian smearing of the hadron direction with respect to the parent quark, PSPLT(2), a parameter ruling the mass spectrum of -flavoured cluster decays, CLPOW, controlling the yield and meson/baryon production, and DECWT, determining the decuplet/octet ratio. As for PYTHIA, the three fitted parameters, namely PARJ(41), PARJ(42) and PARJ(46), are the , and quantities in the Lund/Bowler fragmentation function [6, 9]:
| (2) |
and being the -quark mass and the -hadron transverse mass respectively.
| HERWIG | PYTHIA |
|---|---|
| CLSMR(1) = 0.4 (0.0) | |
| CLSMR(2) = 0.3 (0.0) | PARJ(41) = 0.85 (0.30) |
| DECWT = 0.7 (1.0) | PARJ(42) = 1.03 (0.58) |
| CLPOW = 2.1 (2.0) | PARJ(46) = 0.85 (1.00) |
| PSPLT(2) = 0.33 (1.00) | |
| = 222.4/61 (739.4/61) | = 45.7/61 (467.9/61) |
From Table 1, we learn that, after the fit, PYTHIA reproduces pretty well the data, while HERWIG is only marginally consistent with the spectra, although its description of the data is much better with respect to the default parametrization. The comparison between data, default and tuned HERWIG and PYTHIA is presented in Fig. 1. We note that PYTHIA, after the tuning, gives an excellent description of the data throughout all -range, while the HERWIG prediction, even after fitting the cluster model, is still below the data around the peak and above the data for middle values of .
The problems exhibited by HERWIG when its predictions are compared withthe distributions, have been mostly fixed in the object-oriented version HERWIG++ [18], which implements an improved cluster model. In fact, Ref. [19] showed that it is enough tuning the shower cutoff to obtain a rather good fit of the SLD data. Although the employment of HERWIG++ and of the corresponding PYTHIA 8 code [20], written in C++, should be recommended, and not only for the better description of -hadronization, the FORTRAN versions of these generators are still widely used. In particular, FORTRAN HERWIG provides the MC@NLO code [21], which implements the hard-scattering process at next-to-leading order (NLO), with parton showers and hadronization. Moreover, the so-called matrix-element generators, such as, for example, the ALPGEN [22] or MadGraph [23] programs, often employed to study backgrounds to events, are interfaced to FORTRAN versions of HERWIG and PYTHIA for showers and hadronization. It is therefore still useful trying to improve the -fragmentation sector in the FORTRAN generators and compare their results for a few observables relevant to top-quark decay. The best fits presented in Table 1 will be the starting point for the phenomenological analysis which we shall carry out for events at hadron colliders.
Before closing this section, we point out that heavy-quark energy distributions can also be obtained by using resummed calculations, such as Ref. [24] for annihilation, Ref. [25, 26] for top decays and Ref. [27] for , being the Standard Model Higgs boson. Such computations, based on the perturbative-fragmentation formalism [28], resum soft/collinear logarithms with an accuracy which is usually higher than parton-shower algorithms: therefore, comparisons with resummations, as done in [12], are useful to validate Monte Carlo generators and understand the role played by subleading logarithms. However, resummed computations are too inclusive to allow a complete investigation of final states. Also, they still need to be supplemented by phenomenological non-perturbative fragmentation functions, such as the models [9, 10, 29], to be comparable with experimental data on hadron production. In the following, we shall not only investigate the -hadron energy fraction, but also observables for which resummed calculations are not currently available. Monte Carlo generators, giving an exclusive description of final states, are thus the best available tool to carry out our study.
3 Top-quark decay observables at hadron colliders
Given the HERWIG and PYTHIA best fits presented in the above Section, and relying on the universality of the hadronization transition, we wish to make predictions for top-decay observables depending on -quark fragmentation, taking particular care about quantities which might be useful for Tevatron or LHC phenomenology.
3.1 -hadron energy fraction in top decay
Let us consider top quark decay:
| (3) |
where stands for extra parton radiation, and the subsequent transition . A straightforward extension of the variable in Eq. (1) is the following quantity:
| (4) |
is a Lorentz-invariant variable which corresponds to the normalized -energy fraction in top rest frame. At LEP and SLD, since the collision takes place at the pole, the laboratory coincides with the rest frame. On the contrary, at the Tevatron or LHC, the laboratory frame is not the top-quark rest frame, and therefore, in order to measure the quantity, one would need all four components of top and momenta. Such a measurement is obviously not straightforward; however, it is still interesting presenting the spectrum in top decay, in such a way to compare HERWIG and PYTHIA before and after the fits to data and understand how much depends on the top quark mass. We point out that, as already observed in [12, 25], neglecting the top width, which is a reasonable approximation as long as experimental analyses set cuts of order 10 GeV or higher on the energy of final-state jets [30], the spectrum is roughly independent of the production process. Therefore, in such an approximation, our results will be valid for both Tevatron and LHC: unless stated differently, the actual plots which will shall present are anyway obtained running HERWIG and PYTHIA in the LHC environment, i.e. collisions at TeV.
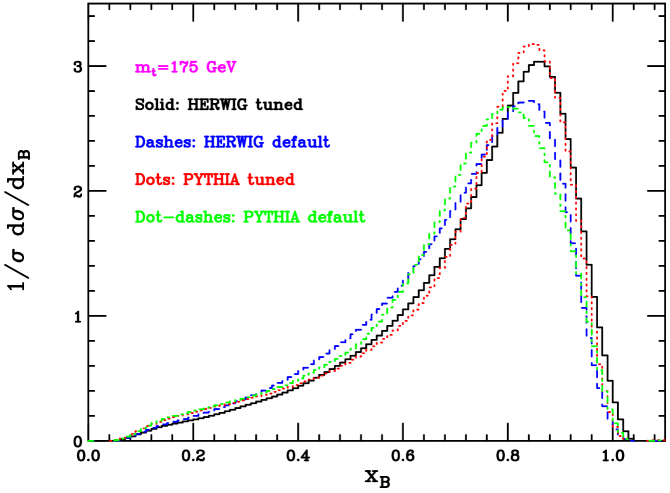
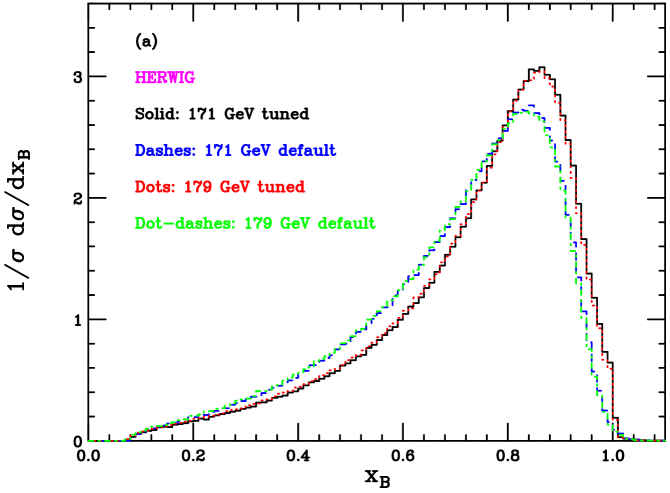
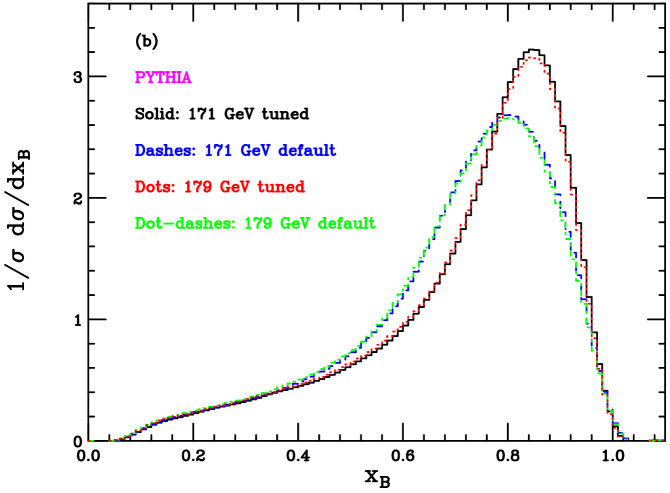
Fig. 2 exhibits the -energy distribution in top decay yielded by PYTHIA and HERWIG, for GeV, using default and tuned parametrizations. As in the case, the shapes of the spectra are remarkably modified once we fit string and cluster models: after the tuning, the distributions are somewhat narrower and shifted towards higher values of . The comparison of the two tuned codes is similar to what observed in Fig. 1: HERWIG yields a broader distribution and is above PYTHIA for very large and middle values of , whereas it is below PYTHIA around the peak and at small . In Fig. 3 we present the same spectra, but varying the top mass from 171 to 179 GeV, and learn that exhibits negligible dependence on the top mass, independently of the hadronization model which one uses. This is an interesting result: if one were able to measure , it would be an ideal quantity to fit -fragmentation parameters, with almost no dependence on the top-quark mass. However, as said above, for the time being, in top decays is a difficult observable to measure.
3.2 -lepton invariant-mass distribution in the
dilepton
channel
In this subsection, we investigate the -lepton invariant-mass () distribution in the dilepton channel, where is a -flavoured hadron coming from top decay and a charged lepton in decay (). In fact, such a quantity is closely related to invariant masses and , where the ’s and ’s come from decays, used in Refs. [3, 11], to fit the top mass at Tevatron and LHC, respectively.
The invariant mass is another boost-invariant observable, just relying on top decay and not depending on the top-production phase. Such a quantity was already studied in Refs. [31, 32], in order to investigate the impact of matrix-element corrections to simulations of top decays in HERWIG [33]. Ref. [32] also checked that the distribution is roughly the same at the Tevatron and at the LHC, thus confirming that it is indeed independent of the production mechanism, which is mainly at the Tevatron and at the LHC.
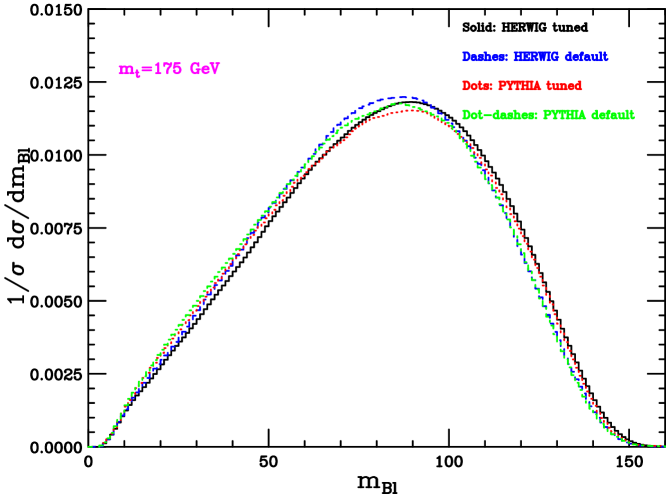
As done in the previous subsection for the quantity, we first compare HERWIG and PYTHIA for a given value of and then we vary the top mass. Fig. 4 presents the default and tuned spectra for GeV: in both codes, the fit to the data has the effect to shift the distributions towards larger invariant-mass values 555The results in Figs. 4 and 5 look different from the spectra presented in [31, 32], which were obtained using an unofficial preliminary HERWIG version, wherein a few bugs were later found. The effect of matrix-element corrections to the HERWIG simulation of top decays found in [31, 32] is nevertheless still confirmed, when using the latest versions, with the bugs fixed.. As for the comparison between HERWIG and PYTHIA, the shapes of the curves yielded by the two generators exhibit visible differences: HERWIG is above PYTHIA around the peak and below at small . At large the discrepancy becomes very little, with HERWIG still giving a slightly higher differential cross section.
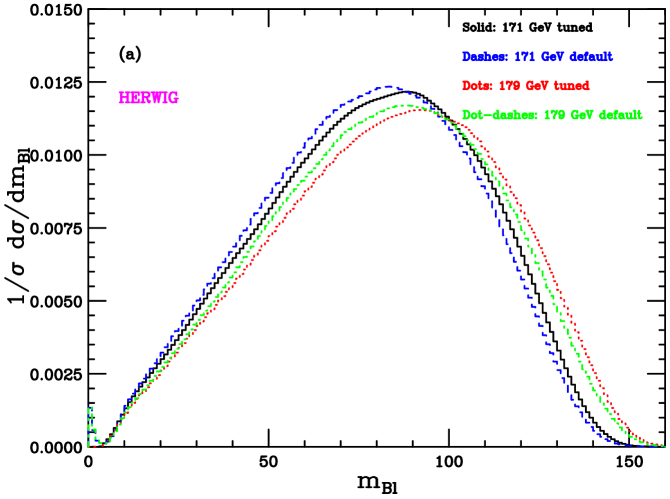
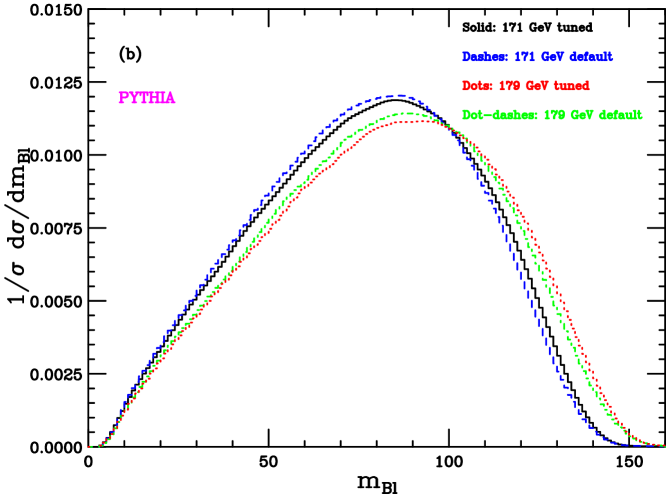
Looking at Fig. 5, we learn that the behaviours of HERWIG and PYTHIA spectra with respect to are rather similar, in both default and tuned versions. Increasing shifts the spectrum towards higher invariant masses, as one would expect on physical grounds. We can anticipate that in Section 4 we shall thoroughly study the above spectra: we shall compute the Mellin moments and discuss of a possible extraction of the top mass from a fit of the mean value .
3.3 -hadron transverse momentum spectrum
In this subsection, we investigate the transverse momentum of the -hadron in top decay in the laboratory frame. Clearly, such an observable is not Lorentz invariant and, unlike and , it does not depend only on the decay, but the production phase is essential in determining its spectrum. However, it is still useful to study such a quantity: a measurement of is more feasible than and, as it happens, e.g., for the transverse momentum in Drell–Yan processes, can be useful to study the experimental acceptance for top events [34]. In the spectrum, the hadronization parameters will certainly play a role, although, as explained above, a number of other quantities, in particular initial-state radiation, are relevant.
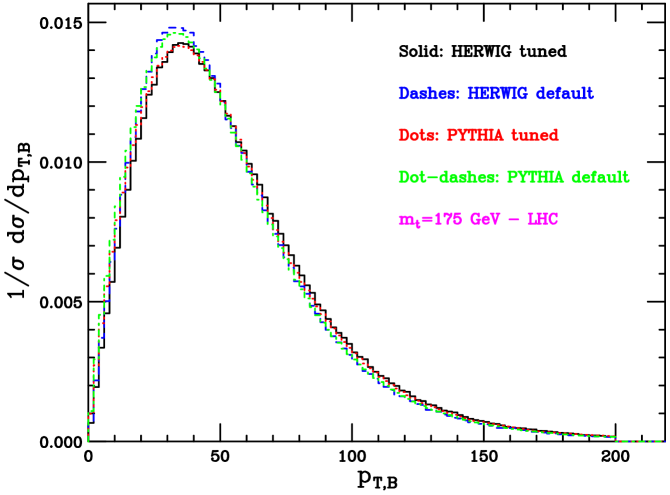
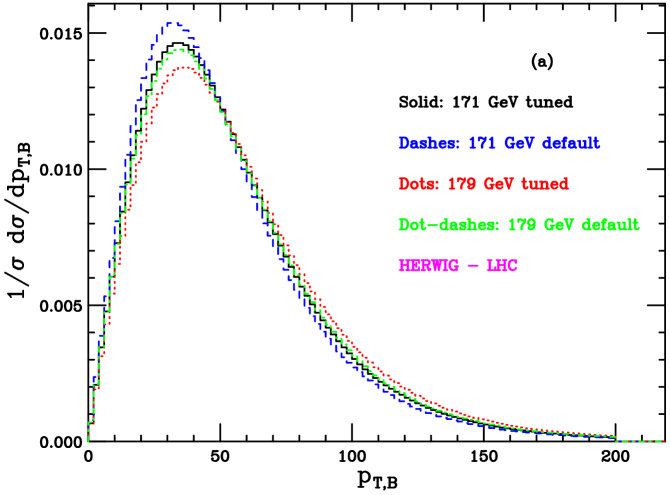
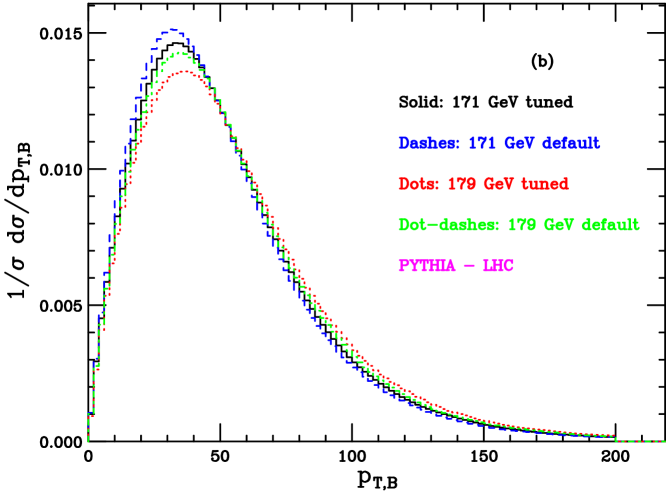
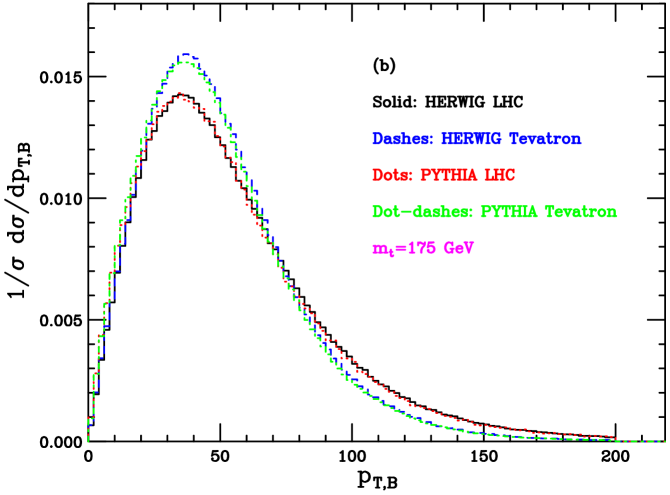
In Fig. 6 we present the comparison between HERWIG and PYTHIA, default and tuned, for GeV at the LHC; in Fig. 7 we plot the distribution for and 179 GeV. As far as this observable is concerned, the discrepancy between HERWIG and PYTHIA looks smaller than for and , with PYTHIA being slightly above HERWIG at small and below for middle-large transverse momenta. The effect of the tuning to LEP and SLD data is similar for both generators: less events at small and at the peak, but a higher differential cross section for 60 GeV. To be more quantitative, the average value of for GeV reads and 50.59 GeV, for default HERWIG and PYTHIA respectively. After tuning cluster and string models, HERWIG yields GeV, whereas PYTHIA GeV. As for the top-mass dependence of this observable, a higher results in less events around the peak value, and more with a large transverse-momentum -flavoured hadron.
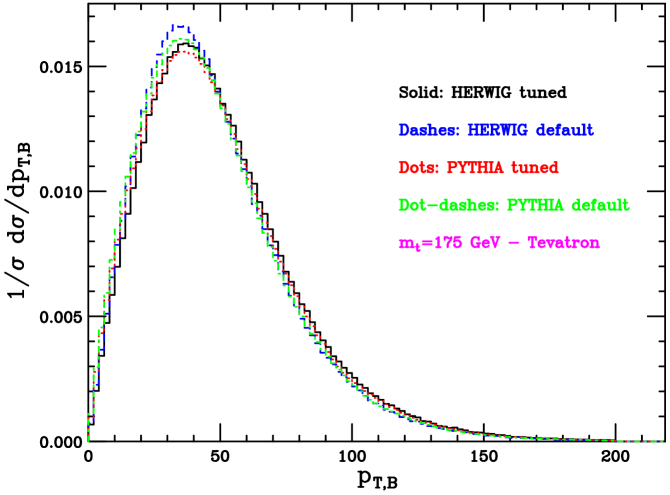
Since we observed that is not Lorentz-invariant and depends on the production mechanism, it is interesting investigating such a quantity even at the Tevatron accelerator, i.e. collisions at 1.96 GeV, where the production mechanism is mostly , whereas gluon-gluon fusion dominates at the LHC. In Fig. 8 we present the transverse-momentum distribution at the Tevatron, for GeV, given by default and tuned HERWIG and PYTHIA. We learn that at Tevatron energies the effect of the fits is qualitatively similar to what found at the LHC: less events are simulated at small transverse momentum and about the peak, while there are more top-decay -hadrons at large . The mean values are 47.91 and 47.66 GeV, according to default HERWIG and PYTHIA, whereas, when using the parametrization in Table 1, HERWIG gives 50.23 and PYTHIA 49.02 GeV. Hence, at both Tevatron and LHC, the two codes are in better agreement when using the default parametrizations, while the discrepancy gets larger after the tuning.
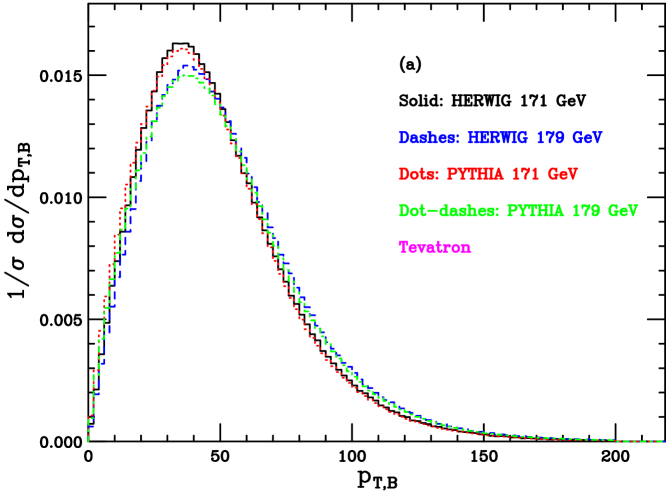
In Fig. 9 we use instead the two codes with the fragmentation parameters tuned to the LEP and SLD data: in Fig. 9 (a) we show the spectrum for and 179 GeV, while, for the sake of comparison, in Fig. 9 (b) we present HERWIG and PYTHIA predictions at the Tevatron and at the LHC, using GeV. The dependence of the spectrum on the top mass is like the one observed at LHC: a higher shifts the transverse-momentum distribution towards larger . As for the comparison Tevatron/LHC, it shows indeed that we are dealing with an observable depending on the production stage and on the boost from the laboratory frame to the top rest frame, where top decay is performed. At the Tevatron, due to the lower available energy, most events are simulated for GeV; at the LHC, the large- tail is instead more relevant with respect to the Tevatron.
4 Extracting the top mass from the spectrum
As the -lepton invariant mass is a Lorentz-invariant quantity, depending only on top decay and visibly sensitive to the top mass (see Fig. 5), we can think of using to fit . Also, after convoluting with the or spectra, one will obtain the and distributions, employed in Refs. [11, 3] to extract at the LHC and at the Tevatron, respectively.
Ideally, if we had data on , we may directly use them to validate the Monte Carlo tools and fit the cluster/string models. For the time being, we try to express the spectra in terms of the top mass by computing the first few Mellin moments in the range 171 GeV 179 GeV. After observing that the fits to LEP and SLD do have a strong impact on top-decay observables depending on -fragmentation, hereafter we shall stick to the best-fit parametrizations quoted in Table 1.
| (GeV) | (GeV) | (GeV2) | (GeV3) | (GeV4) |
|---|---|---|---|---|
| 171 | 78.39 | |||
| 173 | 79.52 | |||
| 175 | 80.82 | |||
| 177 | 82.02 | |||
| 179 | 83.21 |
| (GeV) | (GeV) | (GeV2) | (GeV3) | (GeV4) |
|---|---|---|---|---|
| 171 | 77.17 | |||
| 173 | 78.37 | |||
| 175 | 79.55 | |||
| 177 | 80.70 | |||
| 179 | 81.93 |
We present the first four moments yielded by HERWIG and PYTHIA in Tables 2 and 3, respectively 666We remind that, since we plotted everywhere, our distributions are normalized to unity.. From the comparison, we learn that HERWIG sistematically yields moments which are larger than PYTHIA, as was already predictable looking at Fig. 4. Furthermore, according to both codes, the moments of the spectrum linearly increase with respect to the top mass.
In order to give an estimate of the Monte Carlo uncertainty due to modelling -quark fragmentation, we perform a linear fit of the average value in terms of , by means of the least-square method 777Of course, given the numbers in Tables 2 and 3, a linear fit will work even for the higher Mellin moments of the spectrum.. The linear fit works very well and the best fits are the following:
| (5) | |||||
| (6) |
where is the mean square deviation in the fit and the subscripts H and P refer to HERWIG and PYTHIA, respectively.
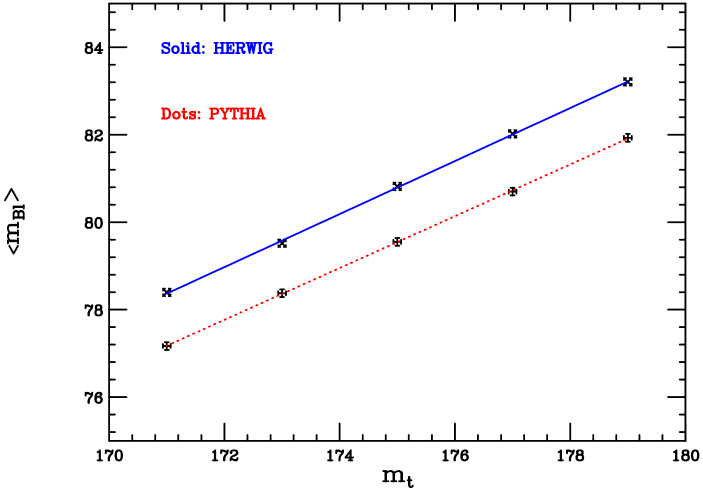
The best-fit straight lines, as a function of , are plotted in Fig. 10: we see that, for a given measurement of , the extracted values of can be quite different according to whether one uses HERWIG or PYTHIA. In fact, as Tables 2 and 3 tell us that the typical difference between HERWIG and PYTHIA is GeV, the corresponding uncertainty inferred on can be up to about GeV, given the slopes of the straight lines in Fig. 10. Such a value of is clearly quite large, and much above the 600 MeV quoted in [11], thus showing that probably such an error, obtained varying the parameter in the Peterson hadronization model, may have been underestimated. Our is instead closer to the 2.1 GeV determined in [3] as the Monte Carlo systematic error when measuring from the spectrum at CDF.
Our analysis, however, assumes that one is indeed able to measure the full spectrum, which is obviously quite ideal. A more realistic estimate of due to the -quark hadronization can be obtained if we discard the low- and high- tails and restrict ourselves, e.g., to the range 50 GeV 120 GeV. In this range, we obtain the truncated moments of the spectrum presented in Tables 4 and 5. The discrepancy between HERWIG and PYTHIA is clearly much smaller after we cut the tails of the spectrum; the linear relation of the moments with respect to is nonetheless still preserved.
| (GeV) | (GeV) | (GeV2) | (GeV3) | (GeV4) |
|---|---|---|---|---|
| 171 | 84.64 | |||
| 173 | 85.01 | |||
| 175 | 85.43 | |||
| 177 | 85.78 | |||
| 179 | 86.09 |
| (GeV) | (GeV) | (GeV2) | (GeV3) | (GeV4) |
|---|---|---|---|---|
| 171 | 84.42 | |||
| 173 | 84.79 | |||
| 175 | 85.13 | |||
| 177 | 85.45 | |||
| 179 | 85.77 |
As done when considering the full range, we try to express the average value in terms of , according to a straight line. The best linear fits read:
| (7) | |||||
| (8) |
The corresponding straight lines are plotted in Fig. 11.
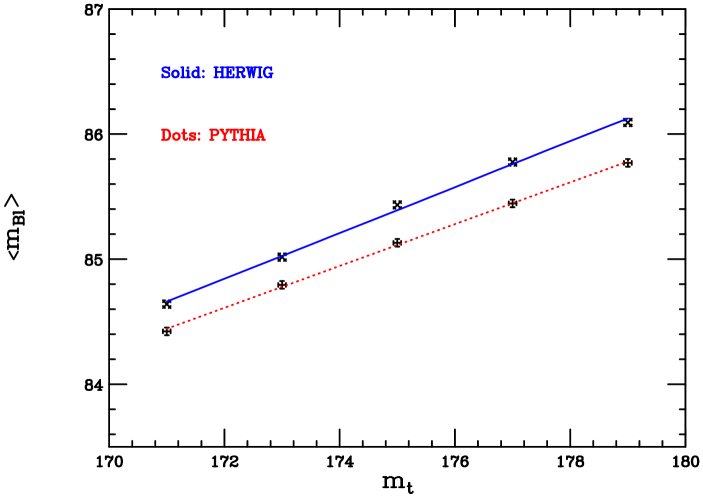
Since the found discrepancy between HERWIG and PYTHIA is about MeV, and given the slopes of the straight lines in Fig. 11, the induced uncertainty on the top mass, thinking of extracting it by fitting the mean value , goes down to GeV. It is nonetheless still a quite large value, well above the estimate of the bottom-fragmentation contribution to the Monte Carlo error given in [11].
5 Conclusions
We performed a phenomenological study of bottom quark fragmentation in top-quark decay, using HERWIG and PYTHIA, the two most popular general-purpose Monte Carlo event generators. We observed that the default parametrizations are unable to reproduce -hadron production data from ALEPH, OPAL and SLD, and therefore we used an ‘unofficial’ fit of the hadronization cluster and string models, following [12], in such a way to improve the description of such data.
We used this tuning to make predictions for a few observables in events, depending on modelling -fragmentation in top decay, and found that the fits to data have a remarkable impact even on top-decay observables. Moreover, HERWIG and PYTHIA results still exhibit visible discrepancies, which depend on the different quality of the fits to LEP and SLD data. We studied the -energy fraction in top decay, which turned out to be roughly independent of the top mass, the -lepton invariant mass , exhibiting relevant dependence on , and the transverse momentum in the laboratory frame, which can still be useful to determine the experimental acceptance for events, although it is not Lorentz-invariant and depends on the top-production mechanism as well.
Among these quantities, we have taken particular care about , whose spectrum is also interesting for the purpose of the analyses [11, 3], where the top mass is reconstructed by using final states with leptons and or muons.. We calculated the Mellin moments of the distribution and parametrized the average value as a linear fit of the top mass. The found discrepancies between HERWIG and PYTHIA result in an uncertainty on the top mass, assuming that one can extract it from a fit of , which can be up to GeV. The Monte Carlo error due to modelling -fragmentation decreases down to GeV, if we restrict our analysis to the region around the invariant-mass peak, namely 50 GeV GeV. As such estimates are quite large, our study confirms that bottom fragmentation will play a crucial role in top-quark analyses at Tevatron and LHC and that having event generators reliably describing the transition will be fundamental.
A possible extension of our work clearly consists in employing the object-oriented versions of HERWIG and PYTHIA, written in C++. In fact, the discrepancies here emphasized mainly depend on the fact that, even after the fits, FORTRAN HERWIG is only marginally consistent with -hadron data from LEP and SLD. Therefore, since the preliminary results presented in [19], obtained by comparing an early version of HERWIG++ with the SLD -data, look encouraging, we believe that a lower can eventually be obtained when using the C++ programs. However, the analysis carried out throughout this paper will still be valid as long as one uses MC@NLO or matrix-element generators interfaced to FORTRAN HERWIG and PYTHIA for showers and hadronization.
We also stressed the fact that the fits carried out in Ref. [12] and reviewed in Section 2 just account for the -hadron data and may spoil the comparison with other observables, e.g., light-hadron data. In perspective, the advanced fitting code Professor [35] should be a very useful tool, as it is capable of improving the description of the spectrum, but without spoiling too much possible agreement with other data. The use of the Professor program is currently in progress.
Furthermore, let us point out that, whereas in our study we aimed at predicting a few top-decay observables taking non-perturbative information from annihilation, possible hadron-collider data, for example on the distribution, should be very useful to validate tools such as HERWIG or PYTHIA. This way, one could directly fit such spectra and tune the parameters of cluster and string models, without necessarily relying on the fits to the data. For the time being, we still believe that it can be nevertheless very interesting reconsidering the studies [11, 3], as they strongly rely on the Monte Carlo treatment of bottom fragmentation in top decay, and understand whether the results on quoted in [11, 3] should change if one used the tuned versions of cluster and string models, as we did throughout this paper.
Acknowledgements
We are grateful to K. Melnikov who pointed out an error in the former version of this work. We acknowledge discussions with L. Cerrito, S. Leone, M.L. Mangano, M.H. Seymour, R. Tenchini and T. Sjöstrand on these and related topics. The work of F.M. has been supported in part by CUR Generalitat de Catalunya under project 2009SGR502 and by the Consolider-Ingenio 2010 Program CPAN (CSD2007-00042).
References
- [1] A. Abulencia et al., CDF Collaboration, Phys. Rev. D 75 (2007) 071102(R).
- [2] T. Aaltonen et al., CDF Collaboration, Phys. Rev. D 79 (2009) 072001.
- [3] T. Aaltonen et al., CDF Collaboration, arXiv:0906.5371 [hep-ex].
- [4] V.M. Abazov et al., D0 Collaboration, Phys. Rev. D 74 (2006) 092005.
- [5] G. Corcella et al., JHEP 0101 (2001) 010.
- [6] T. Sjöstrand, S. Mrenna and P. Skands, JHEP 0605 (2006) 036.
- [7] B.R. Webber, Nucl. Phys. B 238 (1984) 492.
- [8] B. Andersson, G. Gustafson, G. Ingelman, T. Sjöstrand, Phys. Rept. 97 (1983) 31.
- [9] M.G. Bowler, Z. Phys. C 11 (1981) 169.
- [10] C. Peterson, D. Schlatter, I. Schmitt and P.M. Zerwas, Phys. Rev. D 27 (1983) 105.
- [11] A. Kharchilava, Phys. Lett. B 476 (2000) 73.
- [12] G. Corcella and V. Drollinger, Nucl. Phys. B 730 (2005) 82.
- [13] A. Heister et al., ALEPH Collaboration, Phys. Lett. B 512 (2001) 30.
- [14] G. Abbiendi et al., OPAL Collaboration, Eur. Phys. J. C 29 (2003) 463.
- [15] K. Abe et al., SLD Collaboration, Phys. Rev. Lett. 84 (2000) 4300.
- [16] G. Marchesini and B.R. Webber, Nucl. Phys. B 238 (1984) 1.
- [17] G. Marchesini and B.R. Webber, Nucl. Phys. B 310 (1988) 461.
- [18] M. Bahr et al, arXiv:0804.3053 [hep-ph];
- [19] S. Gieseke, P. Stephens and B.R. Webber, JHEP 0312 (2003) 045.
- [20] T. Sjöstrand, S. Mrenna and P. Skands, Comput. Phys. Commun. 178 (2008) 252.
- [21] S. Frixione and B.R. Webber, JHEP 0206 (2002) 029.
- [22] M.L. Mangano, M. Moretti, F. Piccinini, R. Pittau and A. Polosa, JHEP 0307 (2003) 001.
- [23] J. Alwall, P. Demin, S. de Visscher, R. Frederix, M. Herquet, F. Maltoni, T. Plehn, D.L. Rainwater and T. Stelzer, JHEP 0709 (2007) 028.
- [24] M. Cacciari and S. Catani, Nucl. Phys. B 617 (2001) 253.
- [25] G. Corcella and A.D. Mitov, Nucl. Phys. B 623 (2001) 247.
- [26] M. Cacciari, G. Corcella and A.D. Mitov, JHEP 0212 (2002) 015.
- [27] G. Corcella, Nucl. Phys B 705 (2005) 363.
- [28] B. Mele and P. Nason, Nucl. Phys. B 361 (1991) 626.
- [29] V.G. Kartvelishvili, A.K. Likehoded and V.A. Petrov, Phys. Lett. B 78 (1978) 615.
- [30] Yu.L. Dokshitzer, V.A. Khoze and L.H. Orr, Nucl. Phys. B 403 (1993) 65.
- [31] G. Corcella, J. Phys. G 26 (2000) 634.
- [32] G. Corcella, M.L. Mangano and M.H. Seymour, JHEP 0007 (2000) 004.
- [33] G. Corcella and M.H. Seymour, Phys. Lett. B 442 (1998) 417.
- [34] S. Leone, private communication.
-
[35]
P. Abreu et al., DELPHI Collaboration, Z. Phys. C 73 (1996) 11;
http://projects.hepforge.org/professor/