Probing the nature of the massive black hole binary candidate SDSS J1536+0441111Based on observations collected at the European Organisation for Astronomical Research in the Southern Hemisphere, Chile (DDT programme: 282.B-5059).
Abstract
We present an imaging study of the black hole binary candidate SDSS J1536+0441 (), based on deep, high resolution VK images collected at the ESO/VLT. The images clearly show an asymmetric elongation, indicating the presence of a companion source at ( kpc projected distance) East from the quasar. The host galaxy of the quasar is marginally resolved. We find that the companion source is a luminous galaxy, the light profile of which suggests the presence of an unresolved, faint nucleus (either an obscured AGN or a compact stellar bulge). The study of the environment around the quasar indicates the occurrence of a significant over-density of galaxies with a redshift compatible with . This suggests that it resides in a moderately rich cluster of galaxies.
Subject headings:
quasars: individual (SDSS J153636.22+044127.0)1. Introduction
Boroson & Lauer (2009) discovered peculiar features in the optical spectrum of SDSS J153636.22+044127.0 (catalog ) (hereon, SDSS J1536+0441), a radio quiet quasar. Three line systems are found at different redshifts: a set of broad and narrow emission lines at , a set of only broad emission lines at and a third set of very narrow absorption lines at an intermediate redshift (). Boroson & Lauer (2009) interpreted the former two systems in terms of the broad line region emission around two massive black holes within the same galaxy, constituting a massive black hole binary (BHB) with sub-parsec separation.
Chornock et al. (2009a, b) questioned the BHB scenario, ascribing the peculiar spectroscopic features of the quasar to a single active massive black hole with a particular disk-like geometry of the broad line region, similar to Arp 102B. This scenario is also supported by the detection of a bump in the red wings of broad emission line profiles, at .
Motivated by the claim by Boroson & Lauer (2009), Wrobel & Laor (2009) observed SDSS J1536+0441 using the VLA, discovering two radio sources (VLA–A and VLA–B) separated by within the quasar optical localization region. Independently, NIR observations led by our group (Decarli et al., 2009b) revealed the occurrence of a companion galaxy of the quasar, located in correspondence with VLA–B. This was subsequently confirmed in the optical wavelengths by Lauer & Boroson (2009) using HST.
Wrobel & Laor (2009) and Decarli et al. (2009b) suggested that each nucleus of the two galaxies is related to a single set of broad emission lines. The validity of this picture can be tested with high angular resolution spectroscopy, in order to prove if the two sets of broad emission lines are spatially separated. Lauer & Boroson (2009) and Chornock et al. (2009b) presented optical spectra of SDSS J1536+0441. Both groups suggest that the regions responsible for the emission of the two sets of broad lines are spatially coincident. Nevertheless, both observations were carried out under non-optimal seeing conditions (larger than the angular separation of the two objects along the slit), hindering a clear comprehension of the contribution of the active nucleus in VLA–B to the spectrum of SDSS J1536+0441.
The scenario of a superposition of two AGNs has already been invoked by Heckman et al. (2009) to explain the spectral properties of another BHB candidate (SDSS J0927+2943; see Komossa, Zhou & Lu, 2008; Dotti et al., 2009; Bogdanovic, Eracleous & Sigurdsson, 2009), but was subsequently questioned by Decarli, Reynolds & Dotti (2009a). Boroson & Lauer (2009) noted that the expected number of chance quasar pairs with projected separations in the whole SDSS DR7 sample is only 0.3%. On the other hand, if the two objects are physically linked (e.g., if they lie in a rich galaxy cluster), such a number rises significantly (see the discussion in Wrobel & Laor, 2009).
In order to study the properties of this peculiar object, and to probe the presence of a rich galaxy cluster in its environment, we performed deep, high-resolution imaging in the optical and near infrared wavelengths in an ESO Director Discretional Time programme (proposal ID: 282.B-5059).
Throughout the paper, we adopt a concordance cosmology with km/s/Mpc, , .
2. Observations, data reduction and analysis
K-band observations of the field around SDSS J1536+0441 were collected with the High Acuity Wide field K-band Imager (HAWK-I) at the ESO/Very Large Telescope (VLT) on April, 30, 2009. The total integration time amounts to 48 minutes. HAWK-I is equipped with 4 CCDs of 20482048 pixels and a pixel-scale of pxl. Each CCD image square arcmin (after trimming and the removal of partly observed regions). Usual jitter procedure was applied in order to collect broad band images in the NIR. Images were reduced with an IRAF777IRAF is distributed by the National Optical Astronomy Observatories, which are operated by the Association of Universities for Research in Astronomy, Inc., under cooperative agreement with the National Science Foundation-based pipeline developed and tested in other programmes (e.g., Kotilainen et al., 2009). The seeing was (FWHM) throughout the whole integration time. We estimate the Zero Point by comparing the instrumental magnitudes of field sources with the values reported in the 2MASS database. The accuracy in the photometric calibration is mag. Hereafter, we will focus on the Chip 2 image, the one overlapping onto the optical observations.
V- and -band images were collected with the Focal Reducer and low dispersion Spectrograph #2 (FORS2) at the ESO/VLT on May, 22 and 24, 2009. FORS2 mounts 2 CCDs of 20484096 pixels. Our observations were carried out with the High-Resolution collimator with binning, yielding a pixel-scale of pxl. Offsets within a wide box were applied in order to overcome the gap between the two FORS2 CCDs. The final frames are square arcmin wide. In the V-band, ten, 90 sec-long images were acquired, for a total integration time of 15 minutes. In the -band, several 120-sec long exposures were secured, yielding a total integration time of 52 minutes. The seeing was excellent (FWHM= in , in V). The Zero Point of the -band observation was estimated from the magnitudes of field sources in the SDSS photometric catalogue. Similarly, for the V-band, we referred to the V magnitude estimates as derived from the SDSS and bands, following the conversion recipes by Windhorst et al. (1991). The internal accuracy is around mag.
A composite image of our data in the three observed bands is available
on-line at www.dfm.uninsubria.it/astro/qso_host/q1536/.
The Astronomical Image Decomposition and Analysis (AIDA, Uslenghi & Falomo, 2008) software is used to model the Point Spread Function (PSF). The employed technique is widely discussed in Kotilainen et al. (2007, 2009), and it is briefly summarized here. The images of field stars are modeled with the superposition of 4 bidimensional gaussians mimicking the core plus an exponential feature for the wings of the PSF. No significant PSF variation through the frame is reported in the K-band frame. On the other hand, FORS2 images are affected by severe distortions of the PSF shape throughout the image, making the PSF model less secure.
3. Results
3.1. Decomposition of the quasar image
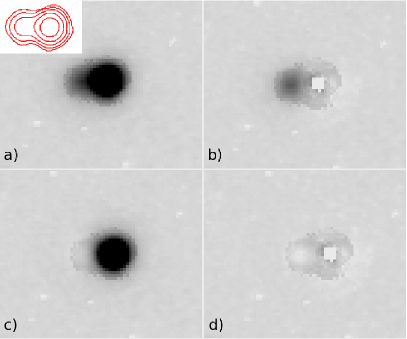
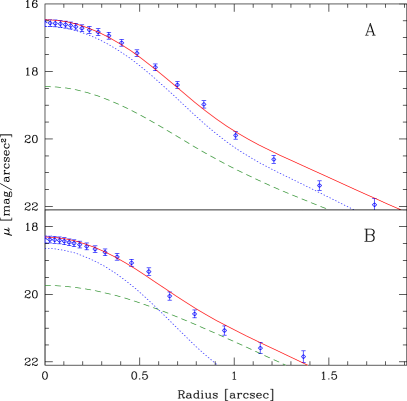
Figure 1 shows that the image of SDSS J1536+0441 is clearly elongated East-wards, revealing the presence of a blended source (hereafter, source B) close to the quasar and coincident with VLA–B. In a comparison between the PSF model and the observed light profile of the two sources, it is apparent that they are both resolved (see Figure 2). As quasar A is blended with its faint companion, in order to study the presence of extended emission in both of them we adopt an iterative procedure to model the two sources: 1) First, we mask the Eastern side of the bright quasar (where the contribution from the companion source may be relevant) and perform a 2D modelling with a nuclear+host galaxy profile convolved to our PSF model. 2) The model is subtracted from the observed frame, the residuals are masked out and we model the emission from the companion source. 3) The companion model is subtracted from the original observed frame, and we re-model the emission from the quasar. 4) Finally, we re-perform the second step with the new model of the main source.
| Band | RF-Band | |||||||
| (1) | (2) | (3) | (4) | (5) | (6) | (7) | (8) | (9) |
| Source A | ||||||||
| K | 14.1 | 1.6 | 3.7 | H | ||||
| 16.2 | 1.0 | 3.2 | R | |||||
| V | 17.5 | 1.0 | 4.4 | B | ||||
| Source B | ||||||||
| K | 15.8 | 2.6 | 1.9 | H | ||||
| 18.6 | 4.9 | 1.4 | R | |||||
| V | 21.0 | 3.6 | 1.3 | B | ||||
In order to evaluate the uncertainties in the magnitudes of nuclear and extended emissions, we scaled the Nuclear-to-Host luminosity ratio for a large set of models, and conservatively adopted as reference those bracketing the observed light profiles. Table 1 summarizes the results of the fit procedure. The host galaxy of quasar A is significantly detected only in the K-band. On the contrary, source B is well resolved. In all the bands, adding an unresolved nuclear component significantly improves the quality of the fit. As the unresolved-to-resolved luminosity ratio in the band ( rest-frame R band, see below) is around , we cannot assess whether it is a low-luminosity active nucleus (as suggested by the radio detection) or a stellar bulge.
The observed V, , K bands correspond to the rest-frame B, R and H. We compute the absolute magnitudes in these bands as , where refers to the rest-frame bands (B,R,H), the observed ones (V,,K), is the distance modulus, is the Galactic extinction and is a term accounting for filter and -correction. In our cosmological framework, yields . The Galactic extinction is derived from the HI maps by Schlegel, Finkbeiner & Davis (1998). The -correction comes from the galaxy templates by Mannucci et al. (2001) and the quasar template by Vanden Berk et al. (2001). The resulting magnitudes are reported in table 1. Source A has host galaxy absolute magnitudes consistent with the typical quasar host galaxy luminosities (e.g., Kotilainen et al., 2009) and it is mag brighter than the characteristic luminosity of quiescent galaxies at this redshift (Cirasuolo et al., 2008). The companion source is a galaxy mag fainter (cfr also the estimate reported by Lauer & Boroson, 2009) with a much fainter, red nucleus.
We note that, if the B-band flux of the unresolved source is interpreted in terms of an active galactic nucleus, source B should be classified as radio loud, according to the standard definition (e.g., Kellermann et al., 1989) based on the radio-to-optical flux ratio (here, , assuming the radio flux found by Wrobel & Laor, 2009).
3.2. The properties of the environment
In order to investigate the clustering properties of the environment of this quasar, we search for galaxies in its field. We consider the square arcmin ( Mpc at ) region that has been gathered in all the bands. We produce an inventory of sources exceeding a 5- detection threshold with respect to the background count rms through the software SExtractor (Bertin & Arnouts, 1996). The corresponding limit magnitudes are , and . We then match the compilations of sources detected in the various bands. The complete list consists of 200 sources detected in the V-band, 165 in (153 of which also appearing in the V-band catalogue) and 87 in K (80 of which also detected in V). A total of 69 sources are detected in all the bands.
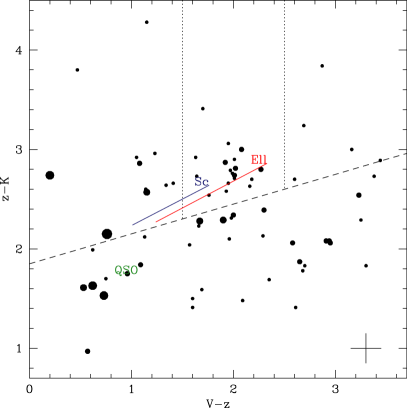
Among them, we select galaxy candidates using the color–color diagram proposed by Blanc et al. (2008) and adapted to our photometric system (see Figure 3). We assume that a galaxy has:
| (1) |
Out of 69 sources, 34 match this color criterion. We note that, given our sensitivity limits, we expect to detect stars in our frame in all the bands at this Galactic latitude888Based on the Galaxy simulations performed with the software TRILEGAL available at http://stev.oapd.inaf.it/cgi-bin/trilegal (Girardi et al., 2005).. Similarly, if we consider the number density of general field galaxies (e.g., from Cirasuolo et al., 2008; Blanc et al., 2008), 14 candidates brighter than our sensitivity limits are expected. This indicates that the field around the quasar is over-dense. From the galaxy templates by Mannucci et al. (2001), we infer that a galaxy has V- ranging between 1.5 and 2.5 (see also Csabai et al., 2003); thus, 18 out of 34 galaxy candidates are consistent with being at . The corresponding absolute magnitudes of these objects, assuming that they are galaxies at the same redshift as the quasar, are , and (with rms mag), consistent with typical fairly bright galaxies (cfr, e.g., Gavazzi et al., 2003). It is interesting to note that, out of 11 well-resolved sources in the K-band, 10 are classified as galaxies in our color selection, and 9 of them are consistent with having .
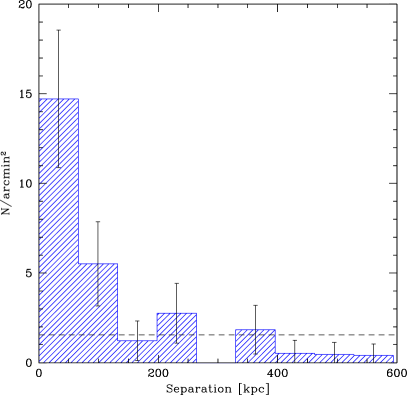
We compute the number density of these galaxies as a function of the angular distance from the quasar in order to evaluate the occurrence of any clustering (see Figure 4). We find a significant excess of the galaxy density within kpc from SDSS J1536+0441 with respect to average field. Thus the quasar is found in a moderately rich cluster of galaxies.
4. Discussion
In this Letter, we presented a high-resolution, deep multi-color imaging study of the alleged binary quasar SDSS J1536+0441. In addition to the extended emission of the host galaxy, we detect a bright companion galaxy at from the quasar. The quasar and the companion are located in correspondence with two distinct radio sources observed by Wrobel & Laor (2009), showing that both galaxies host an AGN.
Our deep images unveil the presence of a rich galaxy cluster. The existence of such a massive structure solves the apparent inconsistency between the observation of two radio sources within and the expected number of such pairs in the SDSS catalogue, as discussed in Boroson & Lauer (2009) and Wrobel & Laor (2009). Furthermore, the potential well of such a rich galaxy cluster could in principle explain the shift in redshift between the two sets of emission lines. This consideration favours a superposition picture to explain the spectrum of SDSS J1536+0441.
However, the red color and the faintness of the nuclear optical continuum observed in the companion galaxy suggest that its AGN emission is obscured. As a consequence, the AGN of the companion galaxy should not contribute much to the broad emission lines present in the SDSS spectrum, in agreement with the indications discussed in Chornock et al. (2009b) and Lauer & Boroson (2009). In this case, the two sets of broad emission lines should be emitted by the quasar, consistently with the BHB or the double peaked emitter scenarios. The external regions of the companion galaxy could also naturally explain the narrow absorption lines observed in the spectrum of SDSS J1536+0441, as already suggested by Lauer & Boroson (2009). The origin of the red bump in the broad line profiles reported by Chornock et al. (2009b) remains unclear both in the BHB and the superposition scenarios.
The effective role of the companion in the spectrum of SDSS J1536+0441 and of the surrounding galaxy cluster is yet to be clarified. The superposition model, where the companion emits one of the two sets of emission lines is in possible conflict with the presently available spectroscopic data. However, the discovery of a possible nucleus in source B, matched with its radio detection by Wrobel & Laor (2009), may support this picture. Crucial tests for this interpretation can be derived: from UV observations of high-ionization lines (as discussed in Chornock et al., 2009b), high angular resolution optical spectroscopy and high-resolution X–ray images.
Acknowledgments
This research has made use of the NASA/IPAC Extragalactic Database (NED) which is operated by the Jet Propulsion Laboratory, California Institute of Technology, under contract with the National Aeronautics and Space Administration.
Facilities: VLT(FORS2) VLT(HAWK-I)
References
- Bertin & Arnouts (1996) Bertin E., Arnouts S., 1996, A&A Suppl., 117, 393
- Bogdanovic, Eracleous & Sigurdsson (2009) Bogdanovic T., Eracleous M., Sigurdsson S., 2009, arXiv:0809.326 2
- Boroson & Lauer (2009) Boroson T.A., Lauer T.R., 2009, Nature, 458, 53
- Blanc et al. (2008) Blanc G.A., Lira P., Barrientos L.F., Aguirre P., Francke H., Taylor E.N., Quadri R., Marchesini D. et al., 2008, ApJ, 681, 1099
- Canalizo et al. (2007) Canalizo G., Bennert N., Jungwiert B., Stockton A., Schweizer F., Lacy M., Peng C., 2007, ApJ, 669, 801
- Chornock et al. (2009a) Chornock R., Bloom J.S., Cenko S.B., Silverman J.M., Filippenko A.V., Hicks M.D., Lawrence K.J., Chang P., et al., 2009, ATel, #1955, 1
- Chornock et al. (2009b) Chornock R., Bloom J.S., Cenko S.B., Filippenko A.V., Silverman J.M., Hicks M.D., Lawrence K.J., Mendez A.J., et al., 2009, submitted to ApJL (arXiv:0906.0849)
- Cirasuolo et al. (2008) Cirasuolo M., McLure R.J., Dunlop J.S., et al., 2008, MNRAS, submitted (arXiv:0804.3471)
- Csabai et al. (2003) Csabai I., Budavári T., Connolly A.J., Szalay A.S., Gyõry Z., Benítez N., Annis J., Brinkmann J. et al., 2003, AJ, 125, 580
- Decarli, Reynolds & Dotti (2009a) Decarli R., Reynolds M.T., Dotti M., 2009a, arXiv:0904.2999
- Decarli et al. (2009b) Decarli R., Treves A., Falomo R., Dotti M., Colpi M., Kotilainen J.K., 2006b, ATel, #2061, 1
- Dotti et al. (2009) Dotti M., Montuori C., Decarli R., Volonteri M., Colpi M., Haardt F., 2009, arXiv:0809.3446
- Gavazzi et al. (2003) Gavazzi G., Boselli A., Donati A., Franzetti P., Scodeggio M., 2003, A&A, 400, 451
- Girardi et al. (2005) Girardi L., Groenewegen M.A.T., Hatziminaoglou E., da Costa L., 2005, A&A, 436, 895
- Heckman et al. (2009) Heckman T.M., Krolik J.H., Moran S.M., Schnittman J., Gezari S., 2009, arXiv:0810.1244
- Kellermann et al. (1989) Kellermann K.I., Sramek R., Schmidt M., Shaffer D.B., Green R., 1989, AJ, 98, 1195
- Komossa, Zhou & Lu (2008) Komossa S., Zhou H., Lu H., 2008, ApJ Letters, 678, 81
- Kotilainen et al. (2007) Kotilainen J.K., Falomo R., Labita M., Treves A., & Uslenghi M., 2007, ApJ 660 1039
- Kotilainen et al. (2009) Kotilainen J.C., Falomo R., Decarli R., Treves A., Uslenghi M., Scarpa R., 2009, submitted to ApJ
- Lauer & Boroson (2009) Lauer T.R., Boroson T.A., 2009, submitted to ApJ Letters (arXiv:0906.0020)
- Mannucci et al. (2001) Mannucci, F., Basile, F., Poggianti, B.M., et al. 2001, MNRAS, 326, 745
- Schlegel, Finkbeiner & Davis (1998) Schlegel D.J., Finkbeiner D.P., Davis M., 1998, ApJ, 500, 525
- Uslenghi & Falomo (2008) Uslenghi M. & Falomo, R. 2008, Proc. Erice, in press.
- Vanden Berk et al. (2001) Vanden Berk D.E., Richards G.T., Bauer A., Strauss M.A., Schneider D.P., Heckman T.M., York D.G., Hall P.B., 2001, AJ, 122, 549
- Windhorst et al. (1991) Windhorst R.W., Burstein D., Mathis D.F., Neuschaefer L.W., Bertola F., Buson L.M., Koo D.C., Matthews K., et al., 1991, ApJ, 380, 362
- Wrobel & Laor (2009) Wrobel J.M., Laor A., 2009, submitted to ApJL (arXiv:0905.3566)