Enhanced vaccine control of epidemics in adaptive networks
Abstract
We study vaccine control for disease spread on an adaptive network modeling disease avoidance behavior. Control is implemented by adding Poisson distributed vaccination of susceptibles. We show that vaccine control is much more effective in adaptive networks than in static networks due to an interaction between the adaptive network rewiring and the vaccine application. Disease extinction rates using vaccination are computed, and orders of magnitude less vaccine application is needed to drive the disease to extinction in an adaptive network than in a static one.
Modeling the spread of epidemics on static networks is a well developed field, but recent studies have begun to account for potentially time-varying network topologies. In particular, people may adjust their social behavior in response to the threat of an epidemic. Both an SIS (susceptible-infected-susceptible) model Gross et al. (2006) and SIRS (susceptible-infected-recovered-susceptible) model Shaw and Schwartz (2008) have been studied on an adaptive network in which non-infected nodes rewire their links adaptively away from infected neighbors and toward other non-infected nodes. Such adaptation typically increases the epidemic threshold and reduces the number of infectious cases, and new disease dynamics and bifurcations are observed. Similar results are seen when the nodes reconnect to randomly selected nodes elsewhere in the network Zanette and Risau-Gusmán (2008); Risau-Gusmán and Zanette (2009). Because vaccines are available for many diseases, it is desirable to examine the interplay between adaptively fluctuating social contacts and vaccination of susceptible individuals.
Almost all diseases exhibit randomness resulting in observed fluctuations, as in Bolker and Grenfell (1993); Bolker (1993); Patz (2002); Rand and Wilson (1991); Billings et al. (2002); Andersson and Britton (2000). As diseases evolve in large populations, there is the possibility of finite time extinction Andersson and Britton (2000); van Herwaarden and Grasman (1995); Allen and Burgin (2000); Jacquez and Simon (1993); Elgart and Kamenev (2004); Doering et al. (2005). Extinction occurs where the number of infectives become so small that there is insufficient transmission to keep the disease in its endemic state Keeling (2004); Verdasca et al. (2005); Bartlett (1949). Fluctuations cause the disease free equilibrium (DFE) to be reached in a finite time. Such an extinction process occurs even when the DFE is unstable. Populations based upon adaptive networks further complicate the problem, since social dynamical situations, such as disease avoidance strategies, can cause the endemic and DFE to be bistable Shaw and Schwartz (2008).
A major characteristic of fluctuation-induced extinction in stochastic models for globally connected large populations is the extinction rate. Viewing disease fade-out as coming from systems far from thermal equilibrium, finite population extinction rate laws have been derived in SIS Doering et al. (2005); Schwartz et al. (2009) and SIR Kamenev and Meerson (2008) models. In contrast to vaccine strategies which stabilize the DFE Anderson and May (1991); d’Onofrio (2002); Gao et al. (2007); Shulgin et al. (1998); Stone et al. (2000); Wang et al. (2009), periodic pulsed vaccination was generalized to a random Poisson strategy, which exponentially enhances the rate of extinction Dykman et al. (2008).
Other vaccine strategies have been examined in a variety of static network geometries. Targeting of high degree nodes is widely recognized as more effective than random vaccination, including in scale free networks Pastor-Satorras and Vespignani (2002); Dezső and Barabási (2002), small world networks Zanette and Kuperman (2002), and more realistic social network geometries Miller and Hyman (2007). Because targeting the highest degree nodes requires full knowledge of the network geometry, other strategies based on local knowledge have been developed. For example, vaccinating a random acquaintance of a randomly selected node tends to favor high degree nodes and is again more effective than random vaccination Cohen et al. (2003). When vaccine is very limited, outbreaks can be minimized by fragmenting the network via a graph partitioning strategy which requires less vaccine than targeting high degree nodes Chen et al. (2008). Here we will use a random vaccination strategy and find that in conjunction with adaptive rewiring, it is extremely effective.
We create a new model by modifying an SIS model Gross et al. (2006), adding a vaccine class (V). Individuals are connected in a network, with non-infected nodes rewiring adaptively to reduce connections with infected nodes.
The transition probabilities are as follows. A susceptible node becomes infected with rate , where is its number of infected neighbors. An infected node recovers (to susceptible) with rate . Vaccination occurs in Poisson-distributed pulses with frequency , and each pulse vaccinates a fraction of the susceptible nodes Santos et al. (2008). We assume that the vaccine is not permanent, so a vaccinated node becomes susceptible again with rate , the resusceptibility rate.
While the epidemic spreads, the network is rewired adaptively. Because the vaccine wears off, we assume that vaccinated nodes are uncertain of their infection status and thus rewire in the same way as susceptibles. If a link connects a non-infected node to an infected node, that link is rewired with rate to connect the non-infected node to another randomly selected non-infected node. Self links and multiple links between nodes are excluded.
We simulate the full adaptive network via Monte Carlo simulation in a similar fashion to Shaw and Schwartz (2008). Vaccination events occur with average rate , and in each event susceptibles are selected randomly for vaccination, where is the total number of susceptibles. Results are presented here for nodes and links.
We have developed a mean field theory for the dynamics of nodes and links following Gross et al. (2006); Shaw and Schwartz (2008) . denotes the probability of a node to be in state , where is either S, I, or V. denotes the probability that a randomly selected link connects a node in state to a node in state . is the Poisson distributed vaccination with mean frequency and amplitude . We obtain the following set of stochastic differential equations for the nodes:
and for the links:
The mean field equations are analyzed as a stochastic system with random as above, as well as for a deterministic system using the mean vaccine rate .
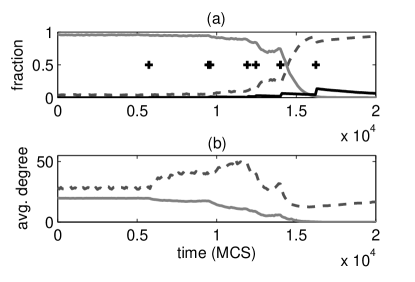
Sample time series are shown in Figure 1 for a run in which the epidemic became extinct. Because we use proportional vaccination, as vaccination begins to lower the number of infectives and the number of susceptibles increases, subsequent vaccine pulses vaccinate a larger number of nodes.
We studied the longtime behavior for the case of longer lived endemic states. The deterministic mean field model predicts stable steady state dynamics for the static network, even when vaccine is applied. Small regions of oscillatory behavior have been predicted for the adaptive network without vaccination Gross et al. (2006), and these regions are predicted to be much larger when vaccination is applied. For the resusceptibility used here, oscillations are generic not (a).
Figures 2-2 compare the dependence of the mean infective level on the vaccine frequency for static and adaptive networks not (b). For the full static (Erdős-Rényi) network system (Fig. 2), at each vaccine frequency the steady state mean infectives were computed over ten network geometries. For the stochastic mean field (Fig.2), 100 runs were done to extinction () and the means of the time series were computed. The mean field and full model are in excellent agreement.
For the full system with rewiring (Fig. 2), infectives were averaged over MCS for a single adaptive network for the smaller vaccine frequencies (), and error bars are the standard deviation. For larger values the oscillations led to rapid die out, so the infectives were instead averaged over 100 runs computed to extinction, where the vaccine was turned on at time 0. Error bars are the standard deviation of all the time points. This averaging includes transients but serves to illustrate the decreasing infective levels and large fluctuations due to oscillations as is increased. The stochastic mean field (Fig. 2) was computed as in Fig. 2, and error bars are the standard deviations of the means. The vaccination frequency required to significantly lower the infected fraction in the adaptive network is much smaller than for the static network due to the interaction of vaccination and rewiring. The mean field model accurately predicts the order of magnitude of vaccine required and the presence of oscillations.
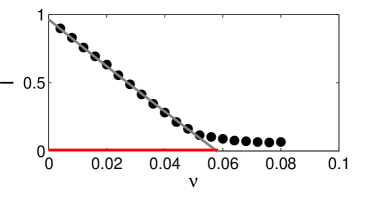
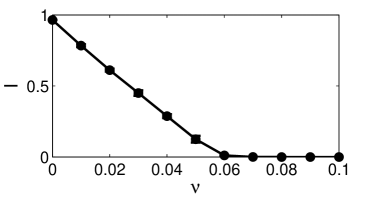
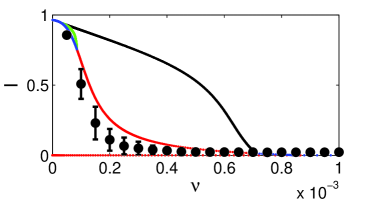
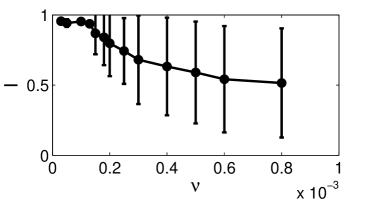
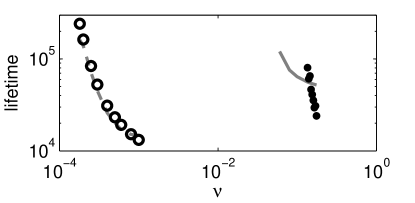
Figure 3 shows the dependence of the endemic state lifetime on the vaccine frequency for static (Erdős-Rényi) and adaptive networks. About two orders of magnitude less vaccine is needed in the adaptive case to significantly reduce the lifetime of the endemic state. For the full system, each point was obtained by averaging 100 runs for which the initial condition was the vaccine-free steady state and the vaccine was turned on at time zero. Mean field results were obtained similarly, but the time to extinction was computed using a threshold for of .
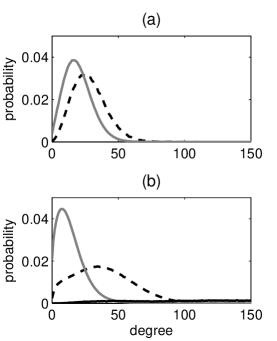
To explain the efficacy of vaccination in the adaptive network, we examine the network structure in more detail, particularly the degree. Steady state degree distributions for an adaptive network with and without vaccination are shown in Figure 4. Results without vaccination were obtained similarly to those in Shaw and Schwartz (2008). Results with vaccination were computed likewise but averaging over 9 runs to obtain better statistics for the vaccinated nodes which are present at very low levels (0.6% of the nodes). As shown in Fig. 4(a), susceptibles in the adaptive network have a higher average degree than infectives due to rewiring. This is also apparent at the beginning of the degree time series for susceptibles and infectives in Fig. 1(b). Because the susceptibles typically have higher degree, random vaccination of susceptible nodes favors the higher degree nodes in the network and is therefore expected to be effective, as in previous studies of targeted vaccination Pastor-Satorras and Vespignani (2002); Zanette and Kuperman (2002); Dezső and Barabási (2002). For a static network, in contrast, the high degree nodes are most likely to be infected and thus will rarely be selected for vaccination.
The vaccination level used in Fig. 4(b) is small enough that it only slightly lowers the number of infected nodes. However, when vaccination occurs the rewiring becomes more effective because of the presence of “safe” nodes to wire to. The average infective degree is substantially decreased, and the susceptible degree is substantially increased. The vaccinated nodes have a broad degree distribution with a very high average degree. For the parameter values in Figure 4(b), vaccinated nodes participate in links as frequently as susceptibles, even though there are two orders of magnitude fewer vaccinated than susceptibles.
In this model, we randomly vaccinated a fixed fraction of the susceptible nodes during each vaccination event. Information about the network structure was not required. This corresponds to the case where vaccine is inexpensive and anyone who is not infected can be vaccinated. If the vaccine were in limited supply, it would be desirable to use some knowledge about the social network structure (such as the degrees) to target the vaccine more carefully. In that case, the vaccine pulses might be a fixed number of susceptibles rather than a fixed fraction. However, further study is needed to determine the optimal vaccination strategy. Another extension would be to relax the assumption that nodes have full knowledge of others’ disease status Zanette and Risau-Gusmán (2008); Risau-Gusmán and Zanette (2009).
In summary, we studied the effect of Poisson vaccination on epidemic spread in an adaptive network. Vaccination was far more effective (by two orders of magnitude for the parameters chosen) in an adaptive network than a static one due to the interaction of vaccination and rewiring. The network adaptation led to a higher average degree for susceptible nodes, and random vaccination of susceptibles exploited this heterogeneity. The adaptive rewiring then became more effective because of the presence of “safe” vaccinated nodes to rewire to.
LBS was supported by the Jeffress Memorial Trust, Army Research Office, and Air Force Office of Scientific Research. IBS was supported by the Office of Naval Research and the Air Force of Scientific Research.
References
- Gross et al. (2006) T. Gross, C. J. D. D’Lima, and B. Blasius, Phys. Rev. Lett. 96, 208701 (2006).
- Shaw and Schwartz (2008) L. B. Shaw and I. Schwartz, Phys. Rev. E 77, 066101 (2008).
- Zanette and Risau-Gusmán (2008) D. H. Zanette and S. Risau-Gusmán, J. Biol. Phys. 34, 135 (2008).
- Risau-Gusmán and Zanette (2009) S. Risau-Gusmán and D. H. Zanette, J. Theor. Biol. 257, 52 (2009).
- Bolker and Grenfell (1993) B. M. Bolker and B. T. Grenfell, Proc. Roy. Soc. Lond. B 251, 75 (1993).
- Bolker (1993) B. M. Bolker, IMA J. Math. Appl. Med. 10, 83 (1993).
- Patz (2002) J. Patz, Proc. Natl. Acad. Sci. 99, 12506 (2002).
- Rand and Wilson (1991) D. Rand and H. Wilson, Proc. Roy. Soc. Lond. B 246, 179 (1991).
- Billings et al. (2002) L. Billings, E. Bollt, and I. Schwartz, Phys. Rev. Lett. 88, 234101 (2002).
- Andersson and Britton (2000) H. Andersson and T. Britton, J. Math. Biol. 41, 559 (2000).
- van Herwaarden and Grasman (1995) O. A. van Herwaarden and J. Grasman, J. Math. Biology 33, 581 (1995).
- Allen and Burgin (2000) L. Allen and A. M. Burgin, Math. Biosci. 163, 1 (2000).
- Jacquez and Simon (1993) J. A. Jacquez and C. P. Simon, Math. Biosci. 117, 77 (1993).
- Elgart and Kamenev (2004) V. Elgart and A. Kamenev, Phys. Rev. E 70, 041106 (2004).
- Doering et al. (2005) C. R. Doering, K. V. Sargsyan, and L. M. Sander, Multiscale Modeling & Simulation 3, 283 (2005).
- Keeling (2004) M. J. Keeling, Ecology, Genetics, and Evolution. (Elsevier, New York, 2004).
- Verdasca et al. (2005) J. Verdasca et al., J. Theor. Bio. 233, 553 (2005).
- Bartlett (1949) M. S. Bartlett, J. Roy. Stat. Soc. B 11, 211 (1949).
- Schwartz et al. (2009) I. B. Schwartz, L. Billings, M. Dykman, and A. Landsman, J. Stat. Mech. P01005 (2009).
- Kamenev and Meerson (2008) A. Kamenev and B. Meerson, Phys. Rev. E 77, 061107 (2008).
- Anderson and May (1991) R. M. Anderson and R. M. May, Infectious Diseases of Humans: Dynamics and Control (Oxford Science Publications, 1991).
- d’Onofrio (2002) A. d’Onofrio, Math. Biosci. 179, 57 (2002).
- Gao et al. (2007) S. Gao, L. Chen, and Z. Teng, Bull. Math. Biol. 69, 731 (2007).
- Shulgin et al. (1998) B. Shulgin, L. Stone, and Z. Agur, Bull. Math. Biol. 60, 1123 (1998).
- Stone et al. (2000) L. Stone, B. Shulgin, and Z. Agur, Math. and Computer Modelling 31, 207 (2000).
- Wang et al. (2009) X. Wang, Y. Tao, and X. Song, Appl. Math. and Computation 210, 398 (2009).
- Dykman et al. (2008) M. I. Dykman, I. B. Schwartz, and A. S. Landsman, Phys. Rev. Lett. 101, 078101 (2008).
- Pastor-Satorras and Vespignani (2002) R. Pastor-Satorras and A. Vespignani, Phys. Rev. E 65, 036104 (2002).
- Dezső and Barabási (2002) Z. Dezső and A.-L. Barabási, Phys. Rev. E 65, 055103(R) (2002).
- Zanette and Kuperman (2002) D. H. Zanette and M. Kuperman, Physica A 309, 445 (2002).
- Miller and Hyman (2007) J. Miller and J. M. Hyman, Physica A 386, 780 (2007).
- Cohen et al. (2003) R. Cohen, S. Havlin, and D. Ben-Avraham, Phys. Rev. Lett. 91, 247901 (2003).
- Chen et al. (2008) Y. Chen, G. Paul, S. Havlin, F. Liljeros, and H. E. Stanley, Phys. Rev. Lett. 101, 058701 (2008).
- Santos et al. (2008) L. Santos, R. Paes-Sousa, J. B. da Silva Junior, and C. G. Victorad, Bull World Health Organ. 86, 474 (2008).
- not (a) Steady state behavior occurs for other values, but we focus here on the oscillatory regions because the dynamics is more interesting. The qualitative advantage to including both vaccination and rewiring is the same whether or not oscillations occur.
- not (b) The bifurcation structure and infective levels depend primarily on the average vaccination rate rather than on the frequency or amplitude individually.