Dynamics and Depletion in Thermally Supercritical Starless Cores
Abstract
In previous studies we identified two classes of starless cores, thermally subcritical and supercritical, distinguished by different dynamical behavior and internal structure. Here we study the evolution of the dynamically-unstable, thermally-supercritical cores by means of a numerical hydrodynamic simulation that includes radiative equilibrium and simple molecular chemistry. From an initial state as an unstable Bonnor-Ebert (BE) sphere, a contracting core evolves toward the configuration of a singular isothermal sphere (SIS) by inside-out collapse. We follow the gas temperature and abundance of CO during the contraction. The temperature is predominantly determined by radiative equilibrium, but in the rapidly contracting center of the core, compressive heating raises the gas temperature by a few degrees over its value in static equilibrium. The time scale for the equilibration of CO depends on the gas density and is everywhere shorter than the dynamical timescale. The result is that the dynamics do not much affect the abundance of CO which is always close to that of a static sphere of the same density profile, and CO cannot be used as a chemical clock in starless cores. We use our non-LTE radiative transfer code MOLLIE to predict observable CO and N2H+ line spectra, including the non-LTE hyperfine ratios of N2H+, during the contraction. These are compared against observations of the starless core L1544. The comparison indicates that the dust in L1544 has an opacity consistent with ice-covered rather than bare grains, the cosmic ray ionization rate is about s-1, and the density structure of L1544 is approximately that of a Bonnor-Ebert sphere with a maximum central density of cm-3, equivalent to an average density of cm-3 within a radius of 500 AU. The observed CO line widths and intensities are reproduced if the CO desorption rate is about 30 times higher than the rate expected from cosmic-ray strikes alone, indicating that other desorption processes are also active.
1 Introduction
The starless cores are well described as small, dense, self-gravitating clouds supported largely but not entirely by thermal pressure. They are significant in the interstellar medium as the future birthplaces of stars (reviews: Di Francesco et al., 2007; Bergin & Tafalla, 2007). In previous papers (Keto & Field, 2005; Keto & Caselli, 2008) we developed a simple model to describe the temperature, density, chemistry, and dynamical evolution of the starless cores. Those studies suggest that the starless cores can be conceptually divided into two classes, thermally subcritical and thermally supercritical depending on whether their central densities are very roughly less or greater than a few cm-3 respectively. This density is significant as the approximate value of two critical densities in the physics of starless cores. First, at this density gas cooling by collisional coupling with dust is about as efficient as cooling by molecular line radiation. The gas temperature in the center of the supercritical cores is therefore significantly lower than in their envelopes and lower than found anywhere in the subcritical cores. Second, at this density, cores of a few M⊙ are at critical dynamical stability with respect to gravitational collapse. The thermally subcritical cores are stable against gravitational collapse and their dynamics may be dominated by oscillations (Lada et al., 2003; Aguti et al., 2007). In contrast, the supercritical cores are unstable with predominantly inward velocities (Williams et al., 1999; Caselli et al., 2002; Keto et al., 2004; Sohn et al., 2007; Schnee et al., 2007)
In previous papers (Keto et al., 2006; Broderick et al., 2007, 2008) we modeled the internal oscillations (sound waves) in thermally subcritical cores and computed some observable molecular spectral line profiles during the oscillations. In this paper, we model the dynamical and chemical evolution of a thermally supercritical core and compute observable molecular spectral line emission during the early stages of gravitational contraction leading up to free-fall collapse.
Our model is a one-dimensional numerical hydrodynamics code (Keto & Field, 2005) that includes the radiative equilibrium of dust, gas cooling by both molecular lines and collisional coupling with the dust, and a simplified molecular chemistry (Keto & Caselli, 2008). To compare the model with observations we use our numerical code for non-LTE radiative transfer MOLLIE to predict the observable molecular spectral line emission (Keto, 1990; Keto et al., 2004). Previously we modeled overlapping hyperfine emission by assuming that the hyperfine components are in statistical equilibrium. Here we use an updated algorithm that does not make this assumption and better reproduces the non-LTE hyperfine line ratios (excitation anomalies) that are seen in N2H+ spectra from many of the starless cores (Caselli et al., 1995; Daniel et al., 2007). We compare these predictions to previous observations of one specific core, L1544 whose properties place it in the thermally supercritical class.
There has been some considerable research into the topic of how gas clouds contract to form protostars including some classic papers in the field (Henyey et al., 1955; Hayashi, 1961; Larson, 1969; Shu, 1977). More recent studies also address the chemical evolution of the starless cores using a variety of models for the dynamics of gravitationally contracting cores.
Aikawa et al. (2001, 2003) followed the chemical evolution of a gravitationally collapsing core assuming the Larson-Penston (LP) approximation for the densities and velocities. In a subsequent paper, Aikawa et al. (2005) improved on this model using a numerical hydrodynamic code (Ogino et al., 1999) to follow the collapse of an isothermal Bonnor-Ebert (BE) sphere. Evans et al. (2001) and Galli et al. (2002) showed that in the case of static BE spheres there was little difference between the structure of an isothermal BE sphere and one in radiative equilibrium. Our numerical hydrodynamic simulation that allows for radiative equilibrium during collapse also confirms that the isothermal approximation used in Aikawa et al. (2005) is quite adequate for dynamic as well as static BE spheres (our §2.2). However, if we go on to predict molecular line strengths from the model cores, we need to consider temperature variations. Our §4 discusses the spectral line modeling.
Rawlings & Yates (2001) used the similarity solution of the collapse of a singular isothermal sphere (SIS) (Shu, 1977) in their study of chemical evolution. Tsamis et al. (2008) combined this model for the dynamics with a model for the internal temperature structure of a BE sphere from Evans et al. (2001). Lee et al. (2004) approximated the contraction of a BE sphere as a progression of static spheres of increasing central density. Our hydrodynamic simulation suggests that this series of static equilibria is a good approximation during the subsonic phase of contraction, and that the SIS model is a good approximation at the endpoint of this phase (our §2).
Van Weeren et al. (2009) and Brinch et al. (2008) modeled the chemical evolution during the formation of a 2D rotating accretion disk and protostar. Our spherical model applies to earlier evolutionary times while the contracting core still maintains its BE structure.
Li et al. (2002) and Shematovich et al. (2003) followed the chemical evolution during the contraction of cores that are supported by a spherical approximation of magnetic pressure. The contraction is controlled by leakage of the magnetic field out of the core by ambipolar diffusion. In the spherical approximation, this is modeled by a diffusion equation in Lagrangian coordinates (equation 3 of Li et al., 2002). One difficulty with assessing the applicability of spherical models of magnetic collapse is that the approximation of spherical symmetry results in a density structure that, similar to the SIS and BE spheres, can be approximated by a polytrope with an index that depends on the effective equation of state. Observationally, it is difficult to distinguish polytropes of different index because their density structures are most different from one another at small and large radii where the observations have difficulties with angular resolution and sensitivity (low density gas) respectively.
In contrast, there is strong observational motivation for the model of thermal support. Masses, densities, and temperatures estimated in surveys of starless cores suggest that thermal energy provides about 75% of the internal energy required for equilibrium (Dickman & Clemens, 1983; Myers & Benson, 1983; Lada et al., 2008). The remaining 25% could be in magnetic energy or wave energy or a combination of both. While the 25% non-thermal energy is important for the dynamical stability and evolution of the core, the structure of the core is determined largely by the dominant thermal energy.
Our study is different from previous studies in that we consider the evolution of a BE sphere rather than an accretion disk plus protostar, or an SIS sphere, or a magnetically supported sphere. Our simulations is the first that follows the dynamics of the contraction simultaneously and self-consistently with radiative equilibrium and a simple model for the chemistry that allows for changes in the molecular line cooling as the molecular abundances in the gas phase change with time.
We first discuss the dynamics of the gravitational contraction of a BE sphere. Our code is best suited for subsonic velocities and we confine our discussion to the early phase of evolution. We then discuss how the gas phase abundance of CO evolves during contraction. We predict how the molecular line strengths should vary across the model from center to edge at different times during the contraction, and we compare this prediction with ratios of line strengths previously observed in L1544. We intend the comparison in a general sense only and not in detail. For example, the model is spherically symmetric while both the observed morphology (Ward-Thompson, Motte, & Andrè, 1999; Bacmann et al., 2000) and observed spectra (Williams et al., 1999; Caselli et al., 2002; Williams et al., 2006) indicate that both the density and velocity structure of L1544 are more complex than can be reproduced by a purely spherical model.
2 The gravitational contraction of an unstable Bonnor-Ebert sphere
We model a core of 10 M⊙ that begins its evolution with an initial density of cm-3 in a state of radiative and dynamical equilibrium. The mass and density place the core in the thermally supercritical class (figure 14 of Keto & Caselli, 2008) so that the dynamical equilibrium is unstable. Based on the results of Keto & Caselli (2008) we use our higher dust opacities that are equal to four times the standard dust opacities of Ossenkopf & Henning (1994), and we use a rate of cosmic ray ionization of s-1 referred to as the ”low” rate in Keto & Caselli (2008). In that investigation, this combination was found to result in gas temperatures that match those suggested by the observations of Crapsi et al. (2007) at their suggested central density of cm-3.
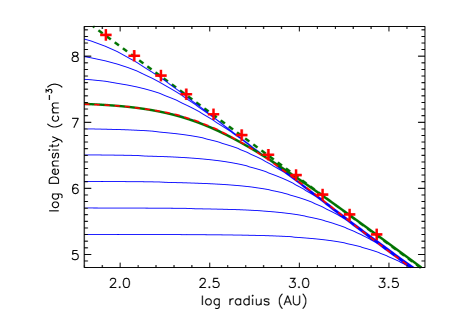
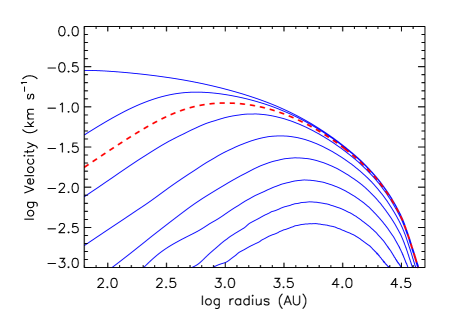
Figures 1 and 2 show the density and velocity profiles during contraction as the central density increases from its initial value to cm-3 over a time period of 1 Myr. The shapes of the density and velocity profiles that are generated by the numerical simulation can be understood in terms of relatively simple theory. We begin with the density profile.
2.1 The density profile
The density profiles in figure 1 show an outer region where the density scales as and an inner region where the density is nearly constant. As the evolving core contracts, the density profile maintains this shape even as the central density increases (Larson, 1969; Hunter, 1977; Foster & Chevalier, 1993; Ogino et al., 1999; Kandori et al., 2005). Thus we should expect to observe this characteristic shape in almost all starless cores, and this is generally confirmed by observations. Ward-Thompson et al. (1994), Andrè et al. (1996), Ward-Thompson, Motte, & Andrè (1999), and Bacmann et al. (2000) suggested that the density profiles derived from observations of dust emission could be well matched by two power laws, one shallow and one steep. This approximation is also suggested by the numerical studies of the contraction of a BE sphere cited above. Tafalla et al. (2002, §4.2) suggested that the density profile can be better fit by,
| (1) |
where is the radius of the inner region. This equation along with , which we define below, provides a convenient approximation for future use.
2.1.1 The flat inner region
In the center of a BE sphere, where the sound-crossing time is less than the free-fall time, density perturbations are rapidly smoothed by pressure waves. Also the self-gravity in the center is relatively weak so that the gas is essentially confined by the pressure of the overlying gas. Both these effects act to maintain constant density around the center.
Previously, the size of the region with a flat density profile, , was determined empirically for individual cores from their observations. We can also determine this radius theoretically. At the ratio of the sound-crossing and free-fall times ought to be one. Therefore, is the product of the sound speed, , and the free-fall time at the central density, ,
| (2) |
This provides a better approximation in equation 1 than the standard scale length of a BE sphere, (Bonnor, 1956) and is also useful in suggesting the physics behind the behavior of a contracting BE sphere. The radius, is equal to the Jeans length for sound speed, , and density, .
Figure 1 compares the density profile computed by equations 1 and 2, assuming a gas temperature of 10 K and a central density of cm-3 (green curve), against the density profile computed by the numerical hydrodynamic simulation. The comparison suggests that equations 1 and 2 provide a good, simple approximation to the density profile of a BE sphere. (A more accurate approximation is described in Natarajan & Lynden-Bell (1997).) Because the numerical hydrodynamic simulation also accounts for a variable temperature set by radiative equilibrium, the comparison in figure 1 also shows that the departures from isothermal owing to radiative equilibrium have little effect on the overall density structure of the core.
Figure 1 also shows the characteristic radius, , for the different evolutionary times during the contraction. The figure shows that equation 2 provides a good approximation to the turn-over radius, , at all times in the evolution. According to equation 2, this width shrinks as the central density of a contracting BE sphere increases. In the subsonic phase of gravitational contraction, moves at about half the maximum gas velocity where this maximum is taken from the velocity profiles for each evolutionary time as shown in figure 2.
In comparing our theoretical results to several observations, we find that a central density of about cm-3 provides a better match to the observations (§4) than central densities that are a factor of 10 higher or lower. This estimate is in agreement with the density of cm-3 suggested by the observations of Crapsi et al. (2007) if we average the theoretical density profile over the size of their observing beam. Although the theoretical density profile appears flat in the center of a log-log plot of density versus radius, it is sharply peaked within the size of the observing beam. The average density within a radius of 500 AU (observing beam size of 1000 AU = 7” at 140 pc) is corresponding to a peak density of cm-3. In fact, at a spatial resolution of 1000 AU, observations have difficulty measuring the central density. For example, the average density over 1000 AU corresponding to a peak density of cm-3 is only cm-3 , little different from the average density of cm-3 corresponding to a peak density of cm-3.
In our previous paper (Keto & Caselli, 2008), we used the lower central density of cm-3 and stated that a higher central density would imply a higher density throughout the core. This is not correct. Owing to the inside-out character of the collapse, the central density increases much more rapidly than the densities outside of . As explained in the next section, in an evolving core, the densities over most of the core are actually about the same for both these higher and lower central densities (figure 1).
2.1.2 The self-similar outer region
In their numerical hydrodynamic simulations of gravitationally collapsing gas clouds, Bodenheimer & Sweigart (1968) found that regardless of the initial configuration of the cloud or the initial conditions, all their examples evolved to density profiles scaling as in their outer regions. Shu (1977) suggests that this scaling is a property shared by all self-gravitating isothermal systems under certain general conditions. The system should evolve subsonically, meaning that it should be close to hydrostatic equilibrium initially, and the outer region should not be affected by an outer bounding surface. These conditions are applicable to contracting BE spheres. The initial state is one of hydrostatic balance, albeit unstable. Although BE spheres have an outer boundary which is the radius at which the Lane-Emden equation is truncated, the external pressure at the boundary is the same as would be provided by the Lane-Emden equation if the solution were continued. Thus in the initial configuration, the density profile is the same as if the core had no outer boundary.
Figure 2 shows that the BE sphere evolves by subsonic contraction to resemble the SIS, a result also found in earlier studies (Larson, 1969; Foster & Chevalier, 1993). As the central density increases with the contraction, the characteristic radius, , moves inward, the constant density region shrinks in size, and the outer region with its density profile scaling as accounts for more and more of the core. Because the density of the outer region changes very slowly, the density contrast between the inner and outer regions also increases rapidly. Thus, as the contraction proceeds, the BE sphere evolves to resemble an SIS with its density profile everywhere and its infinite density contrast.
This behavior is expected if we recall that the static equilibrium solutions of the Lane-Emden equation form a continuous series with increasing density concentration and the SIS as the limiting case (Chandrasekhar, 1957; Shu, 1977). During the subsonic, quasi-static phase of contraction, an unstable BE sphere evolves approximately along this series of static equilibria toward the limiting case of an SIS.
2.2 The velocity profile and the inside-out collapse of a BE sphere
The velocity profile during the subsonic phase of the contraction of a BE sphere (figure 2) shows a characteristic -shape with the inward velocity as a function of radius increasing from near zero in the core center to a maximum just outside the characteristic radius, , before decreasing again toward the edge of the core (Foster & Chevalier, 1993; Ogino et al., 1999; Kandori et al., 2005). The origin of this profile can be understood by considering the forces inside and outside of . In the very center, the velocity is zero by symmetry. In the region, , where the density is constant, the instantaneous acceleration due to the gravitational force increases linearly with radius. The velocity, which is the time-integrated acceleration, may also be expected to increase with radius as well, and this is verified by the numerical evolution. Outside of , the density falls off as . Here the instantaneous gravitational acceleration decreases with radius along with its influence on the velocity. During the contraction, the redistribution of mass in the center does not change the gravitational acceleration in the outer region because of spherical symmetry. Thus, in the outer region, the only change to the hydrostatic balance is due to the pressure force which propagates outward from the center only at the sound speed. These several effects that would change the hydrostatic balance in the outer region all decrease as we move outward, away from . Thus the outer region remains in approximate hydrostatic balance with low inward velocities for about a sound-crossing time, on the order of 1 Myr, and the velocities are lower at larger radii, further from .
The same characteristic -shaped profile also develops if we consider the pressure-free collapse of a BE sphere. In this case the gas pressure is ignored and the velocity field is determined solely by the variation of the gravitational force with radius. (Whitworth & Ward-Thompson, 2001; Myers, 2005). Of course, the gas pressure is required to obtain the initial BE density distribution in the first place.
3 The temperature and chemistry of the evolving core
In the previous section we saw that the dynamics of a contracting BE sphere, as followed by a numerical simulation that included radiative and chemical equilibrium, were well matched by a simpler isothermal approximation. In this section we will see that the temperature and chemistry of an evolving core have a significant effect on the observable molecular line spectra. The gas temperature directly affects the line brightness through the source function. The chemistry affects the line brightness through the gas phase abundance of the observable molecules. The most significant processes affecting the abundances are the depletion of molecules from the gas phase as they freeze onto dust grains in the dense center of a core and photodissociation of molecules near the core boundary. We calculate the CO abundance with a simple model that includes these two processes (Keto & Caselli, 2008).
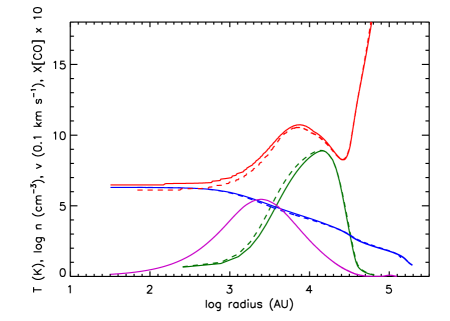
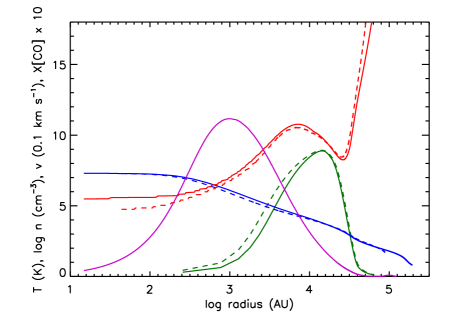
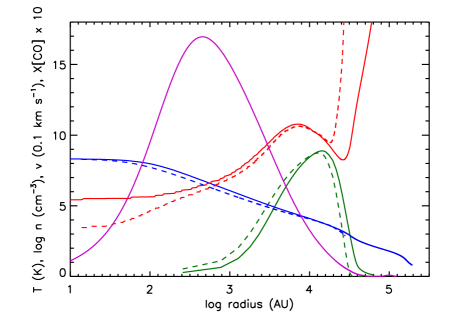
Figure 3 shows the gas temperatures, density, velocity, and CO abundance at 3 different times during the collapse when the central density is , , and cm-3. As discussed further in §4 , a model with a central density of cm-3 provides a better match to the observations than central densities that are a factor of 10 lower or higher. Also shown are the density, temperature, and abundance of static cores that have the same central densities as the dynamically evolving core. The properties of the contracting cores are similar to those of the static cores with the same central density, with the exception of the velocity.
3.1 The temperature in the center of a contracting core
The starless cores are heated from the outside by both cosmic rays and by the diffuse interstellar radiation field supplied by the population of stars in the Galaxy. The cores are cooled by the long wavelength radiation from cold dust and by molecular lines. Because the incoming shorter wavelength starlight is strongly absorbed by the cores whereas the outgoing long wavelength radiation from cold dust is not, the denser cores are coldest in their centers. This temperature structure has previously been calculated in quite a number of papers (references in Keto & Field, 2005). In figure 3 we see that the central temperature of the static core with a central density of cm-3 is quite low, below 5 K. In the evolving core, compressive heating keeps the temperature above 5 K, more consistent with the temperatures inferred from molecular line and dust observations (Crapsi et al., 2007; Pagani et al., 2007).
3.2 CO depletion and desorption
In our previous paper we assumed that the rate for the desorption of CO off dust, the inverse process to depletion or freeze-out, was due to whole-grain heating by cosmic rays (equation 11 Keto & Caselli, 2008; Hasegawa & Herbst, 1993). When we compare the C18O and C17O spectra predicted by our radiative transfer code MOLLIE with observations of L1544 we find that the predicted lines are not bright enough to match the observations. Since these CO lines are optically thin, the CO column density is too low.
The desorption rate cannot be increased by simply increasing the flux of cosmic rays. In our earlier study we found that a higher flux of cosmic rays would cause the gas temperature at mid-radii to be higher than suggested by observations (figure 12 Keto & Caselli, 2008).
There are other processes in addition to direct cosmic-ray strikes that cause desorption and increase the gas phase abundance of CO (Prasad & Tarafdar, 1983; Léger et al., 1985; d’Hendecourt et al., 1985; Duley & Williams, 1993; Willacy & Millar, 1998; Takahashi & Williams, 2000; Dalgarno, 2006; Öberg et al., 2009). Shen et al. (2004) found that the energy transferred to dust by the UV radiation field produced by cosmic-ray strikes on molecular hydrogen is almost one order of magnitude larger than the energy transferred directly to dust by the cosmic-ray particles themselves. Roberts et al. (2007) suggested that in addition to direct and indirect heating by cosmic rays, another significant source of heat is the exothermic formation of H2 on the grain surfaces. Roberts et al. (2007) suggest that the rates of these heating processes are not known. However, because all the processes depend on the first power of the density, the same as direct cosmic ray heating, we can account for additional desorption processes in our model by simply increasing the desorption rate above that given by equation 11 of Keto & Caselli (2008) while still assuming the same first-power dependence on the gas density.
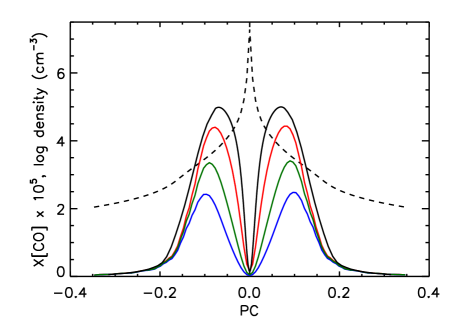
Figure 4 shows the abundance of CO obtained as an equilibrium between the 4 processes of depletion, desorption, photodissociation and chemical formation, and calculated for 4 different desorption rates. The lowest rate is equivalent to desorption caused by direct cosmic-ray strikes (Hasegawa & Herbst, 1993) on dust at the ”low” cosmic-ray rate ( s-1) as defined in equation 11 of Keto & Caselli (2008). The higher desorption rates are factors of 3, 9, and 30 higher than the lowest rate. In order to match the observed CO spectra (figure 9) we find that we need to increase our desorption rate by a factor of 30. At this rate, desorption and depletion have equal time scales at a density of about cm-3.
As shown in figure 4, with the highest desorption rate, the maximum CO abundance is about a factor of 2.5 higher than with the lowest rate. This increase in abundance makes the optically thin C17O and C18O lines almost a factor of 2 brighter and a better match to the observations.
The gas phase abundance could also be increased by decreasing the reverse reaction of freeze-out. One way this could occur is if the dust grains in the center of L1544 were fewer in number but larger in size, for example by coagulation. This would decrease the total surface area available for freeze-out (van Dishoeck et al., 1993). There is some independent evidence for coagulated grains (Caselli et al., 2002; Keto et al., 2004; Bergin et al., 2006; Flower et al., 2006; Van Weeren et al., 2009). However, to reduce the rate of freeze-out by a factor of 30, would require a mean grain diameter of about 10 m, too large according to available models of dust coagulation in dense clouds (Ossenkopf & Henning, 1994). Decreased depletion at a rate slower than equation 8 of Keto & Caselli (2008) could contribute to the higher CO abundance, but could not bring the CO abundance up high enough to match the spectral line observations. Finally, decreased photodissociation might also increase the CO abundance. This could come about if the UV flux were diminished, for example, if the core were embedded in a larger scale molecular cloud. We ran a separate radiative transfer calculation and found that the CO abundance cannot be increased deep enough into the core to make a difference to the line brightness.
3.3 Depletion time scale
The time scale for CO to freeze onto dust, (equation 8 Keto & Caselli, 2008; Rawlings et al., 1992) and the time scale for the inverse process of desorption, ( equation 11 Keto & Caselli, 2008; Hasegawa & Herbst, 1993) may be combined to determine the time scale for the change of CO in the gas phase (Caselli et al., 2002),
| (3) |
This time scale for the equilibration of the CO abundance varies across the core but is everywhere aster than the dynamical time. In the core center, the free-fall time is a close approximation whereas in the more slowly evolving outer region, the sound crossing time is more appropriate. A starless core with a mass of 10 M⊙ and a central density of cm-3 has a free-fall time, Myr using the central density in the standard equation whereas the sound crossing time is about 2 Myr. In comparison, at the center of the core, the CO equilibration time scale Myr, a factor of 3 shorter than the free-fall time. At the edge of the core where the density is 20 cm-3, Myr, still a factor of 4 shorter than the sound crossing time. throughout the contraction. Figure 3 shows that the abundance of CO during the contraction of a BE sphere is everywhere quite close to its steady state value. For this reason, it is not possible to use CO as a chemical clock in starless cores.
3.4 CO abundance and time reversibility
The previous discussion demonstrates the importance of desorption in determining the CO abundance. The desorption rate is required to determine the equilibrium abundance toward which the system evolves asymptotically. In particular, the CO abundance should not be calculated simply from the depletion rate as an exponentially decreasing function of time as would be the case if desorption were ignored. Even in gas dense enough that the depletion rate is much faster, general considerations always require both the forward and reverse reactions. Real physical systems must satisfy detailed balance and time reversibility (Onsager, 1931). A system described by a single rate equation, for example depletion only without desorption, does not satisfy these conditions, cannot describe a physical system, and this description will produce misleading results.
4 Comparison with observations
All other things being equal, a collisionally excited, optically thin line should increase in brightness with the path length and the gas density. Thus molecular lines should be brightest through the center of the core. Observations of starless cores do not always show this behavior because of varying molecular abundances within the core (Tafalla et al., 2002). For example, figure 2 of Caselli et al. (1999) reproduced here as figure 5 shows the brightness of the (1-0) transitions of C17O, C18O, and N at a set of positions across the L1544 core from edge to center to edge. The N molecule does not suffer much, if any, depletion from the gas phase at high densities, and the observed N brightness increases toward the core center whereas the observed CO brightness does not. This difference is due to the near complete depletion of CO at higher density. It is possible that N2H+ may be slightly depleted in the center of L1544 (Caselli et al., 2002) although we do not include this effect in our model. We will investigate this possibility in a future modeling of higher density tracers and transitions. Our modeling here shows that the decrease in temperature in the core center is not sufficient to significantly decrease the line brightness.
Figure 6 shows the simulated integrated spectral line brightness as a trace of positions across the model evolving cores in the same format as the observational data in figure 5. The integrated intensities include the emission from all three hyperfine lines of C17O(1–0) and all seven hyperfine lines of N2H+(1–0). At central densities greater than cm-3 the modeled brightness begins to look like the observations. There are some differences.
The observational data might show a slight dip in the integrated intensity of the CO lines toward the center which is not present in the model. However, there is a decrease in the peak intensity of the modeled CO lines (figure 7). This dip does not show up in the integrated intensity because the line widths in the model increase toward the center owing to the increase in the inward velocities in the inside-out collapse (figures 8). The increase in the line width of CO is less than that of N because, owing to depletion, there is essentially no gas phase CO in the center of the core where the velocities are highest. From a density of to cm-3 the C17O and C18O line widths increase by 0.07 and 0.06 kms-1 while the N2H+ line width increases by 0.15 kms-1.
Because the density, temperature, and abundance structures of contracting cores are so similar to those of static cores, the primary observable evidence of contraction is not the line brightness, but rather the shapes of those spectral lines such as N(1-0) that are optically thick enough to show self-absorption. Figure 9 shows the spectral line profiles of the (1-0) transitions of C17O, C18O, and N expected from our model for the 3 evolutionary times corresponding to figure 3. As the inward velocities increase during the contraction, the N2H+ spectral lines become wider (figure 8), and eventually split into two peaks (figure 9) because of the inward velocities in the core (figure 3). In contrast, because there is little CO in the center where the velocities are highest, the width of the CO lines changes very little (figure 8) as the core evolves, and the CO lines do not split (figure 9). The brightness of both the N2H+ and CO lines are nearly constant as the central density increases from to cm-3 because there is very little change in the density of most of the core except for the center where CO is depleted. The slight decrease in the peak brightness of C18O (figure 7 and 9) is consistent with a constant integrated intensity and the slight increase in line width (figure 8). As the core evolves from a central density of to cm-3 there is very little change in any of the observed spectra, either CO or N2H+, because the density increase is happening in a very small region in the center that does not contain much mass relative to the entire core and is also becoming small compared to the observing beam. Thus the N2H+ spectra (figure 9) for the last two evolutionary times look almost the same. Interferometric observations of higher density transitions of N2H+ and N2D+ will be needed to unveil the dynamical stage, structure and kinematics of the rapidly contracting center of the core. This will be investigated in a future paper.
5 Conclusions
We follow the contraction of a thermally supercritical core through the evolutionary phase of subsonic contraction with a numerical code that includes radiative and chemical equilibrium.
We identify a characteristic radius, the product of the sound speed and the free-fall time, as the point where the density profile of a BE sphere transitions from an outer region where the density scales as to an inner region of constant or flat density. In the inner region, the dynamical time is the gravitational free-fall time at the central density. In the outer region, the dynamical time is the much slower sound-crossing time. The difference results in inside-out collapse.
Once this characteristic radius becomes smaller than the angular resolution, observations have difficulty in determining the exact central density even if the observed molecule is not significantly depleted.
We follow the gas temperature and abundance of CO during contraction. In the rapidly contracting center of the core, compressive heating raises the gas temperature by a few degrees over its value in static equilibrium and the results are consistent with observations. The temperature variations from the radiative equilibrium do not significantly affect the dynamics of the large scale structure of the thermally supercritical core. The time scale for the equilibration of CO is everywhere shorter than the dynamical timescale. Thus, the CO abundance is always close to that of a static sphere of the same density profile. Therefore, the CO abundance cannot be used a chemical clock to estimate the age of a starless core.
The comparison with line profiles observed toward L1544 suggests that the dust has an opacity consistent with ice covered grains, the cosmic ray ionization rate is close to 110-17 s-1, and the maximum density is about 2107 cm-3, equivalent to an average density of 3106 cm-3 within a radius of 500 AU corresponding to an observing beam size of 1000 AU. The line width and intensity of C18O and C17O lines can be simultaneously reproduced by our model only if the CO desorption rate is about 30 times larger than the rate expected from cosmic-ray impulsive heating alone.
References
- Aikawa et al. (2001) Aikawa, Y., Ohashi, N., Inutsuka, S.-I., Herbst, E., Takakuwa, S., 2001, ApJ, 552, 639
- Aikawa et al. (2003) Aikawa, Y., Ohashi, N., & Herbst, 2003, ApJ, 593, 906
- Aikawa et al. (2005) Aikawa, Y., Herbst, E., Roberts, H. & Caselli, P., 2005, ApJ, 620, 330
- Aguti et al. (2007) Aguti, E.D., Lada, C.J., Bergin, E.A., Alves, J.F., Birkinshaw, M., 2007, ApJ , 665, 457
- Andrè et al. (1996) Andrè, P., Ward-Thompson, D., Motte, F., 1996, AA, 314, 625
- Bacmann et al. (2000) Bacmann, A., Andrè, A.P., Puget, J.-L., Abergel, A., Bontemps, S., & Ward-Thompson, D. 2000, A&A, 361, 555
- Bergin et al. (2006) Bergin, E. A., Maret, S., van der Tak, F. F. S., Alves, J., Carmody, S. M., & Lada, C. J. 2006, ApJ, 645, 369
- Bergin & Tafalla (2007) Bergin, E.A. & Tafalla, M., 2007, ARAA, 45, 339
- Bodenheimer & Sweigart (1968) Bodenheimer, P. & Sweigart, A., 1968, ApJ, 152, 515
- Bonnor (1956) Bonnor, W., 1956, MNRAS, 116, 351
- Brinch et al. (2008) Brinch, C., Van Weeren, R.J., & Hogerheijde, M.R., 2009, AA, 489, 617
- Broderick et al. (2007) Broderick, A. E., Keto, E., Lada, C. J., & Narayan, R., 2007, ApJ, 671,1832
- Broderick et al. (2008) Broderick, A. E., Narayan, R, Keto, E., & Lada, C. J., 2008, arXiv.0804.1790
- Caselli et al. (1995) Caselli, P., Myers, P., Thaddeus, P., 1995, ApJL, 455, L77
- Caselli et al. (1999) Caselli, P., Walmsley, C., Tafalla, M., Dore, L., & Myers, P. 1999, Ap Jl, 523, 165
- Caselli et al. (2002) Caselli, P., Walmsley, C., Zucconi, A., Tafalla, M., Dore, L., & Myers, P. 2002, Ap J, 565, 344
- Chandrasekhar (1957) Chandrasekhar, S., 1957, Stellar Structure (New York: Dover Publications)
- Dickman & Clemens (1983) Dickman, R.L., & Clemens, P., R.L., 1983, ApJ, 271, 143
- Crapsi et al. (2007) Crapsi, A., Caselli, P., Walmsley, M. C., & Tafalla, M. 2007, AA, 470, 221
- Dalgarno (2006) Dalgarno, A., 2006, PNAS, 103, 12269
- Daniel et al. (2007) Daniel, F., Cernicharo, J., Roeff, E., Gerin, M., Dubernet, M.L., 2007, ApJ, 667, 980
- d’Hendecourt et al. (1985) D’Hendecourt, L. B., Allamandola, L. J., & Greenberg, J. M. 1985, AA, 152, 130
- Di Francesco et al. (2007) Di Francesco, J., Evans, N.J., Caselli, P., Myers, P.C., Shirley, Y., Aikawa, Y., Tafalla, M., 2007, in Protostars and Plabets V, eds. B. Reipurth & D. Jewitt, Univ. of Arizona Press, Tucson, page 17
- Duley & Williams (1993) Duley, W. W., & Williams, D. A. 1993, MNRAS, 260, 37
- Evans et al. (2001) Evans, N., Rawlings J., Shirley, Y., & Mundy, L. 2001, Ap J, 557, 193
- Foster & Chevalier (1993) Foster, P. & Chevalier, R., 1993, ApJ, 416, 303
- Flower et al. (2006) Flower, D. R., Pineau Des Forêts, G., & Walmsley, C. M. 2006, AA, 456, 215
- Frerking et al. (1982) Frerking, M. A., Langer, W. D., & Wilson, R. W. 1982, ApJ, 262, 590
- Galli et al. (2002) Galli, D., Walmsley, M., & Gonçalves, J. 2002, AA, 394, 275
- Hasegawa & Herbst (1993) Hasegawa, T., & Herbst, E., 1993, MNRAS, 261, 83
- Hennebelle (2003) Hennebelle, P., 2003, AA , 411, 9
- Hayashi (1961) Hayashi, C., 1961, PASJ, 13, 450
- Henyey et al. (1955) Henyey, L.G., Lelevier, R., & Levee, R.D., PASP, 67,154
- Hunter (1977) Hunter, C., 1977, ApJ, 218, 834
- Kandori et al. (2005) Kandori, R., Nakajima, Y., Tatematsu, K., Aikawa, Y., Naoi, T., Sugitani, K., Nakaya, H., Nagayama, T., Nagata, T., Kurita, M., Nagashima, C., Sato, S., 2005, AJ, 130, 2166
- Keto (1990) Keto, E., 1990, ApJ, 355, 190
- Keto et al. (2004) Keto, E., Rybicki, G., Bergin, E., Plume, R., 2004, Ap J, 613, 355
- Keto & Caselli (2008) Keto, E. & Caselli, P., 2008, arXiv0804.0822
- Keto & Field (2005) Keto, E. & Field, G., 2005, ApJ, 635, 1151
- Keto et al. (2006) Keto, E., Broderick, A., Lada, C.J., & Narayan, R., 2006, ApJ, 652,1366
- Lada et al. (2003) Lada, C. J., Bergin, E. A., Alves, J. F., & Huard, T. L. 2003, ApJ, 586, 286
- Lada et al. (2008) Lada, C.J., Muench, A.A., Rathborne, J., Alves, J.F., & Lombardi, M., 2008, ApJ, 672, 410
- Larson (1969) Larson, R.,B., 1969, MNRAS, 145, 271
- Lee et al. (2004) Lee, J.-E., Bergin, E.A., Evans, N.J., 2004, ApJ, 617, 360
- Léger et al. (1985) Léger, A., Jura, M., & Omont, A. 1985, AA, 144, 147
- Li et al. (2002) Li, Z.-Y., Shematovich, V.I., Wiebe, D.S., & Shustov, B.M., 2002, ApJ, 569, 792
- Myers (2005) Myers, P.C., 2005, ApJ, 623, 280
- Myers & Benson (1983) Myers, P.C. & Benson, P.J., 1983, ApJ, 266, 309
- Natarajan & Lynden-Bell (1997) Natarajan, P. & Lynden-Bell, D., 1997, MNRAS, 286,268
- Öberg et al. (2005) Öberg, K. I., van Broekhuizen, F., Fraser, H. J., Bisschop, S. E., van Dishoeck, E. F., & Schlemmer, S. 2005, ApJL, 621, L33
- Öberg et al. (2009) Öberg, K. I., van Dishoeck, E. F., & Linnartz, H. 2009, AA, 496, 281
- Ogino et al. (1999) Ogino, S., Tomisaka, K. & Nakamura, F., 1999, PASJ, 51, 637
- Onsager (1931) Onsager, L., 1931, Phys Rev, 37, 405
- Ossenkopf & Henning (1994) Ossenkopf, V., & Henning, T. 1994, AA, 291, 943
- Pagani et al. (2007) Pagani, L., Bacmann, A., Cabrit, S., Vastel, C., 2007, AA, 467, 179
- Penston (1969) Penston, M.V., 1969, MNRAS, 144, 425
- Prasad & Tarafdar (1983) Prasad, S. S., & Tarafdar, S. P. 1983, ApJ, 267, 603
- Rawlings et al. (1992) Rawlings, J.M.C., Hartquist, T.W., Menten, C.M., Williams, D.A., 1992, MNRAS, 255, 471
- Rawlings & Yates (2001) Rawlings, J.M.C. & Yates, J.A., 2001, MNRAS, 326, 1423
- Redman et al. (2006) Redman, M.P., Keto, E., Rawlings, J.M.C., 2006, MNRAS, 370, 1
- Roberts et al. (2007) Roberts, J. F., Rawlings, J. M. C., Viti, S., & Williams, D. A. 2007, MNRAS, 976
- Schnee et al. (2007) Schnee, S., Caselli, P., Goodman, A., Arce, H. G., Ballesteros-Paredes, J., & Kuchibhotla, K. 2007, ApJ, 671, 1839
- Shematovich et al. (2003) Shematovich, V.I., Wiebe, Shustov, B.M., & Li, Z.-Y., 2003, ApJ, 588, 894
- Shen et al. (2004) Shen, C. J., Greenberg, J. M., Schutte, W. A., & van Dishoeck, E. F. 2004, AA, 415, 203
- Shu (1977) Shu, F.H., 1977, ApJ, 214, 488
- Schutte & Greenberg (1991) Schutte, W. A., & Greenberg, J. M. 1991, AA, 244, 190
- Sohn et al. (2007) Sohn, J. Lee, C.W., Park, Y-S., Lee, H.M., Myers, P.C., Lee, Y., 2007, ApJ , 664 928
- Spitzer (1978) Spitzer, L., 1978, Physical Processes in the Interstellar Medium, New York Wiley-Interscience
- Tafalla et al. (2002) Tafalla, M., Myers, P., Caselli, P., Walmsley, C., & Comito, C. 2002, Ap J, 569, 815
- Takahashi & Williams (2000) Takahashi, J., & Williams, D. A. 2000, MNRAS, 314, 273
- Tsamis et al. (2008) Tsamis, Y.G., Rawlings, J.M.C., Yates, J.A., & Viti, S., 2008, arXiv:0803.0519
- van Dishoeck et al. (1993) van Dishoek, E. F., Blake, G. A., Draine, B. T., & Lunine, J. I. 1993, Protostars and Planets III, 163
- Van Weeren et al. (2009) Van Weeren, R.J., Brinch, C., & Hogerheijde, M.R., 2009, AA, 497, 773
- Ward-Thompson et al. (1994) Ward-Thompson, D., Scott, P., Hills, R., & Andrè, P. 1994, MNRAS, 268, 274
- Ward-Thompson, Motte, & Andrè (1999) Ward-Thompson, D., Motte, F., & Andrè, P. 1999, MNRAS, 305, 143
- Whitworth & Ward-Thompson (2001) Whitworth, A.P. & Ward-Thompson, D., 2001, ApJ, 547, 317
- Willacy & Millar (1998) Willacy, K., & Millar, T. J. 1998, MNRAS, 298, 562
- Williams et al. (1999) Williams, J.P., Myers, P.C., Wilner, D.J., DiFrancesco, J., 1999, ApJ , 513, L61
- Williams et al. (2006) Williams, J.P., Lee, C.W., Myers, P.C., 2006, ApJ , 636, 952


![[Uncaptioned image]](/html/0908.2400/assets/x17.png)
![[Uncaptioned image]](/html/0908.2400/assets/x18.png)
![[Uncaptioned image]](/html/0908.2400/assets/x19.png)
![[Uncaptioned image]](/html/0908.2400/assets/x20.png)