Ideal glass transition in a simple 2D lattice model
Abstract
We present a simple lattice model showing a glassy behavior. matrix analysis predicts critical termination of the super-cooled fluid branch at density . This prediction is confirmed by dynamical numerical simulations, showing power-law divergences of relaxation time , as well as the 4-susceptibility peak’s location and height exactly at the predicted density. The power-law divergence of continues up to as high as . Finite-size scaling study reveals divergence of correlation length accompanying the transition.
Understanding the transition of supercooled liquids into a glass is considered by many to be one of the outstanding challenges of condensed matter physics. Many liquids, when cooled fast enough to avoid crystallization, appear to freeze into solid-like structures devoid of crystalline order stillinger-n ; benedetti ; cavagna . The time scales for structural relaxation in such metastable super-cooled regimes increase dramatically as temperature is lowered. For strong glass formers the relaxation times grow exponentially . Fragile glass formers exhibit relaxation times that increase more rapidly than Arrhenius and are often fitted by Vogel-Tammann-Fulcher (VTF) functional form , with a characteristic temperature angell .
The glass transition temperature is experimentally defined as the temperature at which dynamic relaxation times exceed those accessible in typical experiments, e.g. when viscosity hits Poise. During the past century, much interest has been focused on understanding the nature of this transition. Clearly, the glass transition temperature, defined by some viscosity cutoff value, is just an arbitrary reference point along the gradual increase of relaxation times with decreasing temperature. The question whether there is some deeper, profound, physical meaning to the glass transition is still hotly debated stillinger-n . Is the fast increase of relaxation times merely a sharp cross-over in the dynamics, or could it be manifestation of a true thermodynamic transition? [Obviously, when considering a glass transition in a system exhibiting a solid phase, such as real glass formers, the notion of a thermodynamic glass transition must be interpreted in the sense of a restricted part of phase space. For simplicity, we ignore this distinction in the following.] Many theoretical studies have been applied to support either one of the competing views. For example, a popular microscopic approach is the mode-coupling theory (see gotze ; reichman for reviews). It predicts a dynamic glass transition, characterized by ergodicity breaking, while thermodynamic (equilibrium) quantities such as the isothermal compressibility do not become singular. In contrast, the replica approachparisi predicts a structural glass transition with pure thermodynamic origin, characterized by a vanishing configurational entropy. Other phenomenological theories, such as the random first order transition (RFOT)kirk ; wolynes and the potential energy landscape (PEL)sciortino to name only two, also predict a thermodynamic phase transition.
Recently, the matrix baramr ; us approach for analysis of the Mayer cluster integrals expansion has been applied to the hard-spheres fluidebpre ; eli . It provides the density as a function of the activity (, where is the chemical potential and is the inverse temperature) and predicts a critical termination of the super-cooled fluid, with a power-law divergence of the isothermal compressibility. The packing-fraction at which this divergence is predicted to happen is 0.556(5), surprisingly close to the experimentally reported glass transition packing-fraction 0.56(1). This result, therefore, strongly supports the existence of a thermodynamic glass transition for hard spheres underlying the (experimentally and numerically observed) dynamical arrest. It is desirable to have numerical measurements of the super-cooled hard-spheres equation of state near the transition in order to test the validity of the matrix approach. However, these simulations are extremely challenging. Accordingly, contradicting results have been reported regarding the existence of singularities in thermodynamic quantities for this system speedy ; rintoul .
The limits of numerical methods often hamper the study of glass transition. Excluding the non-physical kinetically constrained models, most models studied are either complex (binary mixtures) or hard to simulate (hard spheres). They are therefore limited in system size and simulation times. For example, a recent study of Lennard-Jones binary mixture stein reports that enlarging the system to include particles improves the quality of the extrapolation of -dependent quantities to zero wave vector. Moreover, simulations are generally limited to time scales roughly ten orders of magnitude shorter than those near the laboratory glass transition temperature and therefore to the initial stages of the glass formation process berry . These numerical limitations might be lifted by introducing a simpler model system that still captures the essence of glassy behavior. Keeping that in mind we set to explore the glass transition is the lattice model.
The model is a simple 2D model on a square lattice. Particles interact only through hard-core exclusion up to the 3rd nearest neighbor. The model is known to undergo a first order solidification transitionbellemans ; orban ; eliasher , where density jumps from to eliasher (the closest packing density is ). Like the hard spheres case, matrix analysis predicts a critical termination of the super-cooled fluid where the isothermal compressibility power-law diverges. The critical density is found to be . In concordance with hard spheres results eli , we hypothesize that this point is indeed the thermodynamic glass transition for this system. We then study the dynamics of the model by extensive MC simulations and find that the dynamical quantities diverge exactly at the density predicted. We therefore conclude that the dynamical arrest in the model results from a singularity of the free energy, as predicted by the matrix. These results support the view of a thermodynamic (a.k.a ideal) glass transition in this system. Furthermore, we propose the system as a simple and convenient model-system for future studies of glassiness.
| 1 | 1 | 13 | 6 |
|---|---|---|---|
| 2 | -13 | 10.777777778 | 5.4955088285 |
| 3 | 205 | 10.777970817 | 5.4246225024 |
| 4 | -3521 | 10.762751563 | 5.4025047989 |
| 5 | 63466 | 10.755266974 | 5.3922495398 |
| 6 | -1180075 | 10.751491280 | 5.3866896951 |
| 7 | 22423304 | 10.749147764 | 5.3834227892 |
| 8 | -432957233 | 10.747459452 | 5.3814030748 |
| 9 | 8463267016 | 10.746108741 | 5.3801242739 |
| 10 | -167059758328 | 10.744940022 | 5.3793147595 |
| 11 | 3323928207997 | 10.743879570 | 5.3788131550 |
| 12 | -66571342665659 | ||
| 13 | 1340690959181588 | ||
| 14 | -27128411793067290 | ||
| 15 | 551181809202093940 | ||
| 16 | -11238651060745319617 | ||
| 17 | 229877749269899350973 | ||
| 18 | -4715081436294109369498 | ||
| 19 | 96953111901056596856377 | ||
| 20 | -1998044077291458477558756 | ||
| 21 | 41259643403438186795821307 | ||
| 22 | -853576114433438941428139775 | ||
| 23 | 17688270167244330924258385729 |
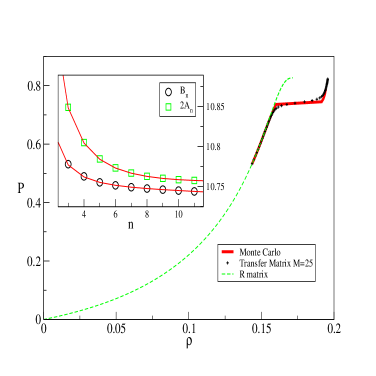
In order to construct the matrix for the model, we extended the number of known Mayer cluster integrals to , using the transfer matrix (TM) method. We have employed a diagonal-to-diagonal, symmetry reduced, TM, with strip width as large as ( symmetry-reduced classes). The cluster integrals provide the exact leading submatrix presented in table 1 (for details on matrix construction, see us ). The matrix elements quickly converge to a well-defined asymptotic form which we use to extrapolate additional matrix elements and obtain the equation of state (figure 1). Remarkably, the results, based only on low-density expansion, are in an excellent agreement with both MC data and exact TM calculations. The physical singularity is found at , well above the first order transition (), with a critical density . Furthermore, the matrix provides an exact formula for the critical exponent associated with the termination point of the fluid eli ; us : near this singularity, the density is given by
| (1) |
and the critical exponent is found to be .
We hypothesize that this thermodynamic criticality underlies an ideal glass transition for the N3 model, and set out to study the model dynamically looking for signatures of this glass transition. We conducted canonical (constant density) MC studies of the model in the following way: The starting configuration was generated under extreme cooling conditions (or, equivalently, infinite chemical potential). Particles were allowed to diffuse when no insertion was available. This process is known to terminate at the random closest packing (RCP) state with density 85% of closest packing density eli-rcp . Here, we stop the cooling at the desired density (below RCP), and let the system relax diffusionally. Given enough time, the global equilibrium phase-separation state is reached. On shorter time scale the system relaxes to a disordered phase. We first measure the density-density correlation
| (2) |
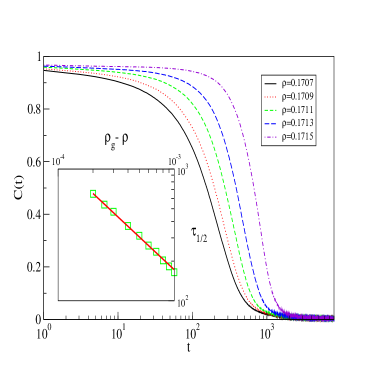
along the relaxation process ( if a particle exists at site at time and otherwise). Figure 2 shows the typical glassy dynamics picture: a plateau ( regime) followed by a stretched-exponential decay ( regime). Due to the discrete nature of the diffusion process in this model, the relaxation stage is very short (of order one simulation time unit) and is not presented. The relaxation time , defined as the time at which , power-law diverges as the density approaches :
| (3) |
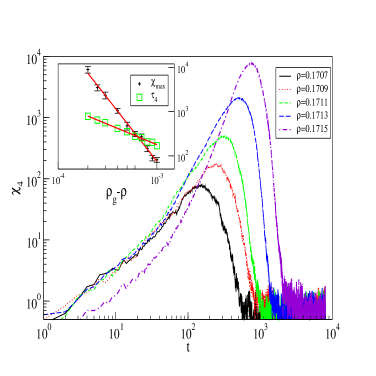
with , (figure 2, inset). In addition, we measure the 4-susceptibility dasgupta ; toninelli
| (4) |
Again, a typical glassy behavior is observed (figure 3) – peaks at the phase, and the peak grows in height and shifts to higher times as density increases. Peak heights () and locations () also power-law diverge as is approached (figure 3, inset). A transition to activated dynamics occuring close to the glass transition could be manifested by the onset of a slower, logarithmic, growth of the peak dalle . We do not observe any such transition for values up to .
The above MC data confirm the matrix prediction to an excellent agreement. Given that this prediction is based solely on low-density series expansion, it is remarkable that it captured quantitatively the behavior at the deep super-cooled regime. This attests for the validity of the matrix approach and its prediction of a thermodynamic criticality in the equation of state of the N3 super cooled fluid, and provides a strong evidence that the glass transition in this model is indeed a thermodynamic, ideal, one.
The growing peak is indicative of growing cooperative correlations in the relaxation process franz . It measures the volume upon which diffusional moves are correlateddoliwa . In concordance, growing correlations lengths are seen also by the emergence of finite size effects in the density-density correlations as shown in figure 4. These finite-size effects, recently highlighted by Karmakar et al. karmakar underscore the importance of using large systems for MC studies of glassiness, which is most difficult for popular models currently used.
Unlike the hard spheres case, the termination density predicted by the matrix and the dynamical arrest occur in close proximity to the random closest packing density eli-rcp . Therefore, the region beyond the transition is inaccessible in this model. It is important to note that the co-occurrence of the two phenomena is not a universal trait of the -matrix analysis. For example, in the hard-spheres model the matrix prediction for the ideal glass density is , much lower than . Hopefully, future work will find a model that is as simple as the N3 but also allows access to densities beyond . This could be achieved by studying the soft-core N3 model, or other hard-core lattice models.
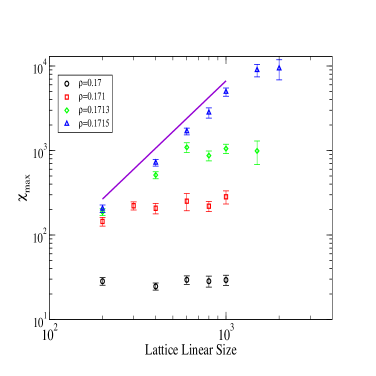
We stress that the simplicity of the N3 model is important not only in order to allow for analytical treatment, but to facilitate numerical studies of large systems, much larger than those typically used in glass studies. This is especially important when one approaches the glass transition, where long-range cooperative relaxation processes emerge, manifested by significant finite-size dependence. For example, at density , even a lattice ( particles; linear size particle diameters, much larger than typical 3D studies) is not large enough to converge to bulk values as seen in figure 4. The need for a simple model then is not a matter of comfort but a real necessity. We therefore propose that the N3 model, or similar models, could serve in future studies of glass formers being simple to handle, yet capturing the essence of glassiness.
In conclusion, we have applied the matrix approach to the N3 model and found that its super-cooled equation of state becomes singular at density , where the isothermal compressibility power-law diverges. MC simulations confirm that the model shows the characteristics of a fragile glass former undergoing a glass transition at the predicted . It thus follows that in this model the phenomenological glass transition, observed as a fragile-glass dynamical arrest at , is accompanied by a thermodynamic criticality.
References
- (1) P. G. Debenedetti and F. H. Stillinger, Nature 410, 259 (2001).
- (2) P. G. De Benedetti, Metastable Liquids (Princeton University Press, 1997).
- (3) A. Cavagna, Phys. Rep. 476, 51 (2009)
- (4) C.A. Angell In: K.L. Ngai and G.B. Wright, Editors, Relaxation in Complex Systems, US Dept. Commerce, Springfield (1985).
- (5) W. Götze and L. Sjögren, Rep. Prog. Phys. 55, 241 (1992).
- (6) D.R. Reichman and P. Charbonneau J. Stat. Mech. P05013 (2005).
- (7) M. Mézard and G. Parisi , Phys. Rev. Lett. 82, 747 (1999).
- (8) T.R. Kirkpatrick, D. Thirumalai and P.G. Wolynes, Phys. Rev. A 40, 1045 (1989).
- (9) V. Lubchenko and P. G. Wolynes, Ann. Rev. of Phys. Chem. 58 235 (2007).
- (10) F. Sciortino, J. Stat. Mech P05015 (2005).
- (11) A. Baram and J.S. Rowlinson, J. Phys. A 23, L399 (1990).
- (12) Z. Rotman and E. Eisenberg, Phys. Rev. E 80 031126 (2009).
- (13) E. Eisenberg and A. Baram, Phys. Rev. E 73, 025104 (RC) (2006).
- (14) E. Eisenberg and A. Baram, PNAS 104, 5755 (2007).
- (15) R. J. Speedy, Mol Phys 95, 169-178 (1998).
- (16) M.D. Rintoul, S. Torquato, J Chem Phys 105, 9258 (1996).
- (17) R. S. L. Stein and H. C. Andersen, Phys. Rev. Lett. 101, 267802 (2008)
- (18) J. Berry, K. R. Elder and M. Grant, Phys. Rev. E 77, 061506 (2008)
- (19) A. Bellemans and J. Orban, Phys. Rev. Lett. 17, 908 (1966).
- (20) J. Orban and D. Van Belle, J. Phys. A 15, L501 (1982).
- (21) E. Eisenberg and A. Baram, Europhys. Lett. 71, 900 (2005).
- (22) E. Eisenberg and A. Baram, J. Phys. A, 33, 1729 (2000).
- (23) C. Dasgupta, A.V. Indrani, S. Ramaswamy and M.K. Phani, Europhys. Lett. 15, 307 (1991).
- (24) C. Toninelli, M. Wyart, L. Berthier, G. Biroli, and J. P. Bouchaud, Phys. Rev. E 71, 041505 (2005).
- (25) Dalle-Ferrier et al., Phys. Rev. E, 76 041510 (2007).
- (26) S. Franz and G. Parisi, J. Phys.: Condens. Matter 12, 6335 (2000).
- (27) B. Doliwa and A. Heuer, Phys. Rev. E 61, 6898 (2000).
- (28) S. Karmakar, C. Dasgupta and S. Sastry, PNAS 106, 3675 (2009).