The Expanding Nebular Remnant of the Recurrent Nova
RS Ophiuchi (2006): II. Modeling of Combined
Hubble Space Telescope Imaging and
Ground-based Spectroscopy
Abstract
We report Hubble Space Telescope imaging, obtained 155 and 449 days after the 2006 outburst of the recurrent nova RS Ophiuchi, together with ground-based spectroscopic observations, obtained from the Observatorio Astronómico Nacional en San Pedro Mártir, Baja California, México and at the Observatorio Astrofísico Guillermo Haro, at Cananea, Sonora, México. The observations at the first epoch were used as inputs to model the geometry and kinematic structure of the evolving RS Oph nebular remnant. We find that the modeled remnant comprises two distinct co-aligned bipolar components; a low-velocity, high-density innermost (hour glass) region and a more extended, high-velocity (dumbbell) structure. This overall structure is in agreement with that deduced from radio observations and optical interferometry at earlier epochs. We find that the asymmetry observed in the west lobe is an instrumental effect caused by the profile of the HST filter and hence demonstrate that this lobe is approaching the observer. We then conclude that the system has an inclination to the line of sight of 39 degrees. This is in agreement with the inclination of the binary orbit and lends support to the proposal that this morphology is due to the interaction of the outburst ejecta with either an accretion disk around the central white dwarf and/or a pre-existing red giant wind that is significantly denser in the equatorial regions of the binary than at the poles. The second epoch HST observation was also modeled. However, as no spectra were taken at this epoch, it is more difficult to constrain any model. Nevertheless, we demonstrate that between the two HST epochs the outer dumbbell structure seems to have expanded linearly. For the central (hour glass) region there may be evidence of deceleration, but it is harder to draw firm conclusions in this case.
1 INTRODUCTION
RS Ophiuchi is a symbiotic recurrent nova (RN) with outbursts recorded in 1898, 1933, 1958, 1967, 1985 (see Rosino, 1987; Rosino & Iijima, 1987) and 2006 (Evans et al., 2008, and references therein). However, during the period 1898 - 1933, before the star was known to be a RN, some outbursts might have occurred, most likely in 1907 (Schaefer, 2004) and there is also evidence for an eruption in 1945 (Oppenheimer & Mattei, 1993). RS Oph was observed to be undergoing its latest eruption on 2006 February 12.83 (Narumi et al., 2006), reaching a magnitude V = 4.5 at this time. We define this as = 0. The optical light curve then began a rapid decline, consistent with that seen in previous outbursts (Rosino, 1987, AAVSO111see http://www.aavso.org). The distance to RS Oph has been derived from several lines of evidence as 1.6 0.3 kpc (Bode 1987; Barry et al., 2008, see also and the discussion in Section 3.1 below).
The RS Oph binary system comprises a red giant, with a spectral type estimated to be in the range G5III to M4III (e.g. Bohigas et al., 1989; Anupama & Mikołajewska, 1999), and a white dwarf (WD) with mass thought to be close to the Chandrasekhar limit (see Dobrzycka & Kenyon, 1994; Shore et al., 1996; Fekel et al., 2000; Brandi et al., 2009). Accretion of hydrogen-rich material from the red giant onto the WD surface leads to a thermonuclear runaway, as in the outbursts of classical novae (CNe). The much shorter inter-outburst period for RNe compared to CNe is predicted to be due to a combination of high WD mass and a high accretion rate (e.g. Starrfield et al., 1985; Yaron et al., 2005). These models lead to the ejection of smaller amounts of material at higher velocities than those for CNe (typically 10-8 to 10-6 and several thousand km s-1, respectively, for RNe). Spectroscopy of RS Oph has indeed shown H line emission with FWHM = 3930 km s-1 and FWZI = 7540 km s-1 on 2006 February 14.2 ( = 1.37 days; Buil 2006).
Unlike CNe, where the mass donor is a low mass main sequence star, the presence of the red giant in the RS Oph binary means that the high-velocity ejecta run into a dense circumstellar medium in the form of the red giant wind, setting up a shock system. The forward shock moving into the wind has a gas temperature 2.2108 K for a shock velocity = 4000 km s-1 (Bode et al., 2006).
Very Long Baseline Interferometry (VLBI) radio observations by O’Brien et al. (2006) at t = 13.8 days showed a partial ring of non-thermal radio emission resulting from the expanding shock, which developed into a more bipolar structure (see also O’Brien et al., 2008). They suggested that the asymmetry in this ring could be due to absorption in the overlying red giant wind and they also noted the emergence of more extended components to the east and west. Sokoloski et al. (2008) followed the evolution of the radio source with the Very Long Baseline Array (VLBA) at 4 epochs between 34 and 51 days after outburst. They found a central thermally-dominated source linked by what appeared to be a narrow (collimated) outflow to expanding non-thermal lobes which they interpreted as the working surfaces of jets. Jet collimation could be due to the expected accretion disc around the WD. It should be noted that Taylor et al. (1989) had also interpreted their 5 GHz VLBI map from day 77 after the 1985 outburst in terms of a central thermal source with expanding non-thermal lobes.
From Hubble Space Telescope (HST) observations, 155 days after outburst, Bode et al. (2007, hereafter Paper I) revealed the remnant to have a double ring structure with the major axis lying in the east-west direction (see also Section 3). They suggested that there was evidence for deceleration in the north-south direction by comparing their observations to earlier epoch observations in the radio (O’Brien et al., 2006). Paper I also provided preliminary models of the remnant as a bipolar structure which implied a true expansion velocity, = 5600 1100 km s-1 for the material at the poles. It was proposed that the shaping of the remnant occurred due to the ejecta interaction with the pre-existing circumstellar environment.
The projected 2-D geometry of nova explosions on the sky is usually complex, as are their 1-D spectra. However, taken together they provide the underlying 3-D structure of an object. The projected image on the sky provides spatial information on its structure while the spectra provide information about the component of the velocity vector along the line of sight. Here we re-examine the HST observations of the expanding nebular remnant taken at 155 days and report those at a second epoch at 449 days after outburst. We compare these to spectral observations (where available), then using a modeling code, determine the detailed 3-D structure of the remnant. In Section 2 we present our observations and data reduction methods. The results are presented in Section 3 and then modeled in Section 4. In Section 5 we discuss the implications of the results found in Section 4. Finally, in Section 6 we summarise our conclusions.
2 OBSERVATIONS AND DATA REDUCTION
We imaged RS Oph with the HST on two occasions, under the Director’s Discretionary programs GO/DD-11004 and GO/DD-11075. The first observations were made on 2006 July 17 (155 days after outburst) with the High-Resolution Channel (HRC) of the Advanced Camera for Surveys (ACS), with a scale of pixel-1 (equivalent to 40 AU pixel-1 at kpc). The second observations were made on 2007 May 7 (449 days after outburst) with the Planetary Camera CCD of the Wide Field Planetary Camera 2 (WFPC2), with a scale of pixel-1, since in the meantime the ACS had suffered a failure. During the first epoch observations, the ACS/HRC was used with three narrowband filters to isolate the H+[N ii] (F658N), [O iii] 5007 (F502N) and [Ne v] 3426 (F344N) nebular emission lines. For the subsequent WFPC2 observations, only the F502N filter was used in order to isolate the [O iii] 5007 emission line. This line was chosen based on the results from the first epoch observations.
Here we concentrate on the F502N filter observations common to both epochs. The other two HST filter bands, F344N and F658N, will not be discussed because we have no spectral information available for the former and the latter presented little significant structure in the epoch 1 HST images (see Paper I, ).
All data were reprocessed using standard procedures outlined in the ACS222See http://www.stsci.edu/hst/acs/documents/handbooks/
DataHandbookv5/ACS_longdhbcover.html and WFPC2333See http://www.stsci.edu/instruments/wfpc2/Wfpc2_dhb/
WFPC2_longdhbcover.html Data Handbooks and the Pydrizzle444See http://stsdas.stsci.edu/pydrizzle and Multidrizzle555See http://stsdas.stsci.edu/pydrizzle/multidrizzle/ Handbooks. PSF profiles were generated using TinyTim (Krist, 1995) for both ACS/HRC and WFPC2 images. In the ACS/HRC and WFPC2 images, the PSF flux was scaled to an extent such that when subtracted from the observed image the new PSF-subtracted image pixel flux was close to those surrounding it. Deconvolution was then performed using the Lucy-Richardson method for the ACS/HRC and WFPC2 images. CLEAN and Maximum Entropy techniques were also used as a check, and produced similar results.
Spectral observations were carried out at the Observatorio Astronómico Nacional en San Pedro Mártir, Baja California, México, using the 2.1 m telescope with the Boller & Chivens and Echelle spectrographs, and at the Observatorio Astrofísico Guillermo Haro, at Cananea, Sonora, México, using the 2.12 m telescope with their Boller & Chivens spectrograph. The Boller & Chivens spectrographs have intermediate spectral resolutions, from R 1500 to 3500, while the Echelle spectrograph has a maximum resolution of about R = 18000 at 5000Å. The data were reduced using the Image Reduction and Analysis Facility (IRAF)666IRAF is distributed by the National Optical Astronomical Observatories, which is operated by the Associated Universities for Research in Astronomy, Inc., under contract to the National Science Foundation. software.
The observations were carried out over several epochs from 10 days (2006 February 22) to 168 days (2006 July 30) after outburst. The log of spectroscopic observations is shown in Table 1. For direct comparison with the HST imaging we focus on the spectral wavelength region around the [O iii] 5007 emission line, which falls in the HST F502N narrowband filter.
3 RESULTS OF OBSERVATIONS
3.1 Hubble Space Telescope Images
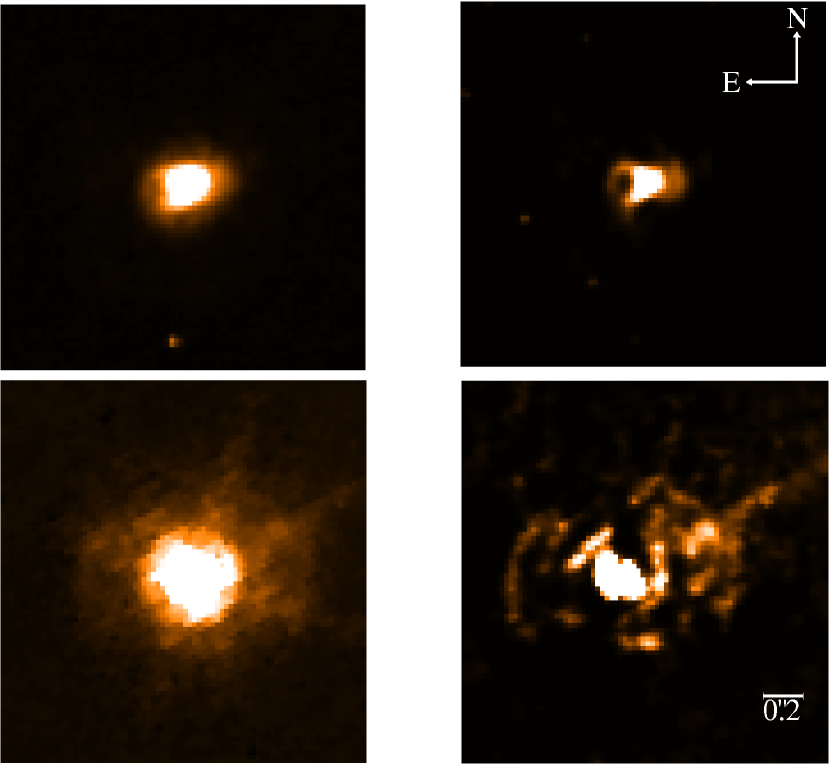
The first epoch observations clearly show extended structure in the [O iii] 5007 line in the deconvolved images, as well as in the raw images at both epochs (Figure 1). As reported in Paper I, a striking feature is the double ring structure (top image in Figure 1) with the major axis lying east-west with a total (peak-to-peak) extent of 360 30 mas, in the plane of the sky, corresponding to an expansion rate of 1.2 0.1 mas day-1 (and equivalent to = 3200 300 km s-1 for kpc, where is the transverse velocity). As an aside, we note that a much larger distance of 4.3 kpc has been suggested by Schaefer (2009). If correct, that would result in = 8600 km s-1 which is of course very much a lower limit to the true expansion velocity of material and which appears to be unfeasibly large for a nova outburst. We also note that the most recent compilation of all distance estimates by Barry et al. (2008) gives kpc, in line with the value we assume here. More extended emission is detected above background in the deconvolved image with an expansion rate of 1.7 0.2 mas day-1 and, when compared with values seen in the radio, it was suggested in Paper I that the east-west bipolar emission seen here and in the radio arises from the same regions of the remnant, if the expansion velocities in the east-west direction are roughly constant after outburst (see also O’Brien et al., 2008).
The north-south (peak-to-peak) extent is 150 25 mas corresponding to an expansion rate of 0.48 0.08 mas day-1. Results of the expansion in the early radio observations (O’Brien et al., 2006; Rupen et al., 2008) and more recently from O’Brien et al. (2008), led to a north-south expansion rate of 0.77 0.04 mas day-1 derived from observations over the first 107 days, suggesting deceleration in this direction (Paper I).
In the second epoch images (bottom images on Figure 1), structure is still visible in the [O iii] 5007 line. It has an east-west extent of 1100 100 mas (peak-to-peak) corresponding to an expansion rate from the center of 1.2 0.1 mas day-1 suggesting no deceleration had taken place between epochs in terms of greatest east-west extent. The north-south extent is much harder to determine but is approximately 460 46 mas corresponding to an expansion rate of 0.51 0.03 mas day-1. This result would imply that no deceleration occurred in the north-south direction between the two epochs.
It is interesting to compare the derived extent of the remnant at each epoch with the expected dimensions of the red giant wind. Assuming a wind that has been expanding for 21 yrs (the period between the last two outbursts) and a wind velocity of 40 km s-1 (Wallerstein, 1958), this implies a maximum wind radius of 2.61015 cm. For a distance kpc, the first epoch angular size suggests the outburst remnant has maximum east-west extent from the center of 4.3 0.41015 cm and at the second epoch the remnant has maximum extent 1.3 0.11016 cm. Therefore, by the time of the HST observations the remnant appears larger in the east-west direction than the expected size of the red giant wind.
3.2 Spectroscopy
In Figures 2-4 we present the spectral evolution of RS Oph as determined from low resolution spectra obtained from day 31 to day 83 after outburst. The principal emission lines were identified following Rosino (1987). Figure 2 shows the observed spectrum 31 days after outburst. The visual magnitude had declined to V 9 by this time. The spectrum shows the presence of broad emission lines of H, H, H, He i (4471, 4713, 4922, 5016, 5048 and 5411), Fe ii (multiplets 27, 28, 42, 48, 49), N iii 4640 and [Si ii] 5041. What Rosino (1987) identified as the [Ar x] 5535 coronal line is also present. Figure 3 shows spectra taken on days 64 and 65 after outburst. The magnitude had now declined to V 10. The spectra show an increased degree of excitation, with the presence of moderately strong coronal lines of [Ar x] 5535 plus [Fe xiv] 5303, and [Fe x] 6374. Also present at this time are the nebular lines of [O iii] (4363, 4959 and 5007) and [N ii] 5755. Figure 4 shows spectra on day 107 after outburst (V 11.5, i.e. approaching minimum light). Here the [Fe xiv] 5303 and [Ar x] 5535 lines have become significantly weaker. In contrast, the spectrum also shows an increase in the relative strength of [O iii], and [N ii], and [O i] 6300 has appeared. This spectral evolution is typical of that seen in previous outbursts (Rosino, 1987; Rosino & Iijima, 1987). We also note, as an aside to our main discussion, that in the day 64 spectrum for example, the lines identified by Rosino (1987) and others as coronal lines are blueshifted with respect to the Balmer and other lower excitation lines by km s-1. This may be related to the relative principal regions of origin of these lines within the velocity field of the remnant.
We used the higher resolution spectra in the region of the [O iii] 5007 emission line to distinguish features arising from different parts of the remnant (Figure 5). For example, during the months of 2006 February and March (bottom two panels in Figure 5, approximately 10 to 30 days after outburst), we identified emission lines of [O iii] 4959 and 5007, He i 5016 and 5048, Fe ii 5018 and [Si ii] 5041. We can immediately see that He i 5048 and [Si ii] 5041 lines are not strongly present in the spectra in 2006 June and July (top two panels in Figure 5). Here we interpret narrow emission lines as arising from the ionized red giant wind ahead of the forward shock, whereas the broad features are associated with the shocked ejecta or the shocked wind (see e.g. Shore et al., 1996).
With the knowledge of the likely origin of various features in the [O iii] 5007 spectral region, we can start modeling the emission in this line from the expanding remnant alone (i.e. by ignoring emission from other elements or from the ionized wind - see Section 4 below). The line profile we model in detail is that of 2006 July 30 ( days) since it was obtained closest in time to our HST imaging (top panel Figure 5).
4 MODELING THE REMNANT
Numerical simulations by Lloyd et al. (1993) suggested that bipolarity can be achieved by either () the outburst being spherically symmetric and the bipolarity resulting from subsequent interactions with an anisotropic red giant wind or () the outburst itself being intrinsically bipolar, with material being ejected preferentially in the polar directions and then interacting with an isotropic ambient medium. Lloyd et al. (1993) found the latter to be the best fit to (the admittedly sparse) observations of bipolar structure from VLBI observations of the 1985 outburst of RS Oph.
More recently, Sokoloski et al. (2008) suggested that the observed bipolar structure in the radio was not due to an intrinsically asymmetric explosion or to shaping of the ejecta by circumbinary material but due to collimation at very early times, possibly by the accretion disk. Other authors (Skopal et al., 2008; Banerjee et al., 2009) have modeled the RS Oph outburst by means of Gaussian fitting to line profiles and find several components that are interpreted as arising from different regions of the expanding remnant; namely the central broad component is associated with more slowly expanding material from the waist while the outliers of the lines are associated by these authors with high velocity ejecta.
Here we have used Shape (Steffen & López, 2006) to analyse and disentangle the 3-D geometry and kinematic structure of the expanding nebular emission in RS Oph. Shape was originally developed to model the complex structures of Planetary Nebulae and is based on computationally efficient mathematical representations of the visual world which allow for the construction of objects placed at any orientation in a cubic volume. It allows modeling of the structure and kinematics of an object to compare with observed images and spectra and includes parameters such as location and width of the spectrograph slit, seeing values and spectral resolutions. We note here that the nebular remnant was of course much smaller than the width of the spectrograph slit at the time of the contemporaneous HST observations on day 155.
We used the information described in the previous section regarding derived velocities and structure of RS Oph’s extended emission as initial parameters in Shape. Particles within Shape, each having uniform emissivity, are used to provide a simulated density and velocity field and can be either distributed uniformly on the surface or within the volume of the appropriate structure. Since the emission line of interest, [O iii] 5007, is very broad and extends beyond the blue cut-off of the HST filter, particularly for the ACS/HRC camera, we also applied a Doppler filter to replicate the finite extent of the HST narrow band filters (in the case of F502N of the ACS, the central wavelength of the filter, width 57Å is 5022Å so the sensitivity to material outside the range km s-1 is greatly reduced - see below).
This modeling also allows us to determine nebular remnant inclination and relate this to that of the central binary (where an inclination = 90∘ corresponds to the major axis of the bipolar structure or the orbital axis of the binary lying in the plane of the sky). Different authors have suggested that the central binary system has an inclination between 30∘ 40∘ (Dobrzycka & Kenyon, 1994) or 49∘ 52∘ (Brandi et al., 2009).
5 RESULTS AND DISCUSSION
5.1 General Structure
Figure 1 suggests that the evolving resolved structure in RS Oph is bipolar and it has been modeled as such by O’Brien et al. (2006) and in Paper I. Assuming a bipolar model, we then varied the inclination of the system. We also adopted a linear velocity field given by
| (1) |
where is the distance of a particle from the center of the remnant and is the true semi-major axis. The waist was modeled so that the north-south extent was constrained to 3.60 1015 cm in line with that derived in Section 3.1 above. In Shape first we introduced the dumbbell structure with particles distributed on the surface (as the image suggested the outer lobes were not centrally filled) and ran the model several times to produce a well sampled model spectrum. The model image was then pixelated to replicate the HST ACS/HRC CCD pixel size of 0.025 arcseconds.
This simple model does not reproduce the observed spectrum. In particular, it gives too broad a line profile, suggesting that lower velocity material must dominate the emission at days. We therefore introduced an over-density towards the center containing lower velocity material. This was accomplished via an inner hour glass structure with semi-major axis 1.26 1015 / cm (for kpc) and with the particles distributed within the volume as the central structure showed no evidence of limb brightening in the HST image. It should be noted that the precise geometry of the inner structure may not be as well constrained as that of the outer dumbbell. However, we have for example explored a simple spherical geometry for this inner region, but the fits to the observed spectra were then much poorer in terms of the gross line profile (inverted U-shape) and finer detail (no double central peak). It should also be noted that this inner structure is smaller than the estimated extent of the red giant wind at this epoch.
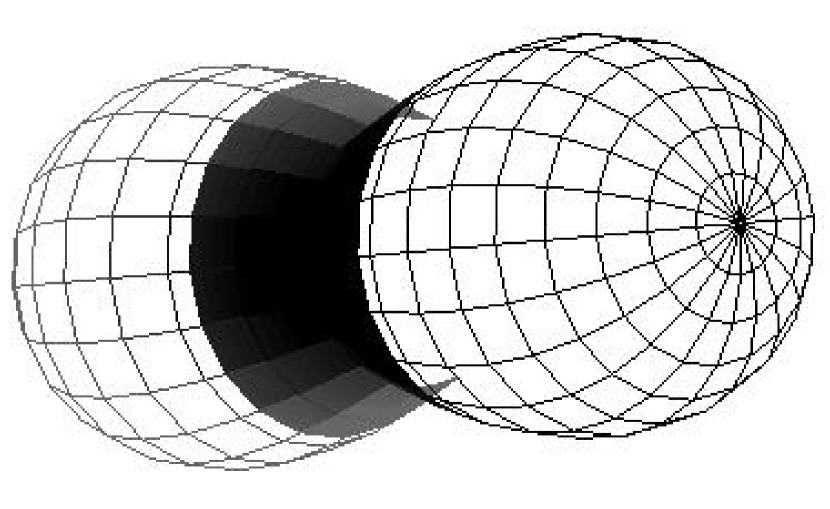
The model system thus contains two structures with the central hour glass having four times more emitting particles than the outer dumbbell structure (Figure 6); this ratio is in approximate agreement with the estimated ratio of flux from the inner region of the image to that in the lobes (factor of 4; likely to be a lower limit for this ratio as some of the flux in the central region will be contributed by the innermost parts of the outer structure).
The existence of a distinctly two component structure is compatible with early infrared interferometry (Chesneau et al., 2007; Chesneau, 2008), and radio observations of a central peak (thermally dominated) and outer lobes (non-thermal; Taylor et al. 1989; Sokoloski et al. 2008; Eyres et al. 2009). In addition, Vaytet et al. (in preparation) have modeled the early time X-ray spectra of RS Oph and found that they also required a density enhancement towards the central regions to give a high enough absorbing column.
5.2 System Orientation
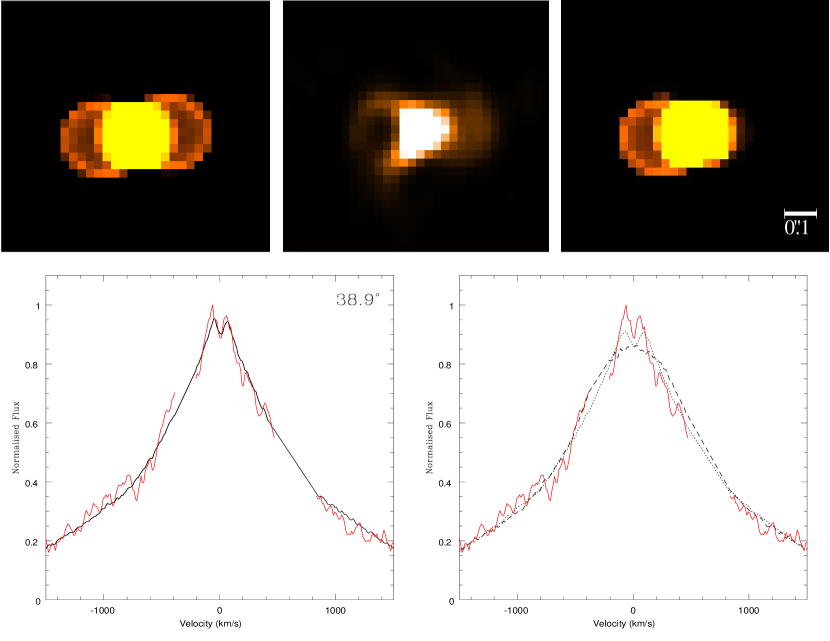
Figure 7 shows the results of modeling using the outer dumbbell and inner hour glass structures described above. The model image reproduces well the general morphology seen in the HST image, including that of the west side appearing less prominent than the east. This asymmetry is an observational effect, due to the finite size of the HST filter F502N (as illustrated in Figure 7; see also Section 4 above) and immediately tells us that the western lobe is approaching the observer. Indeed, any apparent disagreements between the model and observed images can largely be attributed to artefacts of the PSF subtraction procedure. We note that the spectrum shows excess emission on the blueward side (top Figure 5). This could be attributed to Fe ii 5001.91, although this line is not observed in spectra at earlier times (Figure 5).
Although radio observations led O’Brien et al. (2006) to model the RS Oph remnant as a bipolar structure, the deduced orientation of the system differs from that found from our results in the optical. O’Brien et al. (2006) modeled the orientation with the east lobe closest to the observer since that is where a second component appears first in their radio observations at early times. However, our observations suggest that the west lobe must be approaching the observer. This is in agreement with results from infrared interferometry at early times and it is suggested that the early emergence of the eastern-most radio lobe may be due to obscuration by a flared disk of circumbinary material lying in the orbital plane (Chesneau et al., 2007; Chesneau, 2008). Even at the epoch of the first VLBI observation at days, this material has to be external to the binary and would therefore arise from an anisotropic red giant wind. We also find that the system has a position angle on the sky of 85∘ in line with that found from the radio observations of the 1985 outburst by Porcas et al. (1987).
5.3 System Inclination
Shape also allows us to determine the inclination of the system to the line of sight. If the nebula’s orientation is linked to that of the central binary, and with the knowledge that RS Oph is not an eclipsing system, we calculated the upper limit of to be used in our exploration of the inclination angle. For an eclipsing binary with an M2 III giant with a radius of 67 (Dumm & Schild, 1998) and a separation between the giant and WD of AU (if for example M⊙ and days (see e.g Dobrzycka & Kenyon, 1994; Fekel et al., 2000; Brandi et al., 2009)) we find that eclipses will occur if 78 degrees. A lower limit for the range over which we explored the model was constrained by velocities being far too high to arise from a nova explosion; e.g. at = 20∘, km s-1. We therefore ran the model for 20∘ 81∘ and determined each model’s respective fit by comparing the observed and model spectra.
We find the best value for the inclination of the remnant to be degrees (Figure 8; the errors were determined in the standard way by taking the and calculating the 1 level). This is in good agreement with the inclination for the central binary found by Dobrzycka & Kenyon (1994) of 30∘ 40∘, though less so with the more recent determination of 49∘ 52∘ by Brandi et al. (2009). For illustration, Figure 7 also shows the synthetic spectra derived at the error limits quoted for the inclination where clearly the synthetic line profiles do not reproduce as well the observed profiles as does the best fit value of 39∘. We note that lines of Fe ii 5001.91, He i 5015.68 and Fe ii 5018.44 have been removed from the observed spectrum prior to model fitting, following the procedure outlined in Section 3, to ensure that our spectral fits are only to the [O iii] 5007 line itself.
5.4 Second Epoch
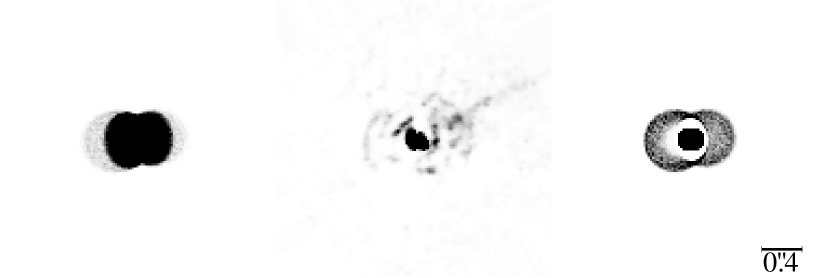
We also modeled the second epoch HST observation at days. Using the built-in time evolution option in Shape, we first explored a simple linear expansion from the first to the second epoch using the results found in Section 4. In this case, the effective wavelength (5012Å) being much less offset from the rest wavelength of the [O iii] 5007 line itself for the same filter in the ACS means that the asymmetry in the resulting image introduced by the Doppler cuts is not as marked as it was for the first epoch (ACS) image. Figure 9 shows the results.
Little resemblance is evident between the observed and modeled images in this case. This is an important result because it tells us that the second epoch is not just a linear expansion of the first, at least in the central regions. We then allowed the dumbbell structure to expand linearly but the inner hour glass was kept the same size as in the first epoch (right hand image in Figure 9). We may understand the linear expansion of the outer structure if, as we calculated above, it had already cleared the pre-existing red giant wind by the first epoch. Alternatively, the apparent constant expansion rate may be consistent with powering by narrow jets as proposed by Sokoloski et al. (2008). The apparent constancy of the inferred size of the innermost hour glass structure is more difficult to understand. However, we should be aware of over-interpretation of the poorer image from the second epoch, plus the lack of contemporaneous optical spectroscopy to aid our modeling. Although the model reproduces some other features of the second epoch observations, for example the gap in the east lobe due to the applied Doppler filter, further investigation is required.
6 SUMMARY
We have reported combined HST imaging, ground-based spectroscopy and detailed modeling of the RS Oph nebular remnant following the 2006 outburst. We find that:
-
1.
The remnant of RS Oph can be understood as a bipolar structure with two co-aligned components. In order to satisfactorily model both the image and spectra from day 155, we require the presence of a high density (low expansion velocity) central region and a more extended (higher expansion velocity) less dense region in the form of two lobes. This morphology is in agreement with that inferred from observations in the radio and at X-ray wavelengths, plus infrared interferometry at early times.
-
2.
The asymmetry observed in the first epoch HST image is due to the finite width of the HST filter. This in turn implies that the west lobe is approaching the observer, in agreement with the results of infrared interferometry at early epochs.
- 3.
-
4.
Modeling of the second epoch HST image implies that the outer dumbbell structure underwent linear expansion; however, there is more evidence of deceleration for the central (hour glass) region.
References
- Anupama & Mikołajewska (1999) Anupama, G. C., & Mikołajewska, J. 1999, A&A, 344, 177
- Banerjee et al. (2009) Banerjee, D., Das, R., & Ashok, N. M. 2009, MNRAS, submitted
- Barry et al. (2008) Barry, R. K., Mukai, K., Sokoloski, J. L., Danchi, W. C., Hachisu, I., Evans, A., Gehrz, R., & Mikolajewska, J. 2008, RS Ophiuchi (2006) and the Recurrent Nova Phenomenon, eds. A. Evans, M. F. Bode, T. J. O’Brien, M. J. Darnley, Astronomical Society of the Pacific Conference Series, 401, 52
- Bode (1987) Bode, M. F. 1987, RS Ophiuchi (1985) and the Recurrent Nova Phenomenon, ed. M. F. Bode (Utrecht:VNU Science Press), 241
- Bode et al. (2006) Bode, M. F., et al. 2006, ApJ, 652, 629
- Bode et al. (2007) Bode, M. F., Harman, D. J., O’Brien, T. J., Bond, H. E., Starrfield, S., Darnley, M. J., Evans, A., & Eyres, S. P. S. 2007, ApJ, 665, L63
- Bohigas et al. (1989) Bohigas, J., Echevarria, J., Diego, F., & Sarmiento, J. A. 1989, MNRAS, 238, 1395
- Brandi et al. (2009) Brandi, E., Quiroga, C., Mikołajewska, J., Ferrer, O. E., & García, L. G. 2009, A&A, 497, 815
- Buil (2006) Buil, C. 2006, Central Bureau Electronic Telegrams, 403, 1
- Chesneau et al. (2007) Chesneau, O., et al. 2007, A&A, 464, 119
- Chesneau (2008) Chesneau, O. 2008, RS Ophiuchi (2006) and the Recurrent Nova Phenomenon, eds. A. Evans, M. F. Bode, T. J. O’Brien, M. J. Darnley, Astronomical Society of the Pacific Conference Series, 401, 231
- Dobrzycka & Kenyon (1994) Dobrzycka, D., & Kenyon, S. J. 1994, AJ, 108, 2259
- Dumm & Schild (1998) Dumm, T., & Schild, H. 1998, New Astronomy, 3, 137
- Evans et al. (2008) Evans, A., Bode, M. F., O’Brien, T. J., Darnley, M. J. 2008, RS Ophiuchi (2006) and the Recurrent Nova Phenomenon, eds. A. Evans, M. F. Bode, T. J. O’Brien, M. J. Darnley, Astronomical Society of the Pacific Conference Series, 401
- Eyres et al. (2009) Eyres, S. P. S., et al. 2009, MNRAS, 517
- Fekel et al. (2000) Fekel, F. C., Joyce, R. R., Hinkle, K. H., & Skrutskie, M. F. 2000, AJ, 119, 1375
- Krist (1995) Krist, J. 1995, Astronomical Data Analysis Software and Systems IV, 77, 349
- Lloyd et al. (1993) Lloyd, H. M., Bode, M. F., O’Brien, T. J., & Kahn, F. D. 1993, MNRAS, 265, 457
- Narumi et al. (2006) Narumi, H., Hirosawa, K., Kanai, K., Renz, W., Pereira, A., Nakano, S., Nakamura, Y., & Pojmanski, G. 2006, IAU Circ., 8671, 2
- O’Brien et al. (2006) O’Brien, T. J., et al. 2006, Nature, 442, 279
- O’Brien et al. (2008) O’Brien, T. J. et al. 2008, RS Ophiuchi (2006) and the Recurrent Nova Phenomenon, eds. A. Evans, M. F. Bode, T. J. O’Brien, M. J. Darnley, Astronomical Society of the Pacific Conference Series, 401, 239
- Oppenheimer & Mattei (1993) Oppenheimer, B. D., & Mattei, J. A. 1993, Journal of the American Association of Variable Star Observers, 22, 105
- Porcas et al. (1987) Porcas, R. W., Davis, R. J., & Graham, D. A. 1987, RS Ophiuchi (1985) and the Recurrent Nova Phenomenon, ed. M. F. Bode (Utrecht:VNU Science Press), 203
- Rosino (1987) Rosino, L. 1987, RS Ophiuchi (1985) and the Recurrent Nova Phenomenon, ed. M. F. Bode (Utrecht:VNU Science Press), 1
- Rosino & Iijima (1987) Rosino, L., & Iijima, T. 1987, RS Ophiuchi (1985) and the Recurrent Nova Phenomenon, ed. M. F. Bode (Utrecht:VNU Science Press), 27
- Rupen et al. (2008) Rupen, M. P., Mioduszewski, A. J., & Sokoloski, J. L. 2008, ApJ, 688, 559
- Schaefer (2004) Schaefer, B. E. 2004, IAU Circ., 8396
- Schaefer (2009) Schaefer, B. E. 2009, ApJ, 697, 721
- Shore et al. (1996) Shore, S. N., Kenyon, S. J., Starrfield, S., & Sonneborn, G. 1996, ApJ, 456, 717
- Skopal et al. (2008) Skopal, A., Pribulla, T., Buil, C., Vittone, A., & Errico, L. 2008, RS Ophiuchi (2006) and the Recurrent Nova Phenomenon, eds. A. Evans, M. F. Bode, T. J. O’Brien, M. J. Darnley, Astronomical Society of the Pacific Conference Series, 401, 227
- Sokoloski et al. (2008) Sokoloski, J. L., Rupen, M. P., & Mioduszewski, A. J. 2008, ApJ, 685, L137
- Starrfield et al. (1985) Starrfield, S., Sparks, W. M., & Truran, J. W. 1985, ApJ, 291, 136
- Steffen & López (2006) Steffen, W., & López, J. A. 2006, Revista Mexicana de Astronomia y Astrofisica Conference Series, 42, 99
- Taylor et al. (1989) Taylor, A. R., Davis, R. J., Porcas, R. W., & Bode, M. F. 1989, MNRAS, 237, 81
- Wallerstein (1958) Wallerstein, G. 1958, PASP, 70, 537
- Yaron et al. (2005) Yaron, O., Prialnik, D., Shara, M. M., & Kovetz, A. 2005, ApJ, 623, 398


| Date (days | Instrument | Total Exposure | R |
|---|---|---|---|
| after outburst) | time (s) | ||
| 2006 February 22 (10) | Echelle | 430 | 16000 |
| 2006 February 23 (11) | Echelle | 425 | 16000 |
| 2006 February 24 (12) | Echelle | 435 | 16000 |
| 2006 February 25 (13) | Echelle | 435 | 16000 |
| 2006 March 14 (30) | Echelle | 600 | 16000 |
| 2006 March 15 (31) | Boller & Chivens | 90 | 2355.2 |
| 2006 April 17⋆⋆Observations taken at the Observatorio Astrofísico Guillermo Haro, otherwise from Observatorio Astronómico Nacional en San Pedro Mártir. (64) | Boller & Chivens | 150 | 1668.6 |
| 2006 April 18⋆⋆Observations taken at the Observatorio Astrofísico Guillermo Haro, otherwise from Observatorio Astronómico Nacional en San Pedro Mártir. (65) | Boller & Chivens | 140 | 3149.6 |
| 2006 May 29 (83) | Boller & Chivens | 40 | 1525.9 |
| 2006 June 18 (126) | Echelle | 1830 | 16000 |
| 2006 June 19 (127) | Echelle | 990 | 16000 |
| 2006 July 30 (168) | Echelle | 420 | 16000 |