∎
313 Splaiul Independentei, 060042 Bucharest Roumanie (UE)
22email: cfbisu@gmail.com 33institutetext: A. Gérard (corresponding author) 44institutetext: C. F. Bisu 55institutetext: O. Cahuc 66institutetext: J-Y. K’nevez 77institutetext: R. Laheurte 88institutetext: Université de Bordeaux,
351 cours de la Libération, 33405 Talence-cedex France (UE)
Tel.: +33 (0)5 40 00 62 23
Fax: +33 (0)5 40 00 69 64
88email: alain.gerard@u-bordeaux1.fr 99institutetext: R. Laheurte 1010institutetext: Université de Bordeaux - IUT EA 496,
15 rue Naudet, 33175 Gradignan Cedex France (UE)
1010email: raynald.laheurte@u-bordeaux1.fr
Self-excited vibrations in turning : Forces torsor analysis
Abstract
The present work deals with determining the necessary parameters considering a three dimensional model to simulate in a realistic way the turning process on machine tool.
This paper is dedicated to the study of the self-excited vibrations incidence on various major mechanics characteristics of the system workpiece / tool / material. The efforts (forces and moments) measurement using a six components dynamometer confirms the tool tip moments existence.
The fundamental frequency of 190 Hz proves to be common to the tool tip point displacements, the action application point or at the torque exerted to the tool tip point. The confrontation of the results concerning displacements and efforts shows that the applications points of these elements evolve according to similar ellipses located in quasi identical planes. The large and the small axes of these ellipses are increasing with the feed rate motion values accordingly to the mechanical power injected into the system. Conversely, the respective axes ratios of these ellipses are decreasing functions of the feed rate while the ratio of these ratios remains constant when the feed rate value is increasing.
In addition, some chip characteristics are given, like the thickness variations, the width or the hardening phenomenon.
Keywords:
Self-excited vibrations Experimental model Turning Torsor measurement Torsor central axisNomenclature
| A | Central axis point; |
|---|---|
| Actions torsor exerted on the tool tip in O point; | |
| Cutting depth (mm); | |
| () | Large (small) ellipse axis attached to the geometrical place of forces application points; |
| BT | Block Tool; |
| BW | Block Workpiece; |
| Directory line of moments projection to the central axis (i = 1, 2); | |
| Ellipse point belong attached of forces application points (i=1-5); | |
| Feed rate (mm/rev); | |
| Chip segmentation frequency (Hz); | |
| () | Variable (nominal) cutting force (N); |
| Effort on cross direction (N); | |
| Effort on cutting axis (N); | |
| Effort on feed rate axis (N); | |
| Maximum chip thickness (mm); | |
| Minimum chip thickness (mm); | |
| Chip undulation length (mm); | |
| Cutting forces minimum moment in A who actuate on the tool (N.m); | |
| Cutting forces moment in the O point who actuate on the tool (N.m); | |
| Spindle speed (rpm); | |
| normal direction; | |
| () | Normal direction projection to the on the (); |
| O | Tool point reference; |
| O’ | Dynamometer center transducer; |
| Plane attached to the forces application points; |
Nomenclature continuation
| Plane attached to the tool point displacements; | |
| Cutting forces vector sum who actuate on the tool (N); | |
| Cutting edge radius (mm); | |
| R | Sharpness radius (mm); |
| Roughness ; | |
| Time related to one revolution of workpiece (s); | |
| u | Tool tip point displacement (m); |
| Cutting speed (m/min); | |
| Maximum chip width (mm); | |
| Minimum chip width (mm); | |
| WTM | Workpiece-Tool-Machine tool; |
| x | Radial direction; |
| y | Cutting axis; |
| z | Feed rate direction; |
| Clearance angle (degree); | |
| Angle of main tool displacements direction included in the plane (x,y) (degree); | |
| Angle of main tool displacements direction included in the plane (y,z) (degree); | |
| Time corresponding of phase difference between two signals (s); | |
| Primary share angle (degree); | |
| Chip width slopes angle between each undulation (degree); | |
| Phase difference between the tool tip displacements components i=x, y, z (degree); | |
| Cutting angle (degree); | |
| Inclination angle of tool edge (degree); | |
| Direct angle (degree); | |
| Stiffness principal direction angle related to the plane (x,y) (degree); | |
| Stiffness principal direction angle related to the plane (y,z) (degree); | |
| Chip hardening coefficient; |
1 Introduction
In the three-dimensional cutting case, the mechanical actions torsor (forces and moments), is often truncated: the moments part of this torsor is neglected fault of adapted metrology mehdi-A-play-02b . However, efforts and pure moments (or torque) can be measured couetard-93 . Recently, an application consisting in six components measurements of the actions torsor in cutting process was carried out for the case of high speed milling couetard-A-darnis-01 , drilling laporte-AA-darnis-07 , yaldiz-AA-isik-07 , etc. Cahuc et al., in cahuc-AA-battaglia-01 presents another use of this six components dynamometer in an experimental study: the taking into account of the cut moments allows a better machine tool power consumption evaluation. The present paper is dedicated to the six components dynamometer use to reach with fine accuracy a vibrations dynamic influence evaluation in turning on the system Workpiece/Tool/Machine tool (WTM).
The concepts of slide block system, moments and torsor (forces and moments) are directly related to the work, undertaken to the previous century beginning, on the mathematical tool "torsor" stawell-00 . Unfortunately, until now the results on the cutting forces are almost still validated using platforms of forces (dynamometers) measuring the three components of those lian-A-huang-07 , marui-A-kato-83b . The actions torsor is thus often truncated because the torsor moment part is probably neglected fault of access to an adapted metrology yaldiz-unsacar-06b , yaldiz-unsacar-06a .
However, recent experimental studies showed the existence of cutting moments to the tool tip cahuc-gerard-06 , laheurte-AA-battaglia-03 , laheurte-A-cahuc-02 , toulouse-AA-gerard-97a . Their taking into account allows thus the best machine tools output approaches cahuc-AA-battaglia-01 , darnis-A-couetard-00 . Nowadays, the use of a dynamometer measuring the mechanical actions torsor six components bisu-AAAAA-ispas-07a , couetard-00a , laporte-AA-darnis-07 allows a better cut approach and should enable to reach new system WTM vibrations properties in the dynamic case.
Moreover, the tool torsor has the advantage of being transportable in any space point and in particular at the tool tip in O point. The study which follows about the cut torsor carries out in several stages including two major; the first relates to the forces analysis and second is dedicated to a first moments analysis to the tool tip during the cut.
After this general information on the torsor concept, an analysis of the efforts (section 2) exerted in the cutting action is carried out. Thanks to this analysis and experimental tests, we establish that the points of variable application exerted on the tool type are included in a plane, more precisely following an ellipse. Then, accordingly in section 3, the first moments analysis obtained at the tool tip in O point is performed. The torsor central axis is required (section 4) and the central axes beams deduced from the multiple tests strongly confirm the moments presence to the tool tip.
2 Forces analysis
2.1 Tests results
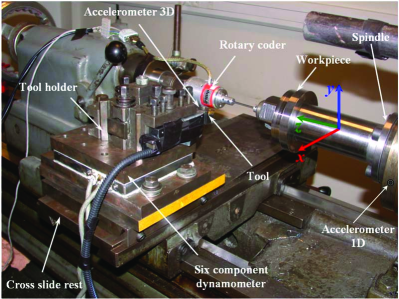
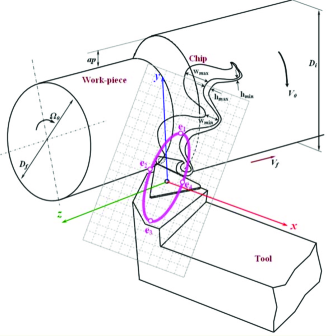
The experiments are performed within a framework similar to that of Cahuc et al cahuc-gerard-06 . For each test, except the feed rate values, all the turning parameters are constant. The mechanical actions are measured according to the feed rate (f) using the six components dynamometer couetard-93 following the method initiated in Toulouse toulouse-98 , developed and finalized by Couétard couetard-00a and used in several occasions cahuc-AA-battaglia-01 , couetard-A-darnis-01 , darnis-A-couetard-00 , laheurte-AA-battaglia-03 , laheurte-A-cahuc-02 . On the experimental device (Fig. 1) the instantaneous spindle speed is permanently controlled (with an accuracy of 1%) by a rotary encoder directly coupled with the workpiece. During the tests the insert tool used is type TNMA 16 04 12 carbide not covered, without chip breeze. The machined material is an alloy of chrome molybdenum type 42CrMo24. The test-workpieces are cylindrical with a diameter of 120 mm and a length of 30 mm. They were designed starting from the Finite Elements Method being coupled to a procedure of optimization described in bisu-AA-k'nevez-07 .
Moreover, the tool geometry is characterized by the cutting angle , the clearance angle , the inclination angle of edge , the direct angle , the cutting edge radius , and the sharpness radius R laheurte-04 . In order to limit to the wear appearance maximum along the cutting face, the tool insert is examined after each test and is changed if necessary (Vb 0.2 mm ISO 3685). The tool parameters are detailed in the Table 1.
| R | |||||
|---|---|---|---|---|---|
| -6∘ | 6∘ | -6∘ | 91∘ | 1,2 mm | 0,02 mm |
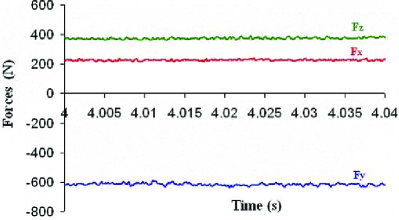
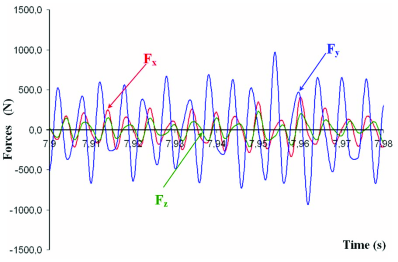
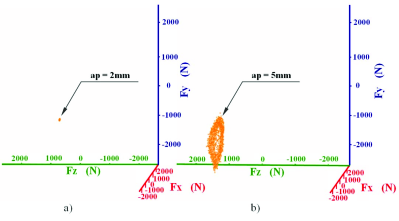
Two examples of resultant efforts measurements applied to the tool tip are presented: one of these for the stable case, ap = 2 mm (Fig. 2), and other for the case with instability, ap = 5 mm (Fig. 3). In the stable case it appears that the force components amplitudes remain almost independant from time parameter. Thus, the amplitude variation is limited to 1 or 2 N around their nominal values, starting with 200 N for () and until 600 N for (). These variations are quite negligible. Indeed the nominal stress reached, the component noticed as the lowest value is the () one, while the highest in the absolute value is (the ) one. While taking as reference the absolute value of () the following relation between these three components comes: = = .
In the unstable case we observe that the efforts components on the cutting axis () has the most important average amplitude (1 500 N). It is also the most disturbed ( 700 N) with oscillations between -2 200 N and -800 N. In the same way the effort according to the feed rate axis () has important average amplitude (1 000 N) and the oscillations have less width in absolute value ( 200 N) but also in relative value ( 20%). As for the effort on the radial direction () it is weakest on average (200 N) but also most disturbed in relative value ( 200 N). These important oscillations are the tangible consequence of the contact tool/workpiece frequent ruptures and thus demonstrate the vibration and dynamical behaviour of the system WTM.
Finally, we note that the amplitudes of all these efforts components applied to the tool tip are slightly decreasing functions of time in particular for the component according to the cutting axis.

2.2 Frequency analysis
The signals frequency analysis performed by using FFT function enables to note in Fig. 4 the presence of frequencies peaks around 190 Hz. Around this frequency peak, we note for the three forces components, a quite high concentration of energy in a wide bandwidth around 70 Hz (36% of the fundamental frequency). All things considered, this width of frequency is of the same order of magnitude as observed (13% of fundamental) by Dimla dimla-04 for a depth of cut three times lower (ap = 1.5 mm) but for an identical feed rate (f=0.1 mm/rev) and a cutting speed similar.This remark confirms that the efforts components is proportionnal to the depth of cut ap as indicated by Benardos et al., benardos-A-vosniakos-06 .
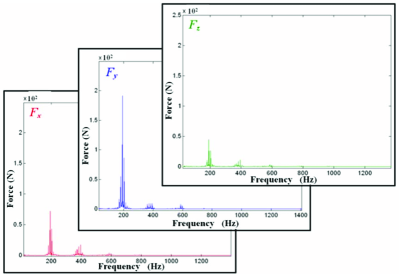
Let us recall that the same frequency of 190 Hz was observed in the tool tip displacements case (in conformity with bisu-AAAAA-ispas-07a ). Consequently, the cutting forces components variations and the self-excited vibrations are influenced mutually, in agreement with ispas-AA-anghel-99 , kudinov-70 , marot-80 , tansel-A-keramidas-92 . Also, in agreement with research on the dynamic cutting process moraru-A-rusu-79 , we note that the self-excited vibrations frequency is different from the workpiece rotational frequency which is located around 220 Hz.
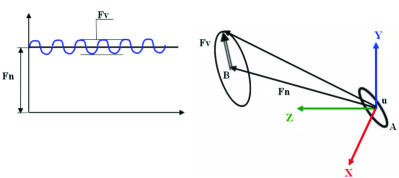
2.3 Forces decomposition
The forces resultant components detailed analysis highlights a plane in which evolves a variable cutting force around a nominal value (see further). This variable force is an oscillating action (Fig. 5) which generates tool tip displacements and maintains the vibrations of elastic system block-tool BT bisu-AA-knevez-06 .
Thus, the cutting force variable (Fig. 5) and the self-excited vibrations of elastic system WTM are interactive, in agreement with research work koenigsberger-tlusty-70 , moraru-A-rusu-79 .
The cutting forces variable part can be observed and compared. Not to weigh down this part, the cutting forces analysis is voluntarily below restricted at only two different situations:
The vibrations effects on the variable forces evolution are detailed on the Fig. 7b. Moreover, the variable forces and displacements analysis associated with the tool tip at the time of the unstable process shows that the forces variation ratio is equivalent to the tool tip displacements variation ratio (in conformity with bisu-07 ). This aspect will be quantified further. Also we concentrate our attention mainly on the unstable case (ap = 5 mm).
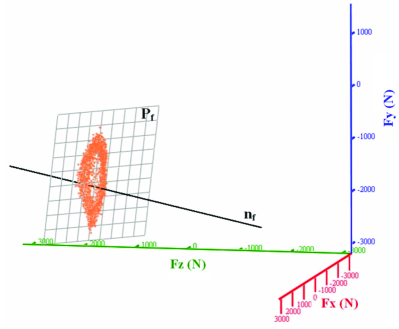
2.4 Plane determination attached of the forces application points
The tests analysis shows that, in the vibratory mode, the load application points describe an ellipse (Fig. 8), that is not the case in the stable mode (without vibrations, Fig. 7a)).
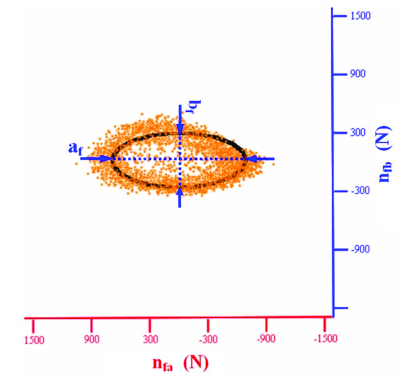
The method used in bisu-AA-knevez-08 to determine the tool tip displacements plane is taken again here (in conformity with Appendix, section 8.1) to establish the plane , place of the load application points, characterized by its normal (Table 2).
| ap = 5 mm | x | y | z | |
|---|---|---|---|---|
| Normal | ||||
| 0.1 | 0.46 | - 0.1 | - 0.882 | |
| f (mm/rev) | 0.075 | 0.419 | - 0.097 | - 0.903 |
| 0.0625 | 0.292 | - 0.113 | - 0.95 | |
| 0.05 | 0.245 | - 0.107 | - 0.964 | |
As for the tool tip displacements study related, a new reference system is associated at the load application points ellipse place. In this new reference system (in conformity with section 8.2) the ellipse large (respectively small) axis dimensions (respectively ) are obtained (Fig. 9). The values of , as that of their ratio / are consigned in the Table 3. It should be noted that and are increasing feed rate functions. It is thus the same for the ellipse surface which grows with , in perfect agreement with the mechanical power injected into the system which is also an increasing feed rate function. On the other hand, the ratio / is a decreasing feed rate function. Thus the ellipse elongation evolves in a coherent way in dependence with the feed rate.
| (mm/rev) | (N) | (N) | / |
|---|---|---|---|
Let us look at now the moments evolution to the tool tip.
3 First moment analysis
3.1 Experimental results
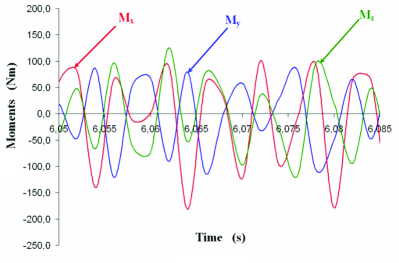
For each test, the mechanical actions complete torsor is measured according to the method already detailed in the section 2.1 couetard-00a . Measurements are taken in the six components dynamometer transducer O’ center and then transported to the tool point O via the moment transport traditional relations brousse-73 . As for the forces, the moments variable part is extracted from measurements. An example of the results measurement is given on the Fig. 10 which zooms on the moments variable part is presented in the Fig. 11.
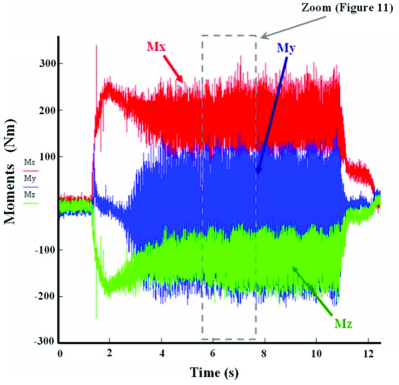
Taking into account the recordings chaotic aspect obtained, an accurate moments components frequency analysis is necessary. It is the object of the following section.
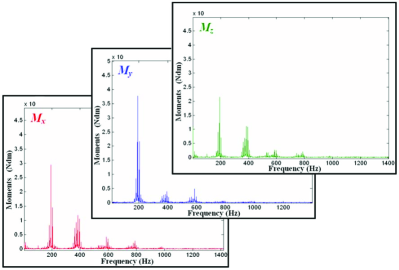
3.2 Moments frequency analysis
An example of moments signals frequency analysis during the vibratory cutting is presented in the Fig. 12. As for the forces analysis, the moments components FFT shows that the most important frequency peak is localized around 190 Hz.
Moreover of all the components, the most important fundamental amplitude is that corresponding to the moments components following to the cutting axis as its transport at the tool tip confirms it. It should be noted that the force component following to this same axis is also most important but has obviously no influence on the moments related to this axis due to co-linearity of these two elements. Conversely, the least important vibration amplitude is that of the moment component located on z axis. However, the number of revolutions being important according to this axis the component contribution to the torques power consumption remains significant.
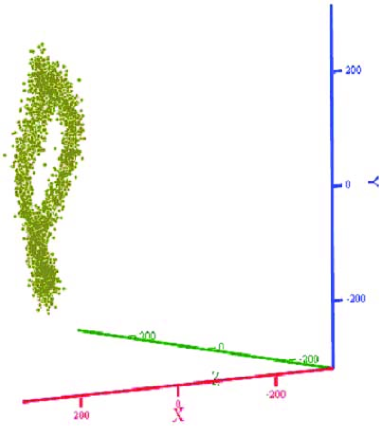
The appearance of other peaks, which are harmonics, slightly modifies the three-dimensional moments representation (Fig. 13) which is not exclusively any more in a plane although the ellipse essence is in a plane. This representation approaches a light form of letter eight contrary to the elliptic planar form efforts characteristic.
4 Central axis
4.1 Central axis determination
It is well-known that with any torsor, it is possible to associate a central axis (except the torsor of pure moment), which is the single object calculated starting from the torsor six components brousse-73 .
A torsor in a point O is composed of a forces resultant and the resulting moment :
| (3) |
The central axis is the line defined classically by:
| (4) |
where O is the point where the mechanical actions torsor was moved (here the tool tip) and A the current point describing the central axis. →OA is thus the vector associated with the bi-point [O, A] (Fig. 14).
This line (Fig. 14-(a)) corresponds to points geometric place where the mechanical actions moment torsor is minimal. The central axis calculation consists in determining the points assembly (a line) where the torsor can be expressed according to a slide block (straight line direction) and the pure moment (or torque) brousse-73 .
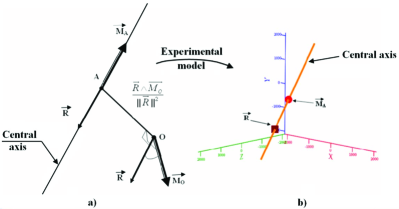
The central axis is also the points place where the resultant cutting force is co-linear with the minimum mechanical moment (pure torque). The test results enable to check for each point of measurement the co-linearity between the resultant cutting force and moment calculated related to the central axis (Fig. 14-(b)).
The meticulous examination of the mechanical actions torsor six components shows that the forces and the moment average values are not null. For each measure point, the central axis is calculated, in the stable (Fig. 15-(a)) and unstable mode (Fig. 15-(b)). In any rigour the case ap = 2 mm should be described as quasi-stable movement, because the vibrations exist but their amplitudes are very low - of the order of the -, thus quasi null compared to the other studied cases. Considering the cutting depth value ap = 3 mm, the recorded amplitude was 10 times more important.
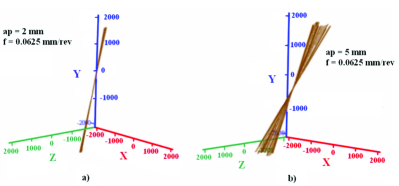
In the presence of vibrations (ap = 5 mm) for a 68 rpm the workpiece speed (44 points of measure by rpm), the dispersive character of the central axes beam, compared to the stable mode, can be observed, where this same beam is tightened more and less tilted compared to the normal axis on the plane (x,y). This central axes dispersion can be explained by the self-excited vibrations which cause the variable moment generation.
4.2 Analysis of central axis moments related
While transporting the moment from tool tip to the central axis, the minimum moment (pure torque) →M_A is obtained. From the moment values to the central axis, the constant and variable part of this one is deduced. As for the efforts, the variable part is due to the self-excited vibrations as revealed below (Fig. 16).
Using this decomposition, the moments contribution on the zones of contact tool / workpiece / chip is expressed. The observations resulting from the analysis show that the tool vibrations generate rotations, cause variations of contact and thus generate variable moments, confirming the efforts analysis detailed in the section 2.1. This representation enables to express the moments along the three axes of the machine tool: swivel moment in the y direction and the two moment of rotation along x and z directions.
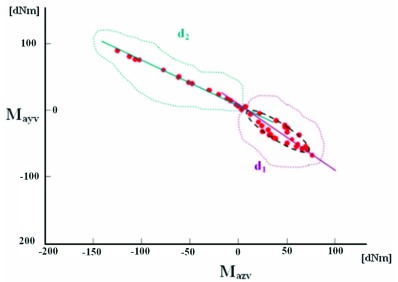
Moments components analysis determined at the central axis allows noting a moments localization mainly on two distinct zones. Taking into account this aspect, the variable moments components are divided into two noted parts and on to the three directions related to the machine. The components of these variable moments on x, y, z, axes are noted respectively (), () and ().
In the vibratory case (ap = 5 mm), the first points family is located (Fig. 16) according to a line and (the large ellipse axis). In the case without vibrations (ap = 2 mm), the two and families merged to only one family located according to only one line. Thus, the elliptic form appearance around the right-hand side seems quite related to the self-excited vibrations (cas ap = 5 mm) bisu-AA-knevez-06 . In particular, the frequency associated with the part is higher than those associated the part. Furthermore, these frequencies are related to the frequencies domain found during moments FFT analysis Fig. 12. Finally, on the central axis, the families and seem to correspond to distinct elements from the generated surface.
5 Workpiece and chip geometry
5.1 Roughness measurements
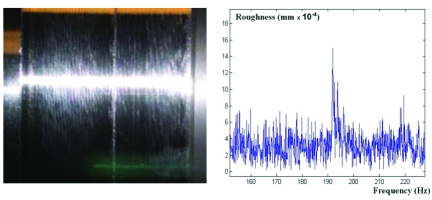
In the processes of matter per cutting tool removal, it is well-known that the manufactured pieces surface quality is closely connected to the thrust force imposed on the matter chen-tsao-06a . In particular, the more the thrust force exerted on the object surface is important, the more the imprint left by the tool on surface is consequent. The surface roughness east thus closely related to the thrust force intensity. The surface roughness is connected confidentially to the thrust force intensity. The self-excited vibrations have an influence on the workpieces quality surface. Now, in the self-excited vibrations case examined here, we have just noticed that the forces and moments are maximum with the resonance frequency which is situated around 190 Hz.
Taking into account the link between roughness and efforts applied to the surface, we should find a maximum of surface roughness around this frequency. In this purpose, we propose to control the profile of a generator length roughness of the cylindrical manufactured piece. Indeed, in every rotation of the machined piece, the tool leaves a imprint force function applied to the generator point observed which corresponds to a given and known moment. Along a given generator, each point of this one is the force image applied to the surface at a known given moment because the rotation speed of the workpiece is known.
The surface roughness examination along a generator should thus necessarily reveal the amplitudes of roughness associated with the efforts periodically applied by the tool in these points. Also the roughness profile FFT presents along a generator of the cylindrical part manufactured should pass, like the efforts, by a maximum around the frequency of 190 Hz. It is indeed what can be observed on the figure 16 where the roughness data FFT analysis shows a frequency peak located around 190 Hz (precisely 191,8 Hz), which is coherent with the previous data.
In addition, the surface roughness analysis gives a total roughness value = 1,6 .
5.2 Chip characteristics
Chip measurements under the Scanning Electron Microscop were carried out and enabled to determine the thickness variation and the chip width. All chips are type 1.3 (ISO 3685) with undulations.
The chip thickness variations between the maximum () and the minimal () thickness are about 2, and feed rate values independent. An example is presented (figure 18) for a sample of chip during a test with the feed rate f=0.05 mm/rev. Values obtained = 0,23 mm and = 0,12 mm.
The measure of chip length corresponding to an undulation enables to find the self-excited vibrations frequencies starting from the cutting speed (in conformity with equation 3):
| (5) |
with the chip segmentation frequency, chip speed, one chip undulation length and the chip hardening coefficient.
To determine the total chip length, it is necessary to measure the wavelength, taking into account the rate of hardening phenomenon (in conformity with equation 4) kudinov-70 of the chip during cutting process and the primary shear angle ,
| (6) |
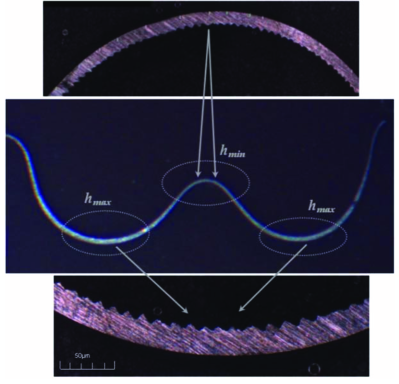
In our case, it is measured on the chip undulation length = 11 mm, with a chip hardening rate = 1.8 and the cutting speed = 238 m/min. A frequency of 206 Hz is then obtained, very near to the frequencies of tool tip displacements or of the load application points during cutting process.
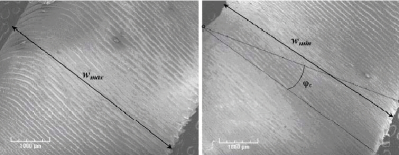
The chip width is then measured with similar techniques. Substantial width variations are observed, about . Indeed, the measured maximum width is 5.4 mm while the evaluated minimal width is 4.9 mm, which means a width variation about 10% - Fig. 19.
6 Correlation between displacements of the tool tip / applied forces
A synthesis between the work-paper two parts is essential. It is carried out below in order to put in evidence the various correlations which exist between stiffness / displacements, displacements of tool / stiffness center or stiffness center / central axis.
6.1 Correlation between the plane of the displacements tool tip / the applied forces
The tool tip point displacements are localized (cf. bisu-AAAAA-ispas-07a ) in a tilted plane. Inside the stiffness matrix determined in the paper (bisu-AA-k'nevez-07 ), a correlation exists between tool tip displacements and the cutting forces applied. In particular, the ratios between the large and the small ellipses axes of tool displacements (/) and the efforts applied (/) decrease feed rate functions while the ratio of these ratios remains constant (equal to 1,64) when the feed rate increase. These elements enable to determine accurately the real configuration of cutting process. These correlations are analyzed using the direct normal to the tool tip point displacements plane and the direct normal to the load application points place (Table 4).
| f(mm/rev) | 0.05 | 0.0625 | 0.075 | 0.1 | ||||
|---|---|---|---|---|---|---|---|---|
| Normal | ||||||||
| Along x | 0.245 | -0.071 | 0.292 | -0.071 | 0.419 | -0.058 | 0.46 | -0.056 |
| Along y | -0.107 | -0.186 | -0.113 | -0.186 | -0.097 | -0.206 | -0.1 | -0.216 |
| Along z | -0.964 | 0.98 | -0.95 | 0.98 | -0.903 | 0.997 | -0.882 | 0.975 |
The existence of these two planes is particularly interesting and adapted to the establishment of a cutting process real configuration. This new aspect is in the course of implementation in order to express and exploit a simplified dynamic three-dimensional model in the reference system associated with these planes bisu-AAAAA-ispas-07 .
6.2 Self-sustained vibrations: experimental validation
From these studies, it comes out that the self-excited vibrations domain is around 190 Hz with accuracy of a few per cent. It is around this common fundamental frequency that the whole of the major characteristics (displacements, efforts, and moments) of system WTM have the most important amplitude variations. The analysis carried out to the measures of tool point displacements and the points for load application enables to evaluate existing constant phase difference between the forces components and corresponding displacements (Fig. 20 to 22).
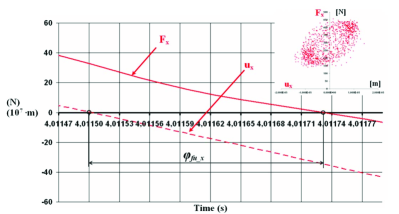
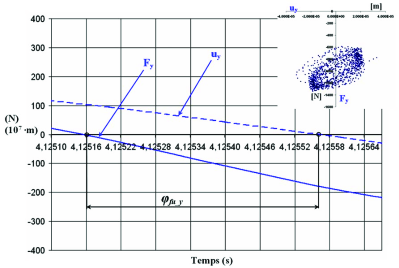
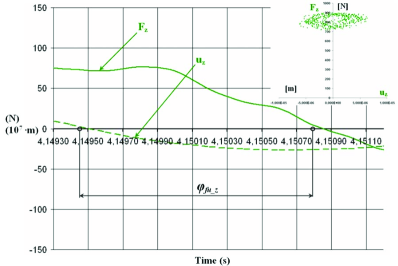
These phase differences confirm the efforts delay compared to the tool tip displacement. The self-excited vibrations appearance can be also explained by the delay force / displacement, which increases the system energy level. The existence of this delay could be explained by the machining system inertia and more particularly by the cutting process inertia koenigsberger-tlusty-70 .
| 13∘ | 23∘ | 75∘ |
Moreover, it is noted that the phase difference with the same range between efforts / displacements (Table 5) remains constant according to the feed rate.
Because of parts elasticity intervening in the operation of turning, it is logical that the response in displacements of unit BT-BW is carried out with a certain shift compared to the efforts variation applied to the tool, variation induced by the lacks of machined surface circularity in the preceding turn which imply variations of the contact tool/workpiece (Fig. 17). Phase difference between the efforts and displacements thus remains a possible explanation to the self-excited vibrations appearance.
Moreover, when the tool moves along the ellipse places , , (Fig. 23), the cutting force carries out a positive work because its direction coincides with the cutting direction. On the other hand, on the side , , , the work produced by the cutting force is negative since its direction is directly opposed to that of displacement. The comparison between these two ellipse parts, as shows that the effort on the trajectory , , is higher as on the trajectory , , because the cutting depth is more important. At the time of this process, work corresponding to an ellipse trajectory remains positive and the increase of result energy thus contributes to maintain the vibrations and to dissipate the energy in the form of heat by the assembly tool/workpiece.
7 Conclusion
The experimental procedures proposed in this work-paper, as well at the static and dynamic level, enabled to determine the elements necessary to a rigorous analysis of the tool geometry influence, its displacement and evolution of the contacts tool/workpiece and tool/chip on the machined surface.
In particular, by analyzing the efforts resultant torsor applied during turning process, the experimental results enabled to establish an efforts vector decomposition highlighting the evolution of a variable cutting force around a constant value. This variable effort evolves into a plane inclined compared to the machine tool reference system.
This cutting force, whose application point describes an ellipse, is perfectly well correlated with the tip tool displacement which takes place under similar conditions. In particular, the ellipses axes ratios remains in a constant ratio when the feed rate varies with a proportionality factor equal with 1,64.
Moreover, the highlighted coupling between the system elastic characteristics BT and the vibrations generated by cutting enabled to demonstrate that the self-excited vibrations appearance is strongly influenced, as it was expect to, by the system stiffness, their ratio and their direction. We also established a correlation between the vibratory movement direction of the machine tool elastic structure, the thickness variations and the chip section.
These results enable to now consider a more complete study by completely exploiting the concept of torsor. Indeed, thanks to the six components dynamometer, we confirmed, for an turning operation, the moments existence to the tool tip not evaluated until now by the traditional measuring equipment.
The originality of this work is multiple and in particular consists in a first mechanical actions torsor analysis applied to the tool tip, with an aim of making evolve a model semi analytical cutting 3D. This study allows, considering a turning operation, to establish strong correlations between the self-excited vibrations and the mechanical actions torsor central axis. It is thus possible, thanks to the parameters use defining the central axis, to study the vibrating system tool/workpiece evolution. It also leads to the description of a "plane of tool tip displacements" in correspondence with "the load application points plane".
Thus, using the plane that characterizes the BT behaviour enable to bring back the three dimensional cutting problem, with space displacements, with a simpler model situated in an inclined plane compared with the reference system of machine tool. Nevertheless, that remains a specific model of three dimensional cutting.
8 Appendix
8.1 Determination of the place points plane of load application on the tool
The plane definition being load application points geometrical place on the tool starting from the experimental results is carried out using the computation Mathcad© software. We seek to determine the plane which passes by the load application points cloud on the tool (Fig. 8 section 2.4):
The errors are noted with and we have :
where:
| (7) |
Here the superscript t indicates the operation of transposition.
Expressing the function using and introducing the displacements components of the tool load application points into the three space directions, it comes:
and :
Now, the vector is calculated by minimization:
where
It results from it that the direct normal components to the plane of the load application points on the tool are given by:
The required plane equation is then:
where s and t are constants, and is equal to :
and is given by:
with the plane orientation vector is:
8.2 Ellipse approximation
Using the ellipse plane determination bisu-AA-knevez-08 , it is possible to determine the characteristics given in Table 3.
Acknowledgements.
The authors would like to thank the CNRS (Centre National de la Recherche Scientifique UMR 5469) for the financial support to accomplish the project.References
- (1) Benardos P. G., Mosialos S., Vosniakos G. C., Prediction of workpiece elastic deflections under cutting forces in turning, Robotics and Computer-Integrated Manufacturing, 22, 505-514, (2006)
- (2) Bisu C. F., Etude des vibrations auto-entretenues en coupe tridimensionnelle: nouvelle modélisation appliquée au tournage, Ph. D. Thesis, Université Bordeaux 1 and Universitatea Politehnica Bucharest, (2007)
- (3) Bisu C. F., Darnis P., Gérard A., K’nevez J-Y., Displacements analysis of self-excited vibrations in turning, Int. J. Adv. Manuf. Technol., in Press doi: 10.1007/s00170-008-1815-8 (2008)
- (4) Bisu C. F., Darnis P., K’nevez J. Y., Cahuc O., Laheurte R., Gérard A., Ispas C., Nouvelle analyse des phénomènes vibratoires en tournage, Mécanique & Industries, 8, 497-503, (2007)
- (5) Bisu C. F., Darnis P., K’nevez J-Y., Laheurte R., Cahuc O., Gérard A., Ispas C., Dynamic model of the three-dimensional cut, 18th Int. DAAAM symp., Intel. Manuf. & Autom. Foc. on Creat., 42-43, 24-27 October - Zadar, (2007)
- (6) Bisu C. F., Ispas C., Gérard A., K’nevez J-Y., Optimization and dynamic characterization system part in turning, Int. Conf. Manuf. Syst. - ICMa’S -, Romania Academy of Sciences, 15–18, 22 November - Bucharest, (2007)
- (7) Bisu C. F., Laheurte R., Gérard A., K’nevez, J-Y., The regenerative vibration influence on the mechanical actions turning, Int. Conf. Manuf. Syst. - ICMa’S -, Romania Academy of Sciences, 291-294, 26-27 October - Bucharest, (2006)
- (8) Brousse P., Cours de mécanique ( cycle et classe prépa.), Armand colin, Paris, (1973)
- (9) Cahuc O., Darnis P., Gérard A., Battaglia J-L., Experimental and analytical balance sheet in turning applications, Int. J. Adv. Manuf. Technol., 29, 648-656, (2001)
- (10) Cahuc O., Gérard A., Metrology influence on the cutting modelisation, 15thInt. Conf. Mach. Syst. - ICMa’S-, Romania Academy of Sciences, 25-42, 26-27 October - Bucharest, (2006)
- (11) Chen C. K., Tsao Y. M., A stability analysis of regenerative chatter in turning process without using tailstock, Int. J. Adv. Manuf. Technol., 29, 648-654, (2006)
- (12) Couétard Y., Capteurs de forces à deux voies et application à la mesure d’un torseur de forces, Brevet français - CNRS, (1993)
- (13) Couétard Y., Caractérisation et étalonnage des dynamomètres à six composantes pour torseur associé à un système de forces, Ph. D. Thesis, Université Bordeaux 1 Talence, (2000)
- (14) Couétard Y., Cahuc O., Darnis P., Mesure des 6 actions de coupe en fraisage grande vitesse, Third Int. Conf. on Met. Cut. and High Speed Machin., 37-42, 27-29 juin - Metz, (2001)
- (15) Darnis P., Cahuc O., Couétard Y., Energy balance with mechanical actions measurement during turning process, In: Int. Sem. on Improv. Mach. Tool Perfor., 3-5 July - La baule, (2000)
- (16) Dimla Sr D. E., The impact of cutting conditions on cutting forces and vibration signals in turning with plane face geometry inserts, J. Mat. Proc. Tech., 155-156, 1 708-1 715, (2004)
- (17) Ispas C., Gheorghiu H., Parausanu I., Anghel V., Vibrations des systèmes technologiques, Agir, Bucarest, (1999)
- (18) Koenigsberger F., Tlusty J., Machine Tools Structures, Pergamon Press, (1970)
- (19) Kudinov V. A., Dinamica Masinilor Unelten, Tehnicas, Bucarest,(1970)
- (20) Laheurte R., Application de la théorie du second gradient à la coupe des matériaux, Ph. D. Thesis, Université Bordeaux 1 Talence, (2004)
- (21) Laheurte R., Cahuc O., Darnis P., Battaglia J. L., Metrological devices in cutting process, Int. ESAFORM Conf. on Mat. Form., 28-30 April - Salerno, (2003)
- (22) Laheurte R., Darnis P., Cahuc O., Evaluation de l’énergie mise en jeu et du comportement des outils de coupe dans l’usinage, In: IDMME’ 02, 36, 14-16 Mai - Clermont Ferrand, (2002)
- (23) Laporte S., K’Nevez J-Y., Cahuc O., Darnis P., A parametric model of drill edge angles using grinding parameters, Int. J. Form. Proc., 10, (4), 411-428, (2007)
- (24) Lian R. J., Lin B. F, Huang J. H., Self-organizing fuzzy control of constant cutting force in turning, Int. J. Adv. Manuf. Technol., 29, 436-445, (2007)
- (25) Marot G., Coefficient dynamique de coupe. Théories actuelles et proposition d’une méthode de mesure directe en coupe, Ph. D. Thesis, Université Pierre et Marie Curie - Paris VI Paris (1980)
- (26) Marui E., Ema S., Kato S., Chatter vibration of the lathe tools. Part 2 : on the mechanism of exciting energy supply, J. of Engng. for Indust., 105, 107-113, (1983)
- (27) Mehdi K., Rigal J-F., Play D., Dynamic behavior of thin wall cylindrical workpiece during the turning process, Part 2: Experimental approach and validation, J. Manuf. Sci. and Engng., 124, 569-580, (2002)
- (28) Moraru V., Ispas, C., Rusu S., Vibratiile si Stabilitatea Masinilor Unelte, Tehnicas, Bucarest, (1979)
- (29) Stawell Ball G., A treatise on the theory of screws, Cambridge University Press, London, (1900)
- (30) Tansel I. N., Erkal C., Keramidas T., The chaotic characteristics of three dimensional cutting, Int. J. Mach. Tools Manuf., 32, (6), 811-827, (1992)
- (31) Toulouse D., Contribution à la modélisation et à la métrologie de la coupe dans le cas d’un usinage tridimensionnel, Ph. D. Thesis, Université Bordeaux 1 Talence, (1998)
- (32) Toulouse D., Couétard Y., Cahuc O., Gérard A., An experimental method for the cutting process in three dimensions, In: DYMAT 97, 21-26, 22-26 September Toledo, Spain, (1997)
- (33) Yaldiz S., Ünsacar F., Design, development and testing of a turning dynamometer for cutting force measurement, Materials & Design, 27, 839-846, (2006)
- (34) Yaldiz S., Ünsacar F., A dynamometer design for measurement the cutting forces on turning, Measurement, 39, 80-89, (2006)
- (35) Yaldiz S., Ünsacar F., Saglam H., Isik H., Design, development and testing of a four-component milling dynamometer for the measurement of cutting force and torque, Mech. Syst. and Sign. Proces., 21, 1 499–1 511, (2007)