THE LIFETIME OF PROTOPLANETARY DISKS IN A LOW-METALLICITY ENVIRONMENT111Based on data collected at Subaru Telescope, which is operated by the National Astronomical Observatory of Japan.
Abstract
The extreme outer Galaxy (EOG), the region with a Galactic radius of more than 18 kpc, is known to have very low metallicity, about one-tenth that of the solar neighborhood. We obtained deep near-infrared (NIR) images of two very young (0.5 Myr) star-forming clusters that are one of the most distant embedded clusters in the EOG. We find that in both clusters the fraction of stars with NIR excess, which originates from the circumstellar dust disk at radii of 0.1 AU, is significantly lower than those in the solar neighborhood. Our results suggest that most stars forming in the low-metallicity environment experience disk dispersal at an earlier stage (1 Myr) than those forming in the solar metallicity environment (as much as 5–6 Myr). Such rapid disk dispersal may make the formation of planets difficult, and the shorter disk lifetime with lower metallicity could contribute to the strong metallicity dependence of the well-known “planet-metallicity correlation”, which states the probability of a star hosting a planet increases steeply with stellar metallicity. The reason for the rapid disk dispersal could be increase of the mass accretion rate and/or the effective far-ultraviolet photoevaporation due to the low extinction; however, another unknown mechanism for the EOG environment could be contributing significantly.
1 INTRODUCTION
Because the EOG is known to have an extreme environment such as very low metallicity, [O/H] (Rudolph et al., 2006), it can be studied as a “laboratory” for the star formation process in an environment totally different from the solar neighborhood (Ferguson et al., 1998; Kobayashi et al., 2008). As a part of our studies of star formation in the EOG (Yasui et al., 2006, 2008), we explore in this paper the lifetime of circumstellar disks in a low-metallicity environment.
The frequency of disks harboring stars within a young embedded cluster, the disk fraction, has been studied for many clusters of various ages as an indicator of the disk lifetime (Haisch et al., 2001a; Hernández et al., 2007). The most common means of estimating the disk fraction is the detection of infrared emission from warm and hot dust (typically a few 100 to 1500 K) in the inner part of the disk (within a stellocentric distance of 1 AU) (Kenyon & Hartmann, 1987) with wavelengths of 2–24m using -band (2.2m) (Lada, 1999; Hillenbrand, 2005), -band (3.5m) (Haisch et al., 2001a), and Spitzer IRAC 3.6–8m and/or MIPS 24m (Sicilia-Aguilar et al., 2006) filters. The disk fraction was found to decrease as a function of age, showing that the inner disk lifetime is about 5–10 Myr for nearby embedded clusters with the solar metallicity. Because (sub-)mm continuum observations of cold dust (10 K) in the outer disk (50 AU) correlate very well with observations of inner dust disks (Andrews & Williams, 2005), the entire disk, from 0.1 to 100 AU, is thought to be dispersed almost simultaneously (within yr). Therefore, the lifetime of the entire disk is also thought to be 5–10 Myrs.
The disk lifetime in a low-metallicity environment is of special interest because of the discovery that the probability of a star hosting a planet increases with stellar metallicity (”planet-metallicity correlation”) (Gonzalez, 1997; Fischer et al., 2005; Santos et al., 2003). However, the disk lifetime in an environment with lower metallicity than the solar neighborhood has not been studied. By directly studying the disk lifetime in the EOG, it may be possible to obtain clues to the mechanism of this “planet-metallicity correlation.” Although the disk fraction has been studied for a low-metallicity ([O/H]) (Arnault et al., 1988) star-forming cluster, 30 Doradus, in the Large Magellanic Cloud (LMC) (Maercker & Burton, 2005; Maercker et al., 2006), the target stars were limited to only very massive ones (20) because of the limited sensitivity and spatial resolution for this extragalactic cluster. Because the EOG is much closer than nearby dwarf galaxies, it allows us to obtain accurate disk fractions in a low-metallicity environment to 0.3, which is below the characteristic peak of IMF (Elmegreen et al., 2008). This mass detection limit corresponds to the lowest mass of the target stars for the planet-metallicity correlation (e.g., FGK-type stars) (Fischer et al., 2005) and is therefore critical for understanding the correlation.
2 OBSERVATION
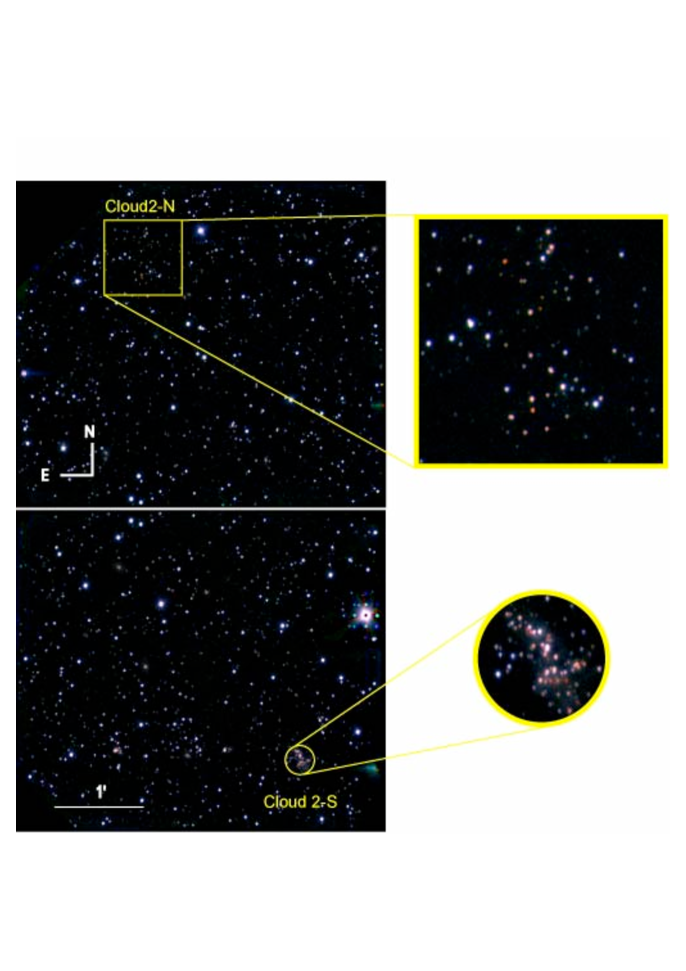
Our targets, the Digel Cloud 2 clusters (Yasui et al., 2008; Kobayashi et al., 2008) are among the most distant embedded clusters in the EOG at kpc. They are located in a giant molecular cloud, Cloud 2, one of the most distant molecular clouds in the EOG (Digel et al., 1994). The metallicity [O/H] of Cloud 2 is measured at dex from the radio molecular emission lines (Lubowich et al., 2004), which is comparable to that of LMC ( dex) and Small Magellanic Cloud (SMC; 0.9 dex) (Arnault et al., 1988). The dust-to-gas ratio in Cloud 2 was estimated to be as low as 0.001 from a submm continuum observation (Ruffle et al., 2007). This is about 10 times smaller than in the solar neighborhood, and is consistent with the metallicity. Because the Cloud 2 clusters are much closer ( kpc) than LMC/SMC ( kpc), they are quite suitable for the study of the disk fraction in a low-metallicity environment. Their youth (most likely age of 0.5 Myr) (Yasui et al., 2006, 2008; Kobayashi et al., 2008) adds an advantage to the present study because any variation in disk fraction should be most clearly seen when the disk fraction value is near its maximum. Because the EOG is located at the large heliocentric distance of 10 kpc, high sensitivity and high spatial resolution is necessary for the present study.
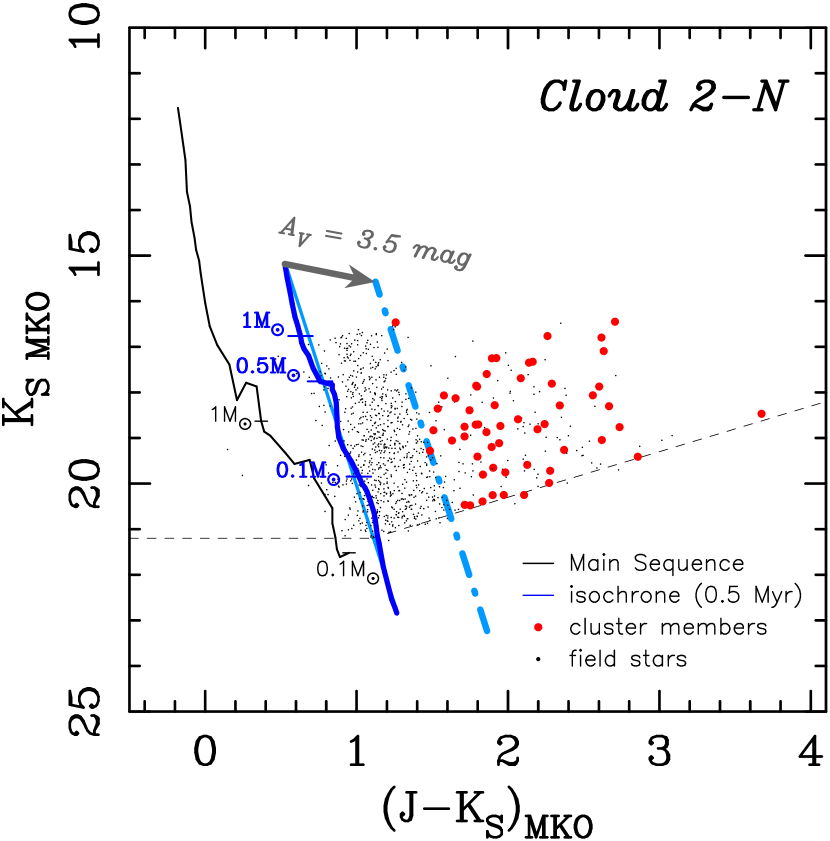
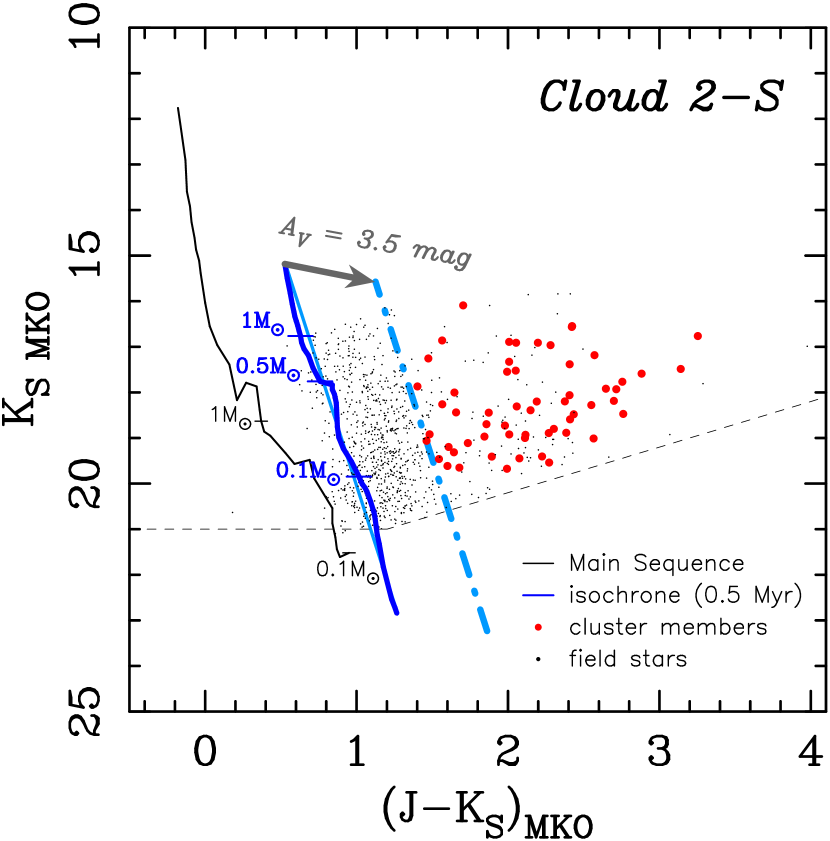
Deep -band images of Cloud 2 clusters were obtained on September 2, 2006 with an exposure time of 600 sec for each band with the 8.2-m Subaru telescope equipped with a wide-field NIR camera, MOIRCS (Ichikawa et al., 2006). The seeing was as good as 0.35′′–0.45′′ through the night. As a result, we obtained deeper images than our preliminary studies of the Cloud 2 clusters (Yasui et al., 2006, 2008). All the data were reduced with IRAF222IRAF is distributed by the National Optical Astronomy Observatories, which are operated by the Association of Universities for Research in Astronomy, Inc., under cooperative agreement with the National Science Foundation. with standard procedures, and the results are shown in Fig. 1. aperture photometry has been performed using IRAF apphot. The Mauna Kea Observatories (MKO) filters were used (Tokunaga et al., 2002). GSPC P330-E, which is a MKO standard (Leggett et al., 2006), was used for the photometric calibration. Because the fields of the Cloud 2 clusters are very crowded, we used the aperture diameters and for the Cloud 2-N and 2-S cluster members, respectively, to avoid the contamination of adjacent stars. The limiting magnitudes (10 ) for the Cloud 2-N cluster are mag, mag, mag, while those for the Cloud 2-S clusters are mag, mag, mag. The achieved limiting magnitudes correspond to the mass detection limit of 0.1 , which is similar to the mass detection limit of extensive observations of embedded clusters in the solar neighborhood with smaller (2–4 m class) telescopes. Therefore, we can compare the disk fractions in the low-metallicity environment to those in the solar neighborhood on the same basis for the first time.
3 IDENTIFICATION OF CLUSTER MEMBERS
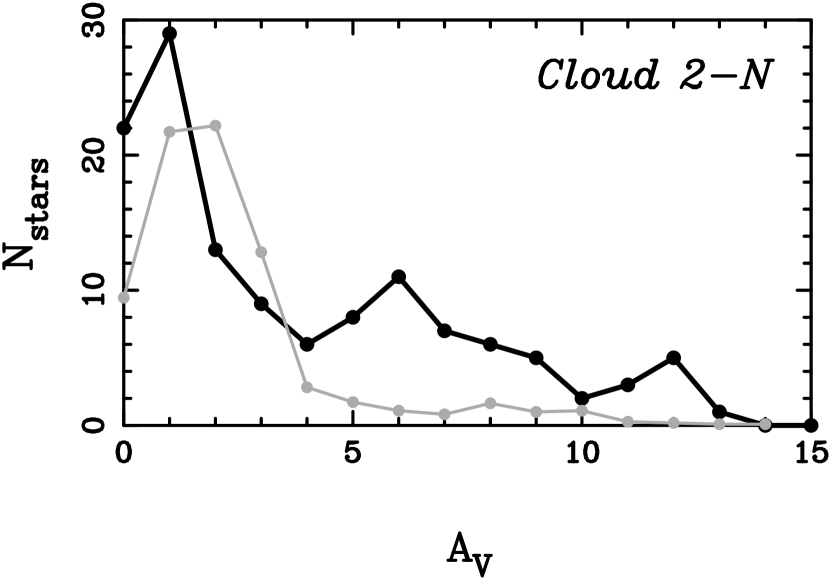
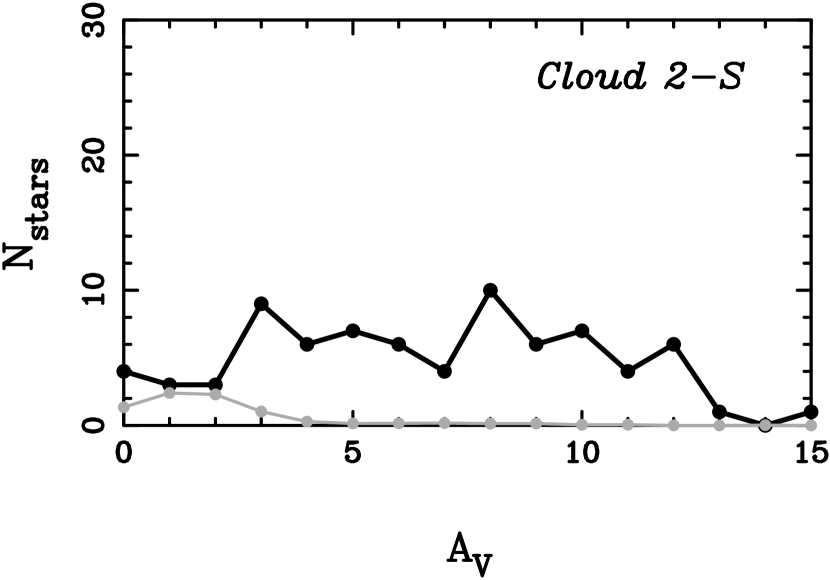
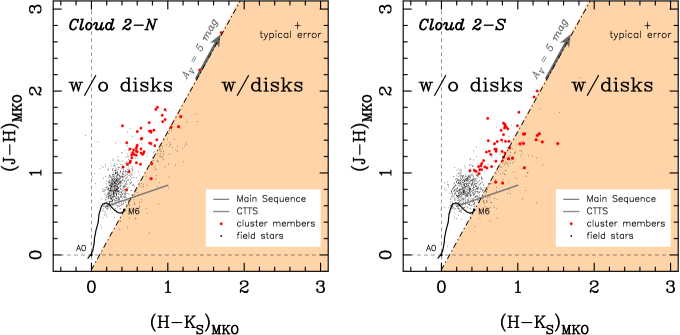
Because the Cloud 2 clusters are located behind the Cloud 2 molecular cloud (Yasui et al., 2006), the cluster members can be clearly identified as extinct red sources behind the CO dense cores on the sky (see Fig. 1; see also Fig. 1 in Kobayashi et al. 2008). We identified cluster members of the Cloud 2-N and 2-S clusters with the following criteria: (1) distributed in regions of the Cloud 2 clusters, which are defined by the yellow box and circle in Fig. 1, and (2) large excess compared to normal field stars (extinction of ; see Fig. 2). On the color-magnitude diagram they are located in the region apart from the region of normal field stars because the Cloud 2 clusters are located at the peak of the Cloud 2 molecular cloud core (Kobayashi et al. 2008; Yasui et al. 2008) and reddened by the large extinction. We confirmed that stars with mag are concentrated on the cluster fields, while stars with mag are widely distributed over the observed field. In Fig. 2 the identified cluster members in the cluster regions are shown with red circles while all the sources outside the cluster regions (3.54′ region around each cluster) are shown with black dots. As a result, we identified 52 and 59 cluster members for the Cloud 2-N and 2-S clusters, respectively, with the 10 limiting magnitude (red circles in Fig. 2) in both and bands.
Considering the very large of the Cloud 2 clusters ( kpc), contamination of background stars is negligible and most of the field objects are foreground stars (some are background galaxies). To quantify the contamination by foreground stars, we compared the distributions of all the sources in the cluster regions and the field objects outside the cluster regions (Fig. 3). Because the number of field objects decreases significantly at mag, most cluster members can be distinguished from the field objects as red sources with mag. The contamination by the foreground stars are estimated by counting the field objects in the tail of the distribution at mag and divide it with the total number of the sources in the cluster regions: 20 % and 2 % for the Cloud 2-N and 2-S clusters, respectively. Note that the contamination is very small for the S cluster because of the smaller area of the cluster region. Although there must be some cluster members at that missed our identification, the number of such sources should not be significant in view of the geometry of the molecular clouds, which are in front of the clusters (Yasui et al. 2006, 2008).
4 DISK FRACTION
We derived disk fractions of the Cloud 2 clusters using a J-H vs. H-K color-color diagram for the identified cluster members (Fig. 4). Stars with circumstellar dust disks are known to show a large color excess (Lada & Adams, 1992). On the color-color diagram, stars without circumstellar disks are seen as main-sequence stars reddened with extinction, while stars with circumstellar disks are seen in “the disk excess region” (to the right of the dot-dashed line in (Fig. 4) because of thermal emission from hot dust disk with a temperature of 1000–1500 K. For the Cloud 2-N and 2-S clusters, the disk fractions are 94 % and 277 % , respectively, where the ratio of stars with excess to the total number of stars is given in parentheses. The uncertainty of the disk fractions is estimated only from the Poisson errors because photometric errors are quite small with the median errors of 0.06 mag for () and () (Liu et al., 2003). Given the possible systematic uncertainty, we cannot say at this stage if the difference between the disk fractions of the Cloud 2-N and 2-S is significant. Because the above-discussed contamination from the foreground objects of mag may decrease the disk fraction, the actual disk fractions could be higher than the derived values here. However, the amount of the increase is estimated as 2.2 % and 0.5 % for the Cloud 2-N and -S clusters, respectively, when reducing the total number of the identified cluster members (52 and 59 for the N and S clusters, respectively) by the estimated number of contaminated foreground objects (10 and 1 for the N and S clusters, respectively). Because this maximum possible increase of the disk fraction is well within the large Poisson uncertainty (4 % and 7 % for the Cloud 2-N and 2-S clusters, respectively), we conclude that the effect of the background contamination on the disk fraction is small. In addition, in the case where we assume that all stars in the cluster regions are cluster members, the disk fractions for the Cloud 2-N and 2-S cluster become 6 % (5/89) and 21 % (16/78), respectively. Even in this extreme case, the amounts of the decrease ( % for the Cloud 2-N cluster and % for the 2-S cluster) are again within the Poisson errors.
To confirm the negligible effect of the photometric errors, we estimated disk fractions of two extreme cases: one case is that () and () colors of all stars were systematically changed within the photometric uncertainties of each source to get the lowest disk fraction and the other case to get the highest disk fraction. Assuming a Gaussian distribution of the photometric errors, the probability that the color of a star is within the 1 offset is 68 % and the probability that the color of a star is redder than the 1 offset is about 16 % (). Because the Cloud 2 clusters have about 50 members, the probability that all stars have redder colors than the 1 offset is , which is essentially zero. If we assume that the probability distribution of disk fraction is Gaussian, the estimated disk fraction of the extreme case (probability 0.1650) should have a probability less than the 3 sigma case (0.1 %). In the above extreme case (all the sources have or redder colors), we found that the disk fraction increases from 9 % to 19 % (N cluster) and from 27 % to 44 % (S cluster). Since such an extreme case only occurs with a probability of , much less than a 3 sigma occurrence, we consider that the 1 photometric uncertainty must be much less than 3 % () and 6 % () for the Cloud 2-N and 2-S clusters, respectively, which is smaller than the Poisson errors.
In view of the low-metallicity environment of the EOG, there might be some fundamental differences between the clusters in the solar neighborhood and in the EOG, such as the reddening and the stellar mass distributions, that may require different treatments of the disk fraction estimation. In our earlier paper, we confirmed that the reddening vector as well as the main-sequence track on the color-color diagram does not change with metallicity down to the metallicity of the Cloud 2 (Yasui et al. 2008, section 4). Also, the stellar mass distributions of the Cloud clusters are suggested to follow the universal IMF, which is widely observed in the solar neighborhood (Yasui et al. 2006, 2008). Therefore, we conclude that the use of the same division of with/without disk as for the solar neighborhood is appropriate. As for the treatment of the different filter systems, see Yasui et al. (2008) for the detail.
5 DISK FRACTION OF THE NEARBY EMBEDDED CLUSTERS
We derived the disk fraction of various embedded clusters in the solar neighborhood using the photometry data in the literature (Table 1 and Fig. 5). We chose publications with the following criteria: i) photometry data of cluster members are available in order to estimate disk fractions in the same way as for our data, ii) the mass detection limit is 1 (Haisch et al., 2001a), iii) all data in each embedded cluster are estimated in the same filter system. For all clusters we used the classical dwarf track in the Johnson-Glass system (Bessel & Brett, 1988) and a reddening vector in the Arizona system (Rieke & Lebofsky, 1985). disk fractions were estimated in the same way as for the Cloud 2 clusters: the border line, which determines whether a star has a disk or doesn’t have a disk, passes through the point of M6 type stars in the dwarf track on the color-color diagram.
Recent disk fraction studies often use data because thermal infrared ( m) can trace the colder (thus, outer) disk, and disk fractions from data are thought to be a more robust signature of the circumstellar disk than those only from data (Haisch et al., 2001a). However, disk fractions from only data are about 0.6 of those from data with slightly more scatter on the disk fraction-age plot, and the estimated disk lifetime from data is basically identical to that from data. Therefore, despite a little larger uncertainty, the disk fraction from only data should still be effective even without thermal IR data. Since the detection sensitivity in the thermal infrared is still not enough for the distant clusters like those in the EOG, we can make use of the high detection sensitivity at wavelengths to estimate the disk lifetime for the EOG clusters.
6 DISCUSSION
6.1 Disk Fraction in Low-metallicity Environment
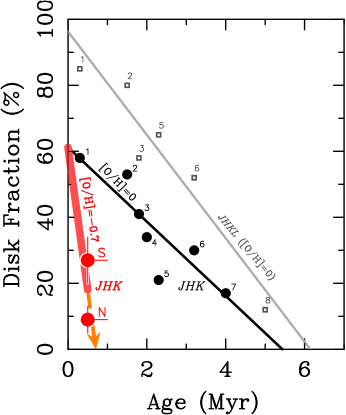
We show the disk fractions of the Cloud 2 clusters, as well as of the derived disk fraction of seven embedded clusters in the solar neighborhood, in the disk fraction-age diagram (Fig. 5; see 5). The disk fractions of the Cloud 2-N and 2-S clusters are significantly lower than nearby embedded clusters of similar age. As discussed in Section 4, the contamination from the foreground objects and the possible unidentified cluster members have only a small effect on the estimated disk fraction. Although the difference between the filter system for our data (MKO) and the data in the literature might cause some systematic offset for the disk fraction value, we confirmed that the disk fraction does not depend on the choice of the filter system by confirming that the disk fraction of a good reference cluster (NGC 2024 cluster) is identical for both CIT and MKO systems (see Appendix A).
Given the importance of the age of the clusters to the above conclusion, here we discuss the uncertainties of the age and the age spread of the clusters. Considering the IMF derived from -band luminosity function (KLF), the age of the Cloud 2 clusters should be less than 2 Myr: the KLF fitting shows an unrealistic top-heavy IMF with the age of 2 Myr (Yasui et al., 2006, 2008). Therefore, we conservatively estimate that the age upper-limit of the Cloud 2 clusters is 1 Myr. Moreover, the suggested supernovae triggered star formation of the Cloud 2 clusters (Kobayashi et al., 2008) suggests the age of 0.4 Myr, which strongly supports the above estimate from the KLF. Because there is no spectroscopic study of the cluster members, there is no observed age spread information as for the nearby clusters as in e.g., Palla & Stahler (2000). Because the mean age of this cluster is estimated as 0.5 Myr, the age spread should be smaller down to 0.5 Myr as assumed in the young cluster model in Muench et al. (2000). Muench et al. (2002) estimated the age of the Trapezium cluster at 0.80.6 Myr. Palla & Stahler (2000) actually obtained smaller age spread for the youngest embedded clusters (rho Oph, ONC). Moreover, in the above triggered star formation picture (Kobayashi et al. 2008), the age spread of the Cloud 2 clusters should be small because of the single triggering mechanism at a certain time. Therefore, we conclude that the most likely age of the clusters is 0.5 Myr and no more than 1 Myr. Even if we consider the possible age range, the estimated disk fractions are still quite low compared with those in the solar neighborhood.
Although the Cloud 2 clusters appear to be quite close on the sky, they are totally independent clusters with a projected distance of 25 pc at the heliocentric distance of kpc (Yasui et al., 2008). If they were located at the same heliocentric distance as the Orion dark cloud ( pc), the angular separation between the clusters becomes , which is larger than between two independent clusters, e.g., NGC 2024 and NGC 2071 clusters, listed in the previous study of disk fraction (Lada, 1999). Because the measured disk fractions for two independent clusters were similarly low, the disk fractions of embedded clusters in the low-metallicity environment are inferred to be universally low, at least in the EOG. In combination with the fact that there are no very young (1 Myr) embedded clusters of solar metallicity whose disk fractions are this low, our results strongly suggest that disk fraction depends strongly on metallicity.
6.2 Why Lower Disk Fraction with Lower Metallicity?
The most simple interpretations of the low disk fraction are that the disk is optically thin either because of the collisional agglomeration of dust grains in the disk (Andrews & Williams, 2005) or because of the low dust-to-gas ratio due to the low metallicity. However, the former is unlikely because the probability of dust collision, which is proportional to the square of dust density, should be rather low in the low-metallicity environment. The latter is also unlikely because the inner disk should be optically thick even with a metallicity of dex: opacity of the disk with the wavelength of 2 m ( [Hz]) at 0.1 AU is estimated to be 105, assuming a minimum mass solar nebula (surface gas density of 5104 gcm2 at 0.1 AU) (Hayashi, 1981) and a standard power-law opacity coefficient (15; cm2 g-1) (Beckwith et al., 1990), and considering the dust-to-gas ratio of 0.001 (Ruffle et al., 2007), which is 1/10 smaller than in the solar metallicity. If we assume that the typical disk-to-star mass ratio (0.01; e.g., Andrews & Williams 2005, Natta et al. 2006), we would expect the total disk mass of for the lowest-mass stars in our sample ( ). Because this is roughly one-tenth that of the minimum mass solar nebulae (0.01–0.02 ), we still expect a very large optical thickness of at K-band, assuming that disk mass measured in the submm correlates directly with surface density in the inner regions. This assumption is used for disks in the solar metallicity environment (e.g., Andrews & Williams, 2005). Even if we assume the lowest observed disk-to-star mass ratio in the nearby star forming regions (; Andrews & Williams 2005), the expected optical thickness is still . Model spectral energy distributions with various disk mass do not show a significantly different color excess (less than 0.05 mag) even if the amount of dust disks decreased to (Wood et al., 2002), which correspond to the dust-to-gas ratio of 0.001 in the EOG. Therefore, we conclude that the small disk fraction implies that the inner region of the disk is cleared out.
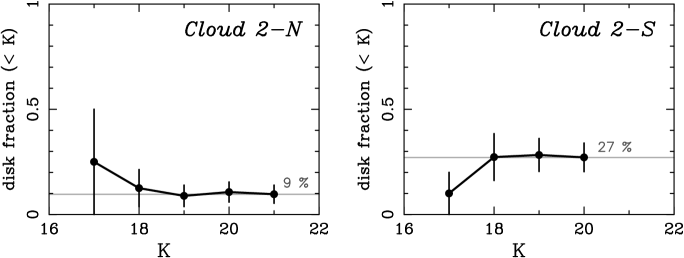
Note that optically thickness does not necessarily mean the existence of observable excess for lowest-mass stars with low effective temperature (3000 K) and with very low disk mass of – (e.g., Ercolano et al., 2009). Because the lowest mass stars of our samples (0.1 ) are M6-type stars with an effective temperature () of 3000 K (see e.g., Fig. 7 bottom figure in Lada & Lada, 2003), it may be inevitable that some lowest-mass stars in our sample do not have detectable excess simply because of the less dust content under low-metallicity, thus contributing to the low disk fraction artificially. To investigate this effect, we made a plot of the disk fraction of the Cloud 2 clusters for all sources brighter than certain -band magnitudes (Fig. 6). It is clearly seen that the disk fractions stay almost flat at the low level and do not decrease even including the M stars of the faintest magnitudes () that may lower the disk fraction as described above. Therefore, we conclude that the disk fraction is genuinely low for all sources down to the mass detection limit and that clearing out of the inner region of the disk is the reason for it. For the above arguments, we note two related studies. One is the detailed disk fraction study of the Trapezium cluster by Lada et al. (2004), who show that even for the latest M-type stars (e.g., M9-type stars, 0.02 , K at 1 Myr) has detectable excess and the disk fraction does not change even including the stars of this low-mass. In view of the youth of the Cloud 2 clusters (0.5 Myr) that is similar to the Trapezium cluster, we would naively expect similar detectable K-band excess even for the lowest mass stars in our sample (0.1 , M6-type stars) with K even with the low metallicity. Also, in the simulation by Wood et al. (2002), a detectable excess is seen even with very small disk mass of under solar metallicity (which corresponds to with the metallicity of Cloud2), assuming a central source with 0.6 and K.
Why does the inner region of the disk becomes cleared out effectively with lower metallicity? There are two well-known mechanisms that can clear the inner disk: dust sublimation (Millan-Gabet et al., 2007) and the X-wind model (Shu et al., 1994). In the following, we discuss if these mechanisms can effectively work with lower metallicity. i) Dust sublimation: Since dust sublimation typically occurs around 1500 K, the very inner part of the disk with 1500 K becomes dust-free. The dust sublimation radius, , is described approximately as , where is stellar luminosity, (1500 K) is disk temperature at inner disk radius (), and is the Stefan-Boltzmann constant (Dullemond et al., 2007). However, because the inner disk is expected to be optically thick even with the low metallicity of dex, the temperature distribution inside the disk for dex should not differ from that for the solar metallicity (0 dex). Therefore, is not expected to be significantly larger in the lower-metallicity environment. ii) X-wind model: Due to the interaction between the stellar magnetic field with the accretion disk, the gas disk is thought to be truncated at an inner radius of (Shu et al., 2000), where is the star’s mass, is the disk accretion rate, is magnetic dipole moment, is a dimensionless number of order unity, and is the gravitational constant. Among these parameters determining , only the disk accretion rate, depends on metallicity. The magnetorotational instability (MRI), which is the most likely cause for disk accretion (Hartmann, 2009), largely depends on the ionization of the gas disk by Galactic cosmic rays (Gammie, 1996), X-rays from the central young star (Igea & Glassgold, 1999), and thermal ionization (Sano et al., 2000). In a low-metallicity environment, we can expect that the ionization fraction increases and that the dead zone, which is the MRI inactive region of the disk (Gammie 1996), shrinks because the recombination on grain surfaces is reduced. As a result, increases and decreases. In fact, Sano et al. (2000) suggested that the dead zone shrinks in the case that the dust sedimentation of dust grain proceeds, which mimics the case in the low-metallicity. On the other hand, low-metallicity also means fewer molecular ions, which would reduce the ionization fraction (e.g., Sano et al., 2000), and thus would reduce . Which process dominates in the low metallicity environment has not been determined conclusively since the combination of many physical processes determine the size of the dead zone (e.g, Fromang, Terquem, & Balbus 2002). However, the former process, thus larger , may dominate (T. Sano, T. Suzuki, F. Shu, private communication).
Although further theoretical studies are necessary to have a firm conclusion, we would naively expect that is not significantly larger in a lower-metallicity environment, and it appears that there is no theoretical reason to suspect that lower metallicity would make disks less detectable through the H-K excess. The lower dust level would still result in an optically thick inner edge and the size of the cleared out inner region should not change significantly with the metallicity. Therefore, our observations can simply be interpreted that the inner disk (gas and dust) is mostly absent in Cloud 2-N and 2-S.
6.3 Short Disk Lifetime in a Low-metallicity Environment
The above arguments lead to the suggestion that the initial disk fraction (age 0 in Fig. 5) in the low-metallicity environment of our targets is expected to be as high as that for the solar metallicity case, assuming that the distribution of initial disk properties is exactly the same regardless of metallicity. Although this assumption is not obvious and more detailed observations of the disks in the extreme outer Galaxy are needed, it is not an unreasonable assumption because the star formation process from gas to stars do not seem to significantly change for the metallicity of the Cloud 2 clusters, for example, in view of the universal IMF throughout various physical/chemical environments (e.g., Elmegreen et al. 2008, see Omukai et al. 2000 for theoretical study). Therefore, we suggest that the significant decrease of the disk fraction in Fig. 5 is a result of the much shorter lifetime (1 Myr) of the inner disk in the low-metallicity environment compared to that in the solar metallicity environment, 5–6 Myr from disk fraction ( 5, Lada, 1999). This can be expressed with the rapid decrease of the disk fraction as shown with the red thick line in Fig. 5.
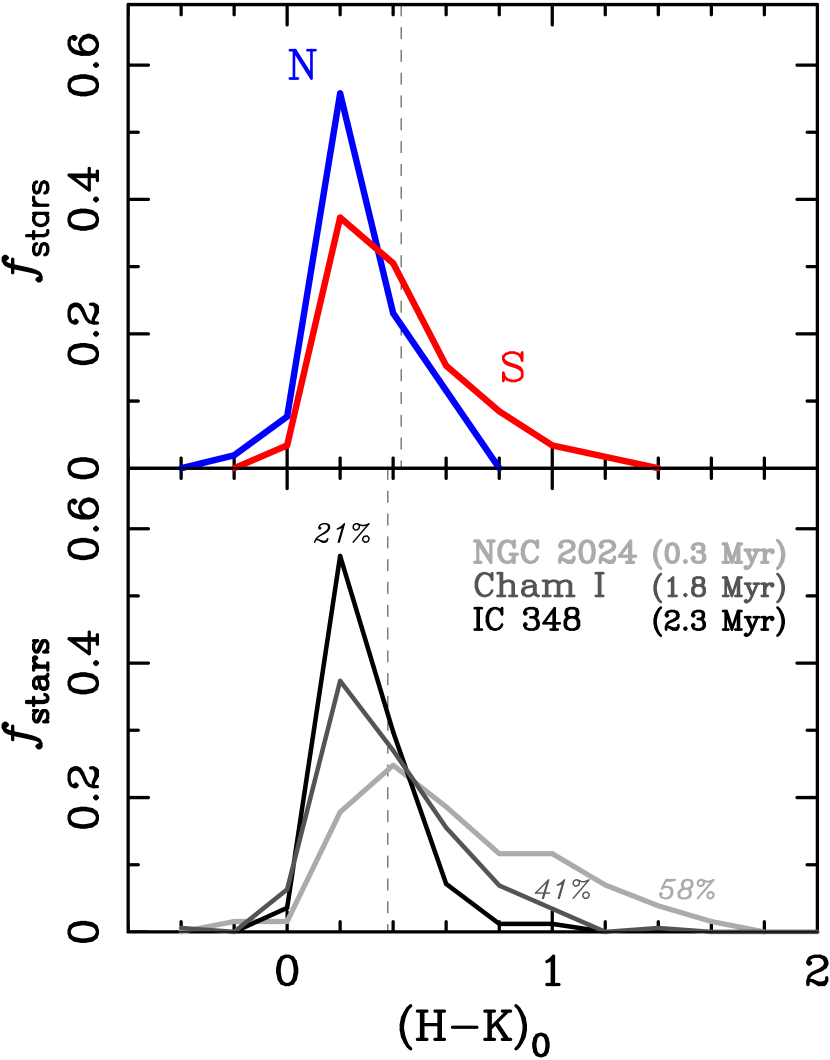
We know that the entire circumstellar disk, both the inner and outer disks, dissipates almost simultaneously in the solar metallicity environment because the submillimeter detection fraction and the fraction of objects with a NIR excess are identical (Andrews & Williams, 2005), and also because the observed fraction of transition objects, between the Class II and Class III states, is very low (Duvert et al., 2000). Therefore, we suggest that the entire disk dispersal is also rapid in the low-metallicity environment. The distributions of (HK) excess in the Cloud 2 clusters, which are consistent with those of more evolved (5 Myr) embedded clusters with solar metallicity, also support the above idea, though other mechanisms might cause the formation of the similar distributions. We constructed intrinsic color distributions (Fig. 7) for Cloud 2 clusters and nearby embedded clusters (Table 1). The intrinsic colors of each star were estimated by dereddening along the reddening vector to the young star locus in the color-color diagram (see Fig. 4). For convenience the young star locus was approximated by the extension of the CTTS locus (gray lines in Fig. 4), and only stars that are above the CTTS locus were used. For the Cloud 2 clusters (Fig. 7, top), the CTTS locus in the MKO system (Yasui et al., 2008) was used, while for the nearby clusters (Fig. 7, bottom), the original CTTS locus in the CIT system (Meyer et al., 1997) was used. To make the figure clearer, we show the color distributions for only NGC 2024 (Haisch et al., 2000), Taurus (Kenyon & Hartmann, 1995), and IC 348 (Haisch et al., 2001b), which have significantly different disk fractions. It is clearly seen that the distribution becomes bluer and sharper with lower disk fractions. The distributions of the Cloud 2 clusters resemble that of IC 348, whose disk fraction is as low as the Cloud 2 clusters (20 %).
6.4 Physical Mechanism for the Rapid Disk Dispersal in a Low-metallicity Environment
As the mechanism of disk dispersal, two possibilities are known : (i) disk accretion (Hartmann et al., 1998), and (ii) photoevaporation of the surface layer of the gas disk due to extreme-ultraviolet (EUV) radiation from the central star and/or the external radiation field (Hollenbach et al., 2000). In the low metallicity environment, both possibilities may work effectively. First, the disk accretion rate may increase in the low-metallicity as discussed in 6.2, if the increase of the ionization fraction due to less dust is larger than the decrease of the ionization fraction due to less molecular ions. This could be the reason for the rapid disk dispersal. Secondly, the photoevaporation process may also work effectively to shorten the disk lifetime. Because the EUV photoevaporation is solely based on the Strömgren condition of the hydrogen gas, metallicity (or dust-to-gas ratio) should not affect the rate of the photoevaporation mass-loss. However, the recent theoretical work (Gorti & Hollenbach, 2009) shows that far-ultraviolet (FUV) or X-ray radiation is more effective than EUV to photoevaporate the disk. Because FUV penetration strongly depends on the amount of dust in the disk, they found that the disk lifetime decreases with the dust opacity. Although the dust opacity dependence of the disk lifetime is not strong (factor of 2 changes with the dust opacity change of 10), they noted that the results are still in a preliminary stage and has to wait further detailed modeling. Therefore, this could be also the reason for the rapid disk dispersal in low-metallicity. In addition, something specific to the EOG environment might be the reason (see e.g., Haywood, 2008), but obviously further studies are necessary to pin down the physics of this phenomena.
6.5 Implication to the Planet-metallicity Correlation
If the lifetimes of disks at the solar metallicity () and at the low-metallicity () are approximated as 5 Myr and 1 Myr, respectively, our results suggest that the disk lifetime strongly depends on the metallicity (Z [M/H]) with a dependence. Because the disk lifetime () is directly connected to the planet formation probability (ppl), the strong metallicity dependence of may create a similarly strong metallicity dependence of ppl. Therefore, the disk dispersal could be one of the major driving mechanisms for the planet-metallicity correlation, which shows a strong sharp () metallicity dependence (Fischer et al. 2005). In the current standard core nucleated accretion model of the giant planet formation (e.g., see a review by Lissauer & Stevenson, 2007), the planet formation time scale is determined both by the core growth time and the gas accretion time onto the core. Since the first study by Safronov (1969), core growth time in the giant planet zone has been thought to be far longer than the observed . But, after the discovery that is less than 10 Myr, it is widely accepted that giant planet cores must form via rapid runaway growth (Wetherill & Stewart, 1989) and oligarchic growth (Kokubo & Ida, 1998), which can grow the cores for the giant planet (5–10 ) at the outer disk (5 AU) in a reasonable time, e.g, 10 Myr. Because this growth time is comparable to , the variation of due to the metallicity around this timescale may cause a strong metallicity dependence of the planet formation probability, , thus contributing to the planet-metallicity correlation.
As far as we know, a deterministic model based on the core-accretion model by Ida & Lin (2004) is the only study that quantitatively estimates the effect of variation on . They show that the planet formation probability decreases with decreasing (see their Fig.2 (b)). However, the amount of decrease is only a factor of 2–4 with a factor of 10 change in the disk lifetime: the dependence is more like and is not a strong function of . If this is the case, our suggestion that means the disk dispersal can contribute to the planet-metallicity correlation by a factor of . Ida & Lin (2004) show that the core-accretion model can qualitatively explain the planet-metallicity relation, but also note that the suggested metallicity dependence is not as strong as the observed relation: it is more like dependence judging from their Fig. 2 (b). Therefore, by adding the contribution from the disk dispersal (), most of the observed metallicity dependence of the planet formation probability () can be reasonably explained. However, a quantitative argument is difficult at this stage because there are ambiguities and complexities in the planet formation models, and thus the planet-formation time scale. Note that other groups are trying to reproduce the steep metallicity dependence by introducing a critical solid mass (Wyatt et al., 2007; Matsuo et al., 2007) for the core accretion model.
While the planet-metallicity correlation appears to be clear in Fischer’s systematic work (Fischer et al., 2005), Udry & Santos suggest that the correlation in low-metallicity range ([Fe/H] ) may be relatively weak (Udry & Santos, 2007). Santos suggests that the planet formation mechanism could be different for the two metallicity ranges: core-accretion for the high-metallicity range and disk instability for the low-metallicity range (Santos, 2008). Because our results seem to qualitatively explain a significant part of the 102Z dependence of the planet-metallicity relation, we assume that the dependence also holds true in the low-metallicity range ([Fe/H] 0), where we made our observations. However, the core-accretion model may not be able to explain the existence of planets around the low-metallicity stars with such short disk lifetime.
7 Summary
We present deep imaging of two low-metallicity star forming regions in the EOG, Digel Cloud 2-N and Cloud 2-S.
-
1.
The fraction of young stars with disks is found to be 94 % for Cloud 2-N and 277 % for Cloud 2-S. Previous works have shown that the age of these clusters is only approximately 0.5 Myr, and therefore the disk fraction is much lower than expected compared to the disk fraction measured for nearby star forming regions.
-
2.
Various possibilities for the reason for the low disk fraction are investigated. We suggest that the simple reduction of the dust-to-gas ratio cannot explain the low disk fraction and that the initial disk fraction should be as high as in the solar neighborhood. We also suggest that dust sublimation and stellar magnetic activity cannot explain the enlargement of the inner disk hole in the low-metallicity environment. Therefore, the significant decrease of the disk fraction implies that the disk lifetime is much shorter (1 Myr) than in the solar neighborhood (5–6 Myr). We suggest that the short disk lifetime is a result of the photoevaporation of the surface layer of the gas disk.
-
3.
We suggest that the lower disk lifetime with lower metallicity may be a major factor in explaining the planet-metallicity correlation. But this is model-dependent and further theoretical and observational work is needed.
Although we derived disk fractions for two very young clusters in this paper, it is necessary to study more embedded clusters in the EOG to find a more quantitative relationship between the disk lifetime and the metallicity. It is also important to study the disks in longer wavelengths, e.g., -band and mid-infrared wavelength, to confirm if disks at larger radii also disappear rapidly, as suggested. These results will be a strong constraint for interpreting the planet-metallicity correlation, and ultimately for understanding how many planet-harboring stars we can expect in the Galaxy (Lineweaver et al., 2004).
Appendix A Comparison of Disk Fractions in Different Filter Systems for the NGC 2024 Cluster
NGC 2024 is a good reference target for the comparison of disk fractions in different filter systems because it is a very young (0.3 Myr) embedded cluster in the solar neighborhood (Meyer et al., 1997) with a high disk fraction (Lada, 1999). The data were obtained on 1 January 2007 (based on data collected at the Subaru Telescope and obtained from the SMOKA, which is operated by the Astronomy Data Center, National Astronomical Observatory of Japan) with a field of view of centered on . The NGC 2024 data were reduced using the same procedures as the Cloud 2 data. For the photometry, we used only stars that are sufficiently isolated with an aperture radius of (95 % energy). For the photometric calibration, we used five stars in the field, whose photometric quality in 2MASS is good, after converting 2MASS magnitudes to MKO magnitudes.
Disk fractions can change in different mass ranges and in different spatial regions on the sky even when observed in the same filter system. The disk fraction estimated with stars, which are in the same region on the sky as the MOIRCS data and in almost the same mass range of 0.7–0.02 from a previous study in the CIT system (Levine et al., 2006), was 5517 % (10/18), which is consistent with the MOIRCS data (6516 %, 17/26) within the errors. Moreover, almost all stars in the disk excess region in the CIT color-color diagram are located in the same excess region in the MKO color-color diagram. This is true also for the stars in the non-disk excess region. Therefore, we conclude that the disk fraction of NGC 2024 is correctly estimated in the MKO system.
References
- Andrews & Williams (2005) Andrews, S. M., & Williams, J. P. 2005, ApJ, 631, 1134
- Arnault et al. (1988) Arnault, P., Knuth, D., Casoli, F., & Combes, F. 1988, A&A, 205, 41
- Balbus & Hawley (2000) Balbus, S. A., & Hawley, J. F. 2000, Space Science Reviews, 92, 39
- Beckwith et al. (1990) Beckwith, S. V. W., Sargent, A. I., Chini, R. S., & Guesten, R. 1990, AJ, 99, 924
- Bensby et al. (2005) Bensby, T., Feltzing, S., Lundström, I., & Ilyin, I. 2005, A&A, 433, 185
- Bessel & Brett (1988) Bessell, M. S. & Brett, J. M. 1988, PASP, 100 1134
- Bouvier et al. (2007) Bouvier, J., Alencar, S. H. P., Harries, T. J., Johns-Krull, C. M., & Romanova, M. M. 2007, Protostars and Planets V, 479
- Carpenter (2001) Carpenter, J. M. 2001, AJ, 121, 2851
- D’Antona & Mazzitelli (1997) D’Antona, F., & Mazzitelli, I. 1997, Memorie della Societa Astronomica Italiana, 68, 807
- D’Antona & Mazzitelli (1998) D’Antona, F., & Mazzitelli, I. 1998, ASP Conf. Ser. 134: Brown Dwarfs and Extrasolar Planets, 134, 442
- Digel et al. (1994) Digel, S., de Geus E. J., & Thaddeus, P. 1994, ApJ, 422, 92.
- Dullemond et al. (2007) Dullemond, C. P., Hollenbach, D., Kamp, I., & D’Alessio, P. 2007, Protostars and Planets V, 555
- Duvert et al. (2000) Duvert, G., Guilloteau, S., Ménard, F., Simon, M., & Dutrey, A. 2000, A&A, 355, 165
- Elmegreen et al. (2008) Elmegreen, B. G., Klessen, R. S., & Wilson, C. D. 2008, ApJ, 681, 365
- Ercolano et al. (2009) Ercolano, B., Clarke, C. J., & Robitaille, T. P. 2009, MNRAS, 394, L141
- Ferguson et al. (1998) Ferguson, A. M. N., Gallagher, J. S., & Wyse, R. F. G. 1998, AJ, 116, 673
- Fischer et al. (2005) Fischer, Debra A., & Valenti, Jeff. 2005. ApJ. 622. 110
- Fromang et al. (2002) Fromang, S., Terquem, C., & Balbus, S. A. 2002, MNRAS, 329, 18
- Gammie (1996) Gammie, C. F. 1996, ApJ, 457, 355
- Gonzalez (1997) Gonzalez, G. 1997, MNRAS, 285, 403
- Gorti & Hollenbach (2009) Gorti, U., & Hollenbach, D. 2009, ApJ, 690, 1539
- Haisch et al. (2000) Haisch, K. E., Jr., Lada, E. A., & Lada, C. J. 2000, AJ, 120, 1396
- Haisch et al. (2001a) Haisch, K. E., Jr., Lada, E. A., & Lada, C. J. 2001a, ApJ, 553, L153
- Haisch et al. (2001b) Haisch, K. E., Jr., Lada, E. A., & Lada, C. J. 2001b, AJ, 121, 2065
- Hartmann et al. (1998) Hartmann, L., Calvet, N., Gullbring, E., & D’Alessio, P. 1998, ApJ, 495, 385
- Hartmann (2009) Hartmann, L. 2009, Accretion Processes in Star Formation, 2nd edition, by Lee Hartmann. Cambridge, UK: Cambridge University Press, 2009. ISBN-13: 9780521531993,
- Hayashi (1981) Hayashi, C. 1981, Progress of Theoretical Physics Supplement, 70, 35
- Haywood (2008) Haywood, M. 2008, A&A, 482, 673
- Hernández et al. (2007) Hernández, J., et al. 2007, ApJ, 662, 1067
- Hillenbrand (2005) Hillenbrand, L. A. 2005, ArXiv Astrophysics e-prints, arXiv:astro-ph/0511083
- Hollenbach et al. (2000) Hollenbach, D. J., Yorke, H. W., & Johnstone, D. 2000, Protostars and Planets IV, 401
- Horner et al. (1997) Horner, D. J., Lada, E. A., & Lada, C. J. 1997, AJ, 113, 1788
- Ichikawa et al. (2006) Ichikawa, T., et al. 2006, Proc. SPIE, 6269
- Ida & Lin (2004) Ida, S., & Lin, D. N. C. 2004, ApJ, 616, 567
- Igea & Glassgold (1999) Igea, J., & Glassgold, A. E. 1999, ApJ, 518, 848
- Kenyon & Hartmann (1987) Kenyon, S. J., & Hartmann, L. 1987, ApJ, 323, 714
- Kenyon & Hartmann (1995) Kenyon, S. J., & Hartmann, L. 1995, ApJS, 101, 117
- Kobayashi et al. (2008) Kobayashi, N., Yasui, C., Tokunaga, A. T., & Saito, M. 2008, ApJ, 683, 178
- Kokubo & Ida (1998) Kokubo, E., & Ida, S. 1998, Icarus, 131, 171
- Lada & Adams (1992) Lada, C. J., & Adams, F. C. 1992, ApJ, 393, 278
- Lada & Lada (2003) Lada, C. J., & Lada, E. A. 2003, ARA&A, 41, 57
- Lada et al. (2004) Lada, C. J., Muench, A. A., Lada, E. A., & Alves, J. F. 2004, AJ, 128, 1254
- Lada et al. (1993) Lada, C. J., Young, E. T., & Greene, T. P. 1993, ApJ, 408, 471
- Lada (1999) Lada, E. A. 1999. Lada, C.J. & Kylafis, N.D. eds. 1999, The Origin of Stars and Planetary Systems pp. 441-78
- Leggett et al. (2006) Leggett, S. K., et al. 2006, MNRAS, 373, 781
- Levine et al. (2006) Levine, J. L., Steinhauer, A., Elston, R. J., & Lada, E. A. 2006, ApJ, 646, 1215
- Lineweaver et al. (2004) Lineweaver, C. H., Fenner, Y., & Gibson, B. K. 2004, Science, 303, 59
- Lissauer & Stevenson (2007) Lissauer, J. J., & Stevenson, D. J. 2007, Protostars and Planets V, 591
- Liu et al. (2003) Liu, M. C., Najita, J., & Tokunaga, A. T. 2003, ApJ, 585, 372
- Lubowich et al. (2004) Lubowich, D. A., Brammer, G., Roberts, H.,Millar, T. J., Henkel, C., & Pasachoff, J. M. 2004, in Origin and Evolution of the Elements, ed. A. McWilliam, & M. Rauch (Carnegie Observ. 4; Cambridge: Cambridge Univ. Press), 37
- Luhman (2004) Luhman, K. L. 2004, ApJ, 602, 816
- Maercker & Burton (2005) Maercker, M., & Burton, M. G. 2005, A&A, 438, 66
- Maercker et al. (2006) Maercker, M., Burton, M. G., & Wright, C. M. 2006, A&A, 450, 253
- Matsuo et al. (2007) Matsuo, T., Shibai, H., Ootsubo, T., & Tamura, M. 2007, ApJ, 662, 1282
- Meyer et al. (1997) Meyer, M. R., Calvet, N., & Hillenbrand, L. A. 1997, AJ, 114, 288
- Millan-Gabet et al. (2007) Millan-Gabet, R., Malbet, F., Akeson, R., Leinert, C., Monnier, J., & Waters, R. 2007, Protostars and Planets V, 539
- Muench et al. (2002) Muench, A. A., Lada, E. A., Lada, C. J., & Alves, J. 2002, ApJ, 573, 366
- Natta et al. (2006) Natta, A., Testi, L., & Randich, S. 2006, A&A, 452, 245
- Omukai (2000) Omukai, K. 2000, ApJ, 534, 809
- Palla & Stahler (2000) Palla, F., & Stahler, S. W. 2000, ApJ, 540, 255
- Rebull et al. (2002) Rebull, L. M., et al. 2002, AJ, 123, 1528
- Rieke & Lebofsky (1985) Rieke, G. H., & Lebofsky, M. J. 1985, ApJ, 288, 618
- Rudolph et al. (2006) Rudolph, A. L., Fich, M., Bell, G. R., Norsen, T., Simpson, J. P., Haas, M. R., & Erickson, E. F. 2006, ApJS, 162, 346
- Ruffle et al. (2007) Ruffle, P. M. E., Millar, T. J., Roberts, H., Lubowich, D. A., Henkel, C., Pasachoff, J. M., & Brammer, G. 2007, ApJ, 671, 1766
- Safronov (1969) Safronov V. S. (1969) in 1972 English translation: NASA TTF-677, Nauka Press. Mowcow.
- Sano et al. (2000) Sano, T., Miyama, S. M., Umebayashi, T., & Nakano, T. 2000, ApJ, 543, 486
- Santos et al. (2003) Santos, N. C., Israelian, G., Mayor, M., Rebolo, R., & Udry, S. 2003, A&A, 398, 363
- Santos (2008) Santos, N. C. 2008, New Astronomy Review, 52, 154
- Shu et al. (1994) Shu, F., Najita, J., Ostriker, E., Wilkin, F., Ruden, S., & Lizano, S. 1994, ApJ, 429, 781
- Shu et al. (2000) Shu, F. H., Najita, J. R., Shang, H., & Li, Z.-Y. 2000, Protostars and Planets IV, 789
- Sicilia-Aguilar et al. (2005) Sicilia-Aguilar, A., Hartmann, L. W., Hernández, J., Briceño, C., & Calvet, N. 2005, AJ, 130, 188
- Sicilia-Aguilar et al. (2006) Sicilia-Aguilar, A., et al. 2006, ApJ, 638, 897
- Tokunaga et al. (2002) Tokunaga, A. T., Simons, D. A., & Vacca, W. D. 2002, PASP, 114, 180
- Udry & Santos (2007) Udry, S., & Santos, N. C. 2007, ARA&A, 45, 397
- Wetherill & Stewart (1989) Wetherill, G. W., & Stewart, G. R. 1989, Icarus, 77, 330
- Wood et al. (2002) Wood, K., Lada, C. J., Bjorkman, J. E., Kenyon, S. J., Whitney, B., & Wolff, M. J. 2002, ApJ, 567, 1183
- Wyatt et al. (2007) Wyatt, M. C., Clarke, C. J., & Greaves, J. S. 2007, MNRAS, 380, 1737
- Yasui et al. (2006) Yasui, C., Kobayashi, N., Tokunaga, A. T., Terada, H., & Saito, M. 2006, ApJ, 649, 753
- Yasui et al. (2008) Yasui, C., Kobayashi, N., Tokunaga, A. T., Terada, H., & Saito, M. 2008, ApJ, 674, 443
| ID | Cluster | AgeaaReferences for the ages are shown in the parenthesis. | disk fraction | MassbbMass detection limit of the data. | Filter systemccThe photometric system of the data obtained with the Simultaneous Quad Infrared Imaging Device (SQUIID) at Kitt Peak National Observatory is similar to the Johnson system and the CIT systems (Lada et al., 1993; Horner et al., 1997) | ReferenceddReferences for the photometric data. For Trapezium, only the Fred Lawrence Whipple Observatory (FLWO) data were used to match the mass detection limit (see Muench et al., 2002). A filter was used instead of filter for the observation of Tr 37. |
|---|---|---|---|---|---|---|
| (Myr) | (%) | () | ||||
| 1 | NGC 2024 | 0.3 (1) | 587 | 0.13 | SQUIID | 2 |
| 2 | Trapezium | 1.5 (3) | 533 | 0.03 | SQUIID | 4 |
| 3 | Cham I | 1.8 (3) | 414 | 0.03 | CIT | 5 |
| 4 | Taurus | 2.3 (3) | 346 | 0.3 | SQUIID | 6 |
| 5 | IC 348 | 2.3 (3) | 214 | 0.19 | SQUIID | 7 |
| 6 | NGC 2264 | 3.3 (3) | 303 | 0.3 | SQUIID | 8 |
| 7 | Tr 37 | 4.0 (9) | 173 | 0.3 | 2MASS | 9 |