A QSO host galaxy and its Ly emission at z=6.4300footnotemark: 0††thanks: Based on data collected at Subaru Telescope, which is operated by the National Astronomical Observatory of Japan.
Abstract
Host galaxies of highest redshift QSOs are of interest; they provide us with a valuable opportunity to investigate physics relevant to the starburst-AGN connection at the earliest epoch of the Universe, with the most luminous black holes.
Here we report an optical detection of an extended structure around a QSO at z=6.43 in deep and -band images of the Subaru/Suprime-Cam. Our target is CFHQSJ2329-0301 (z=6.43), the highest redshift QSO currently known. We have carefully subtracted a PSF constructed using nearby stars from the images. After the PSF (QSO) subtraction, a structure in the -band extends more than 4” on the sky (=11 kpc), and thus, is well-resolved (16 detection). The PSF-subtracted -band structure is in a similar shape to that in the -band, but less significant with a 3 detection. In the -band, a radial profile of the QSO+host shows a clear excess over that of the averaged PSF in 0.8-3” radius.
Since the -band includes a Ly emission at z=6.43, we suggest the flux is a mixture of the host (continuum light) and its Ly emission, whereas the -band flux is from the host. Through a SED modeling, we estimate 40% of the PSF-subtracted -band light is from the host (continuum) and 60% is from Ly emission. The absolute magnitude of the host is =-23.9 (c.f. =-26.4 for the QSO). A lower limit of the SFR(Ly) is 1.6 yr-1 with stellar mass ranging 6.2 to 1.1 when 100 Myrs of age is assumed. The detection shows that a luminous QSO is already harbored by a large, star-forming galaxy in the early Universe only after 840 Myr after the big bang. The host may be a forming giant galaxy, co-evolving with a super massive black hole.
keywords:
quasars:individual, cosmology:early universe, black hole physics, galaxies: high-redshift1 Introduction
There have been accumulating evidence that galaxies and active galactic nuclei (AGN) co-exist. Evidence of starburst features have been detected in numerous AGNs (Maiolino et al., 1997; Cid Fernandes et al., 2005). Half of the ultraluminous infrared galaxies contain simultaneously an AGN and starburst activity (Genzel et al., 1998; Goto, 2005). Post-starburst signatures have been found in AGNs (Brotherton et al., 1999; Dewangan et al., 2000; Goto, 2006). The discovery of tight correlation between black hole mass and bulge velocity dispersion provides another evidence that the formation of bulge and the central black hole may be closely linked (Magorrian et al., 1998; Ferrarese & Merritt, 2000; Gebhardt et al., 2000; Granato et al., 2001; Heckman et al., 2004; Onken et al., 2004).The correlation implied the co-evolution of a super-massive black hole and its host galaxy. To understand galaxy formation theory and the AGN mechanisms, it is important to characterize a possible relationship between the galaxy formation and AGNs.
At high luminosity end of the AGN, QSOs are not exception; At low redshift, QSOs are predominantly hosted by luminous, massive, bulge dominated galaxies (Hamilton, Casertano, & Turnshek, 2002; Dunlop et al., 2003; Pagani, Falomo, & Treves, 2003; Floyd et al., 2004), irrespective of radio power. At high redshift, evolution of the QSO host has been reported; Schramm, Wisotzki, & Jahnke (2008) found hosts with stellar populations indicating recent massive star formation at . Aretxaga, Boyle, & Terlevich (1995); Aretxaga, Terlevich, & Boyle (1998) found SFR of 100-200M for z2 QSO hosts. Villforth, Heidt, & Nilsson (2008) also found moderate rate of SFR for QSO hosts at z=0.87 and 2.85. Hutchings et al. (2002, 2006) found that high redshift QSO host galaxies are irregular and highly disturbed. Hutchings (2005) reported a significant young stellar population with a possible spiral structure in two hosts at z=5. However also note that some luminous QSOs are reported to reside in luminous massive early-type galaxies at (Kotilainen et al., 2007), and at (Falomo et al., 2008). The host galaxies of radio-quiet QSOs are on average less luminous than the ones of radio-loud QSOs (e.g., Kukula et al., 2001; Kotilainen et al., 2007). The apparent co-evolution of QSO and host galaxies leads to the question if QSO activity and star-formation are caused by the same physical mechanism, or one triggers the other.
Although a proper investigation of high-z QSO hosts would shed light on the QSO-galaxy co-evolution, QSO host galaxies at highest redshifts of have not yet been studied extensively, since due to high QSO-to-host light ratios, extremely deep, high resolution images are required to assure a sufficiently high signal-to-noise ratio. A pioneering attempt by Hutchings (2005) did not resolve host galaxies of QSOs at z=6.23 and z=6.35.
In this paper, we investigate a host galaxy of a QSO at z=6.43 using deep optical images taken with the Suprime-Cam/Subaru equipped with new red-sensitive CCDs. This is the highest redshift QSO as of the date of writing, and thus, provides us with an unprecedented opportunity to shed light on the co-evolution of galaxy and QSO at the massive end of super massive black holes with , at the earliest epoch when the age of the Universe was only 840 Myrs old.
Unless otherwise stated, we adopt the WMAP cosmology: (Komatsu et al., 2008).
| Object | RA | DEC | z | ||||
|---|---|---|---|---|---|---|---|
| CFHQS J232908-030158 | 23:29:08.28 | -03:01:58.8 | 6.43 | 25.08 | 21.760.05 | 21.560.25 | -26.4 |
| Filter | FWHM (pix) | ellipticity | |
|---|---|---|---|
| (=768nm) | 2.45 (=0.49”) | 0.04 | |
| (=911nm) | 2.25 (=0.45”) | 0.06 | |
| (=988nm) | 2.69 (=0.54”) | 0.07 |
| Object | |||
|---|---|---|---|
| QSO+host | 25.540.02 | 21.165 0.003 | 21.6830.007 |
| Host | 25.34 (1 limit) | 23.50.3 (16) | 24.30.2 (3) |
| 1 sky | 25.44 (26 pix diameter) | 24.90 (26 pix diameter) | 25.46 (18 pix diameter) |
2 Observation
Our target is CFHQSJ2329-0301, which is a QSO at z=6.43 (Willott et al., 2007). Characteristics of the target is summarized in Table 1. Assuming Eddington luminosity, its black hole mass is estimated to be 1.0 (Fan et al., 2001).
Observations were carried out on August 1, 26, and 27, 2008 with the Suprime-Cam (Miyazaki et al., 2002), on which new red sensitive CCDs have been just installed (Utsumi et al. in prep.). The sensitivity of the new CCDs is 1.3 times better in -band, and 1.9 times better in -band (=988 nm). The data were originally taken to investigate the QSO environment, which will be presented elsewhere (Utsumi et al. in prep.). Since the observation was partly for an engineering purpose to test the new CCDs, we used various exposure times with 360s 10 in , 100sec 7, 300sec 2, 400sec 3, 500sec 6, 700sec 2 in and 500sec 19 in . The dithering pattarns were mostly circular with separations of 0.5-2 arcmins. The total exposure time on the target was 3600 sec in , 6900 sec in , 9500 sec in -bands. We used a nearby field observed both by the SDSS and ourselves for a photometric calibration. A slight difference between the SDSS and the Subaru filters are compensated using the Gunn & Stryker (1983) stellar spectral library. The data are reduced using the modified version of the pipeline. The details of the reduction is described in Utsumi et al. (in prep.). The 2 limiting magnitudes are =26.73, =25.79, and =25.09 ABmag within 2” aperture. Here, 1 sky magnitudes are computed by randomly placing a 2”aperture in the blank (sky) part of the image (Yagi et al., 2002; Ouchi et al., 2004).
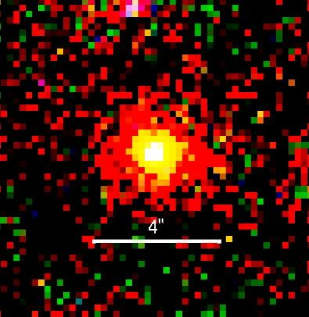
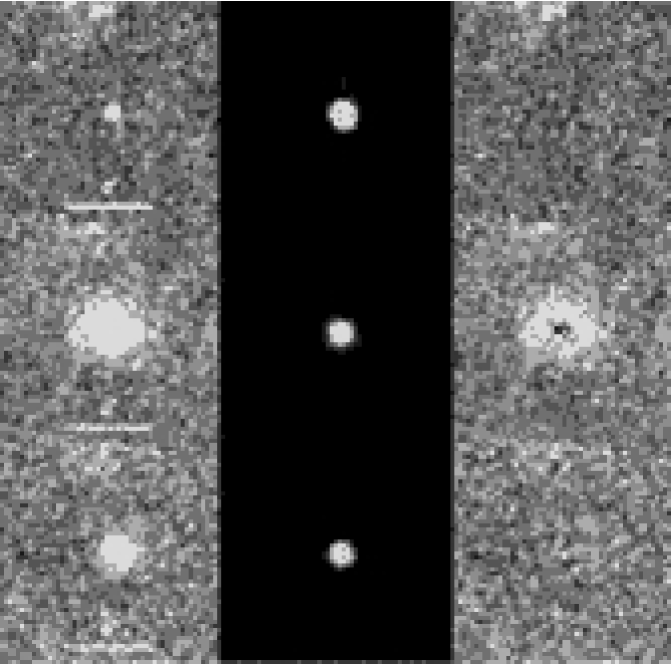
The pixel scale of the Suprime-Cam is 0.2”/pixel. The seeing size of the images are 0.5 arcsec (see Table2). An and composite image of the QSO is shown in Fig.1, where the RGB colors are assigned to and -bands, respectively. Without even subtracting the central PSF, it is immediately noted that the QSO has an extended structure in the -band (red in the composite).
3 Results
3.1 PSF subtraction
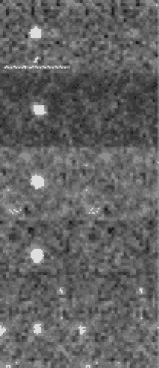
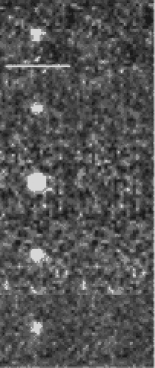
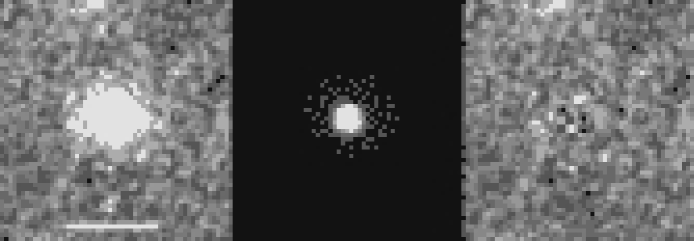
In this section, we subtract a PSF from the QSO image to investigate a possibly extended structure around the QSO. In this process, it is critical to carefully construct the PSF model using the observed data since at such a high redshift the PSF has to be known very precise to be able to see a marginally extended host galaxy. Using observed stars instead of analytical functions is especially important for -band where 0.5% of the flux is known to bleed in horizontal spikes due to the filter characteristics. In each band, we have carefully picked 20 nearby stars within 200” in the mosaic image to avoid a possible PSF variation across the image. These stars are picked to be relatively isolated, and ambiguous stars according to their radial profile. Stars blended with a nearby object are excluded from the selection. We have specifically picked stars as bright as, but not brighter than the QSO itself to avoid a possible non-linearity effect at the central pixels of bright stars. We have checked a choice of a different set of PSF stars does not affect results. Then we used DAOPHOT in iraf to construct an average PSF. The constructed PSF models in each band are shown in the middle panels of Fig.2. Basic properties of the PSF in each band are presented in Table 2.
Then we use galfit (Peng et al., 2002) to subtract the constructed PSFs from the QSO images shown in the left panels of Fig.2. At first, galfit was set to fit only the PSF and any remaining sky. The residuals are shown in the right panels of Fig.2. We discuss results from each band in the following subsections.
3.1.1 -band
In the band (the top panels), no flux is left on the residual image, i.e., the QSO is consistent with a PSF in the band. This is not surprising since bluewards of the Lyman break, little light from the host galaxy can escape from the heavy absorption by the neutral hydrogen.
3.1.2 -band
In the -band shown in the middle panels of the Fig.2, there clearly remains an extended structure, subtending 4” after the PSF subtraction. There is a little over-subtraction at the very centre, making the structure looks like a dough-nut shape perhaps because the PSF fit is affected by the extended structure. We have applied the same PSF subtraction to nearby stars for consistency check in Appendix A. None of the PSF fits to stars yielded such an extended structure in Appendix A. We performed an aperture photometry using a 13 pix (=2.6”) of radius on the structure. The measured magnitude is =23.50.3. We have computed a 1- of the sky by randomly placing the same size aperture on the blank regions of the image. The 1 sky noise is estimated to be 24.90 in band. Compared to the sky noise, the detection is 16, i.e., the structure is well-resolved, and detected.
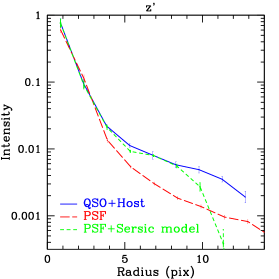
In addition to the PSF subtraction, in the left panel of Fig.3, we show -band radial profiles of QSO+host in the blue solid line, and of the constructed PSF in the red dashed line. The profiles are normalized to be unity at a maximum. The solid, dashed, and short-dashed lines connect median in each sample. The error bars denote the errors in determining the median at each radii. At above the radius of 4 pixel (0.8”), the figure shows that the QSO+host is clearly more extended than the PSF, showing the extended structure is well resolved.
We note that there may be a point-source like structure to the right of the residual image in the -band in the middle-right panel of Fig.2. However, this is not likely a contamination from a foreground star since the possible point-source is not detected in -band, and thus quite red. Instead, it is more likely to be a star-forming region/substructure associated with the QSO.
3.1.3 -band
In the band image in the bottom left panel of Fig.2, there may be a possible elongation from north-east to south-west, in a similar orientation to the extended structure in the -band. Although the residual image on the bottom-right panel is much less obvious than in the -band, there is a hint of remaining flux. We performed an aperture photometry with an optimal 18 pixel diameter, obtaining 24.30.2 mag of flux. The 1 sky noise measured by randomly placing the same size apertures on the blank regions of the image is 25.46 mag, i.e., the extended structure is at a 3 level. The errors on the PSF subtraction is 0.2 mag, and thus smaller. We also run the source extractor on the PSF subtracted image, detecting the host at a 2.6 level over the local background.
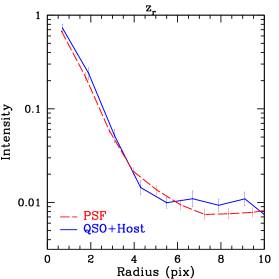
The radial profiles in the are shown in the right panel of Fig.3. Although the extended structure is less obvious, the QSO+host has a 1 excess over the PSF in three consecutive radii at 6-9 pixel.
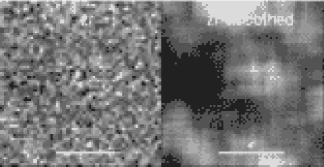
The extended structure becomes more visible in a 10-pix box-car smoothed image in Fig.4. For a sanity check, we fit the PSF to nearby stars in Appendix A, where we do not see any clear excess in the residuals even after box-car smoothed.
Because the Ly emission at z=6.43 is redshifted into the -band wavelength range, the extended structure in the -band could be an extended nebula of Ly emission (Ly blob) extensively searched at z3 (Matsuda et al., 2004; Saito et al., 2008). However, in this QSO image, the extended structure is also found in the -band where the Ly emission does not contaminate the flux. Therefore, it is more likely that at least some -flux stems from the host galaxy (continuum), and the -band flux is a mixture of host and its Ly emission. We estimate the relative strength of the flux of the host (continuum) and Ly emission in detail in Section 3.2.
3.2 SED, stellar mass, SFR
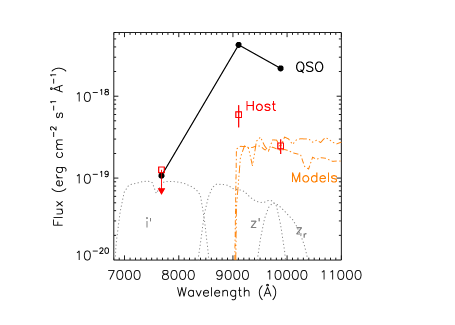
In Fig.5, we show the SED of the QSO (the black filled circles) and the host (the red rectangles). Since the host was not detected in the , 1 upper limits are shown at the effective wavelength. We computed the 1 of the sky noise by randomly placing an aperture of the same size on the blank region of the images, following the prescription by Yagi et al. (2002); Ouchi et al. (2004).
Overlaid are constant star-formation and delta burst models (Bruzual & Charlot, 2003) with the ages of 100Myrs scaled to the -band flux. Assumed are the Salpeter initial mass function, solar metallicity and no dust extinction. Flux bluewards the Ly emission is attenuated using the prescription given by Fan, Carilli, & Keating (2006). These models are often used to compute colors of Lyman break galaxies at 6.
Comparing the colors of the host to the galaxy models, one immediately notices that the -band flux is not consistent with the flat continuum of the SED models, regardless of the star formation history. Perhaps this is because the host galaxy has some Ly emission in the -band. In the past, Davies et al. (2008) detected extended line emission in high redshift galaxies on scales of 4kpc. Such extended Ly emission nebulae called Ly blobs have been extensively searched at 3 (Matsuda et al., 2004; Saito et al., 2008). A QSO BR1202-0725 has a Ly emitting companion, possibly ionized by the QSO (Hu, McMahon, & Egami, 1996; Ohyama, Taniguchi, & Shioya, 2004). A typical FWHM of Ly blobs is 300 km s-1 (Matsuda et al., 2004; Saito et al., 2008). If the Ly emission around the QSO is extended, it may be theoretically predicted infalling gas to form a galaxy, illuminated by a central QSO (Rees, 1988). If so, quantifying this will provide us with an important constraint on the formation of galaxies such as gas fraction, AGN geometry, and covering factors in the early Universe.
Both of the SED models show an almost flat continuum slope at this small wavelength range between and -bands. Thus scaling from the -bands flux and the SED models, in the -band, 2.510-19 erg cm-2 s-1 Å-1 flux is estimated to be the light from the continuum of the host galaxy. Subtracting this from the observed flux in the -band (6.010-19 erg cm-2 s-1 Å-1), 3.510-19 erg cm-2 s-1 Å-1 of flux is estimated to originate from Ly emission of the host galaxy, i.e., in the -band, the continuum to Ly flux ratio is 4:6.
If such flux came through the Ly emission of 300 km s-1, then the Ly luminosity would be 1.6 erg s-1, which are comparable luminosity to Ly emitters at 6 (Kashikawa et al., 2006; Ouchi et al., 2008) and Ly blobs at z=3.1(Matsuda et al., 2006).
Based on the Ly luminosity, we estimate the SFR(Ly) is 1.6 yr-1 (Kennicutt, 1998). However, the SFR estimated here are lower limits because significant fraction of bluer side of the Ly emission could be absorbed by the neutral hydrogen.
We can also estimate star formation rate of the host galaxy based on the UV luminosity using Kennicutt (1998). Since the UV continuum of the host is relatively bright =-23.9, we obtain SFR50 yr-1. It has been suggested that SFR derived from UV continuum is often larger than that from Ly, especially for Ly emitters (Hu et al., 2004; Ajiki et al., 2003; Kodaira et al., 2003), as is the case here. Even though, this is quite a large number compared to that obtained through Ly (1.6 yr-1), and thus, suggests the nature of the host galaxy; its UV continuum is brighter than typical Ly emitters. The host may be a massive galaxy that is decreasing its star formation activity.
In the literature, Jahnke et al. (2004) reported 2-30 yr-1 for z=1.8-2.6 QSO hosts. Villforth, Heidt, & Nilsson (2008) measured 0.03-33 yr-1 for QSO hosts at z=0.87 and z=2.75. The SFR estimated by UV light, however, is also subject to reddening uncertainties since a possible presence of dust has not been taken into account.
With the lack of infrared photometry, it is difficult to constrain age/stellar mass through the SED. However, in the literature, a very young age of 5-100 Myrs for high redshift galaxies at 57 has been reported (Egami et al., 2005; Lai et al., 2007). If we assume an age of 100 Myrs and scale models to -band flux, we obtain a stellar mass of 1.1 for the delta burst model, and 6.2 for the constant SFR model. Considering the age of the Universe is 840 Myrs, the host may be a forming massive galaxy, possibly co-evolving with the super massive black hole.
3.3 Sérsic fit
Since we have a clear detection of extended structure in the -band, we attempted to fit the -band image with a PSF+sérsic+sky model using the galfit. The -band image does not have enough signal-to-noise ratio to include Sérsic profile in the fit. Results are shown in Fig.6. The middle panel of Fig.6 shows the PSF+sérsic (PSF convolved) model, which is subtracted from the original image shown in the left panel. Some residual can be seen in the right panel, possibly implying an irregular morphology of the host, being consistent with Hutchings et al. (2006) who pointed out that high redshift QSO host galaxies are found to be irregular and highly disturbed. Measured sérsic parameters are =2.0”0.1, axis ratio of b/a=0.740.03, and , suggesting that the host possesses a flatter profile than the PSF, and even than de Vaucouleurs. In the left panel of Fig.3, we show the PSF+Sérsic model in the green short-dashed line. The PSF+Sérsic model in the short-dashed line is a good fit within 8 pixels of radius, although the model underestimates the profile significantly at 8 pixels of radius.
The extended structure has an effective radius of =2.0” according to the sérsic fit. Even in the image, one can easily recognize the light distribution beyond 13 pixel (=2.6”). At the distance of z=6.43, 2.0” corresponds to 11 kpc. As a reference, in the GOODS fields, a mean size of galaxies with 1-5 is 0.3” (2 kpc) in restframe 1500Å(Ferguson et al., 2004). In the UDF, a mean size of galaxies with 0.1-1.0 is 0.15” (1 kpc) in restframe 1600Å(Bouwens et al., 2004).
On the size of QSO hosts in the literature, Kukula et al. (2001), who observed in and , found a mean of 11.1 5.7 kpc for their sample. For their 1.5-2 sample they found a value of 9.78 6.58 kpc for objects where it could be determined and upper limits (10 kpc) for the remaining sources. Kotilainen et al. (2007) found values of 6.71.7 kpc for their 1-2 sample (observed in K and H). Falomo et al. (2008) found values between 2.6 kpc and 11.3 kpc for a sample of three high redshift QSOs ( 2-3) observed in Ks. Villforth, Heidt, & Nilsson (2008) found 1.5-3.9 kpc at z=0.9 and 1.5-3.9 kpc at z=2.8 in the FORS deep field.
However, direct interpretation of our results is difficult; in the last subsection we estimated that the -band flux is a mixture of 40% continuum light and 60%Ly emission. Therefore, this extension of 11 kpc scale can be either extended Ly emission or the extended stellar population of the host. Clear morphological separation of these two have to await high-resolution near-infrared imaging, or specially-resolved IFU spectroscopy in the red end of the optical CCD. A spectro-polarization is also important to constrain contribution from dust scattered light (Young et al. 2009, arxiv:0905.4102).
4 Discussion
In Section 3, we detected an extended light in the and -band, and suggested that this was the QSO host galaxy at z=6.43. However, it is always a possibility that the extended light could be from a foreground lensing galaxy, which also explains the bright magnitude of the QSO by lensing magnification. However, we believe it is not very likely in this case; using the 1 limit of 25.34, the color of the host is , which is very red and is hard to be explained unless the host has a break between and . One possibility is a Balmer break at z=1.25. However, the color of the Balmer break is bluer, at approximately 0.641.99 (Fukugita, Shimasaku, & Ichikawa, 1995). The size, absolute magnitude, nuclear-to-host flux ratio all do not seem to be unreasonable for the structure to be at z=6.43. In addition, no significant flux is detected at 6500Å8900Å in the GMOS spectrum with one hour of exposure time (Willott et al., 2007). Therefore, it is more plausible to consider the extended emission is from the host galaxy of the QSO at z=6.43.
We have estimated the host luminosity to be =-23.9, i.e., the QSO to host flux ratio in restframe UV is 8.8. This is a higher ratio compared to the previous work. Hutchings (2005) found nuclear-to-extended ratio of 2.3 in rest 2100Å. Guyon, Sanders, & Stockton (2006) report a flux ratio of 2.5 (note their pass-bands are in NIR). If the mass of the black hole is proportional to that of the host (Magorrian et al., 1998; Ivanov & Alonso-Herrero, 2003), and if the QSO emits at a fixed fraction of the Eddington luminosity, then one would expect a correlation between the luminosities of the host and QSO. However, a number of reason can explain the deviation; the host may be more actively star-forming at earlier epoch; the Eddington ratio may be different at z=6.43; the amount of nuclear obscuration may be different. Hutchings et al. (2006) reported a higher QSO-to-host flux ratio for more luminous QSOs among their sample. Since this is only one example based on the restframe UV photometry, it is important to obtain infrared photometry to accurately measure the stellar mass/ luminosity ratio of more hosts. High resolution spectroscopy is also important to examine relation at z6.
Comparing the morphology of the host to those in the literature, Hutchings (2003) resolved the host galaxies of 4 high redshift QSOs () and found heavily disturbed galaxies, partially showing signs of ongoing merging. Guyon, Sanders, & Stockton (2006) reported that 30% of PG QSO host galaxies showed obvious sign of disturbances, with strongly disturbed hosts favoring more luminous QSOs. In this work, there were some residuals after the host was fit with a sérsic profile in the right panel of Fig.6, suggesting a possible non-smooth morphology. Further morphological investigation, however, is difficult due to the limited depth and spatial resolution of our ground-based data. It is necessary to take high-resolution near-infrared AO or HST data to investigate the morphology of the host galaxy.
5 Summary
We have detected an extended structure around a QSO at z=6.43 in the and -band images of the Subaru/Suprime-Cam. The QSO is the highest redshift QSO currently known. After a careful PSF subtraction, the structure is detected at a 16 level in -band and at a 3 level in the -band. In the -band, the radial profile of the QSO+host shows clear excess at pix of radius over the carefully constructed PSF. There is a marginal excess in the -band profile at 6-10 pix of radius as well. Through the SED modeling, we estimate 40% of the PSF-subtracted -band light is from the host (continuum) and 60% is from Ly emission of the galaxy.
The host is a bright, large galaxy with =-23.9. Its extended structure has an effective radius of 11 kpc. The lower limit on the SFR(Ly) is 1.6 yr-1, the stellar mass of the host ranges from 6.2 to 1.1 depending on the star-formation history when 100 Myrs of age is assumed. Therefore, the host is a large, star-forming galaxy, with a moderate amount of stellar mass.
These results present an important example that indeed a super massive black hole resides in a large galaxy even in the early epoch when the Universe is 840 Myr old. Quantifying the host mass and fraction of ionized gas in more detail will provide us with an important constraint on how galaxies and AGN form in the early Universe, such as gas fraction, AGN geometry, and covering factors.
Acknowledgments
We thank the anonymous referee for many insightful comments, which significantly improved the paper.
T.G. acknowledges financial support from the Japan Society for the Promotion of Science (JSPS) through JSPS Research Fellowships for Young Scientists.
This work is supported in part with the research fund for students (2008) of the Department of Astronomical Science, the Graduate University for Advanced Studies, Japan.
This work is also supported with a Grant-in-Aid for Scientific Research on Priority Areas (18072003) from the Ministry of Education, Science, Culture, and Sports of Japan (MEXT).
The authors wish to recognize and acknowledge the very significant cultural role and reverence that the summit of Mauna Kea has always had within the indigenous Hawaiian community. We are most fortunate to have the opportunity to conduct observations from this sacred mountain.
References
- Ajiki et al. (2003) Ajiki M., et al., 2003, AJ, 126, 2091
- Aretxaga, Terlevich, & Boyle (1998) Aretxaga I., Terlevich R. J., Boyle B. J., 1998, MNRAS, 296, 643
- Aretxaga, Boyle, & Terlevich (1995) Aretxaga I., Boyle B. J., Terlevich R. J., 1995, MNRAS, 275, L27
- Bouwens et al. (2004) Bouwens R. J., Illingworth G. D., Blakeslee J. P., Broadhurst T. J., Franx M., 2004, ApJ, 611, L1
- Brotherton et al. (1999) Brotherton M.S., et al., 1999, ApJ, 520, L87
- Cid Fernandes et al. (2005) Cid Fernandes R., González Delgado R.M., Storchi-Bergmann T., Martins L.P., Schmitt H., 2005, MNRAS, 356, 270
- Bruzual & Charlot (2003) Bruzual G., Charlot S., 2003, MNRAS, 344, 1000
- Davies et al. (2008) Davies R., et al., 2008, Msngr, 131, 7
- Dewangan et al. (2000) Dewangan G.C., Singh K.P., Mayya Y.D., Anupama G.C., 2000, MNRAS, 318, 309
- Dunlop et al. (2003) Dunlop J. S., McLure R. J., Kukula M. J., Baum S. A., O’Dea C. P., Hughes D. H., 2003, MNRAS, 340, 1095
- Egami et al. (2005) Egami E., et al., 2005, ApJ, 618, L5
- Fan, Carilli, & Keating (2006) Fan X., Carilli C. L., Keating B., 2006, ARA&A, 44, 415
- Fan et al. (2001) Fan X., et al., 2001, AJ, 122, 2833
- Ferrarese & Merritt (2000) Ferrarese L., Merritt D., 2000, ApJ, 539, L9
- Floyd et al. (2004) Floyd D. J. E., Kukula M. J., Dunlop J. S., McLure R. J., Miller L., Percival W. J., Baum S. A., O’Dea C. P., 2004, MNRAS, 355, 196
- Gebhardt et al. (2000) Gebhardt K., et al., 2000, ApJ, 539, L13
- Falomo et al. (2008) Falomo R., Treves A., Kotilainen J. K., Scarpa R., Uslenghi M., 2008, ApJ, 673, 694
- Ferguson et al. (2004) Ferguson H. C., et al., 2004, ApJ, 600, L107
- Fukugita, Shimasaku, & Ichikawa (1995) Fukugita M., Shimasaku K., Ichikawa T., 1995, PASP, 107, 945
- Genzel et al. (1998) Genzel R., et al., 1998, ApJ, 498, 579
- Goto (2006) Goto T., 2006, MNRAS, 369, 1765
- Goto (2005) Goto T., 2005, MNRAS, 360, 322
- Granato et al. (2001) Granato G.L., Silva L., Monaco P., Panuzzo P., Salucci P., De Zotti G., Danese L., 2001, MNRAS, 324, 757
- Gunn & Stryker (1983) Gunn J. E., Stryker L. L., 1983, ApJS, 52, 121
- Guyon, Sanders, & Stockton (2006) Guyon O., Sanders D. B., Stockton A., 2006, ApJS, 166, 89
- Hamilton, Casertano, & Turnshek (2002) Hamilton T. S., Casertano S., Turnshek D. A., 2002, ApJ, 576, 61
- Heckman et al. (2004) Heckman T.M., Kauffmann G., Brinchmann J., Charlot S., Tremonti C., White S.D.M., 2004, ApJ, 613, 109
- Hu et al. (2004) Hu E. M., Cowie L. L., Capak P., McMahon R. G., Hayashino T., Komiyama Y., 2004, AJ, 127, 563
- Hu, McMahon, & Egami (1996) Hu E. M., McMahon R. G., Egami E., 1996, ApJ, 459, L53
- Hutchings et al. (2006) Hutchings J. B., Cherniawsky A., Cutri R. M., Nelson B. O., 2006, AJ, 131, 680
- Hutchings (2005) Hutchings J. B., 2005, PASP, 117, 1250
- Hutchings (2003) Hutchings J. B., 2003, AJ, 125, 1053
- Hutchings et al. (2002) Hutchings J. B., Frenette D., Hanisch R., Mo J., Dumont P. J., Redding D. C., Neff S. G., 2002, AJ, 123, 2936
- Kodaira et al. (2003) Kodaira K., et al., 2003, PASJ, 55, L17
- Ivanov & Alonso-Herrero (2003) Ivanov V. D., Alonso-Herrero A., 2003, Ap&SS, 284, 565
- Jahnke et al. (2004) Jahnke K., et al., 2004, ApJ, 614, 568
- Kashikawa et al. (2006) Kashikawa N., et al., 2006, ApJ, 648, 7
- Kennicutt (1998) Kennicutt R. C., Jr., 1998, ARA&A, 36, 189
- Komatsu et al. (2008) Komatsu E., et al., 2008, arXiv, arXiv:0803.0547
- Kotilainen et al. (2007) Kotilainen J. K., Falomo R., Labita M., Treves A., Uslenghi M., 2007, ApJ, 660, 1039
- Kukula et al. (2001) Kukula M. J., Dunlop J. S., McLure R. J., Miller L., Percival W. J., Baum S. A., O’Dea C. P., 2001, MNRAS, 326, 1533
- Lai et al. (2007) Lai K., Huang J.-S., Fazio G., Cowie L. L., Hu E. M., Kakazu Y., 2007, ApJ, 655, 704
- Magorrian et al. (1998) Magorrian J., et al., 1998, AJ, 115, 2285
- Matsuda et al. (2004) Matsuda Y., et al., 2004, AJ, 128, 569
- Matsuda et al. (2006) Matsuda Y., Yamada T., Hayashino T., Yamauchi R., Nakamura Y., 2006, ApJ, 640, L123
- Maiolino et al. (1997) Maiolino R., Ruiz M., Rieke G.H., Papadopoulos P., 1997, ApJ, 485, 552
- Miyazaki et al. (2002) Miyazaki S., et al., 2002, PASJ, 54, 833
- Ohyama, Taniguchi, & Shioya (2004) Ohyama Y., Taniguchi Y., Shioya Y., 2004, AJ, 128, 2704
- Onken et al. (2004) Onken C. A., Ferrarese L., Merritt D., Peterson B. M., Pogge R. W., Vestergaard M., Wandel A., 2004, ApJ, 615, 645
- Ouchi et al. (2004) Ouchi M., et al., 2004, ApJ, 611, 660
- Ouchi et al. (2008) Ouchi M., et al., 2008, ApJ submitted, arXiv, arXiv:0807.4174
- Pagani, Falomo, & Treves (2003) Pagani C., Falomo R., Treves A., 2003, ApJ, 596, 830
- Peng et al. (2002) Peng C. Y., Ho L. C., Impey C. D., Rix H.-W., 2002, AJ, 124, 266
- Rees (1988) Rees M. J., 1988, MNRAS, 231, 91P
- Saito et al. (2008) Saito T., Shimasaku K., Okamura S., Ouchi M., Akiyama M., Yoshida M., Ueda Y., 2008, ApJ, 675, 1076
- Schramm, Wisotzki, & Jahnke (2008) Schramm M., Wisotzki L., Jahnke K., 2008, A&A, 478, 311
- Villforth, Heidt, & Nilsson (2008) Villforth C., Heidt J., Nilsson K., 2008, A&A, 488, 133
- Willott et al. (2007) Willott C. J., et al., 2007, AJ, 134, 2435
- Yagi et al. (2002) Yagi M., Kashikawa N., Sekiguchi M., Doi M., Yasuda N., Shimasaku K., Okamura S., 2002, AJ, 123, 66
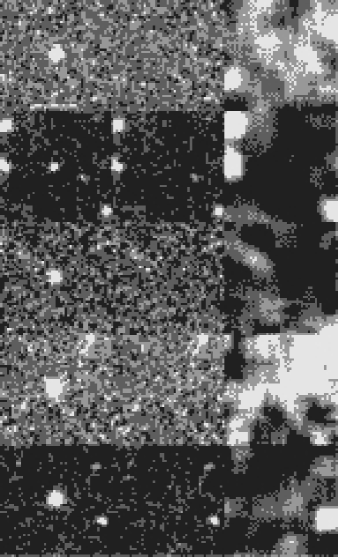
Appendix A PSF subtraction test
Fitting the constructed PSF (Sec. 3.1) to the observed stars around QSO provides a sanity check of the PSF subtraction. In this exercise, we first select stars within 200” around the QSO as objects with source extractor’s stellarity of . We have specifically picked stars as bright as, but not brighter than the QSO itself to avoid a possible non-linearity effect at the central pixels of bright stars. These are the stars used to construct a composite PSF in Section 3. In Fig.7, we show 5 images of stars (left panels) and PSF-subtracted images (right panels) in (left) and (right)-bands. Fig.8 shows the same PSF subtraction for -band, but the rightmost panels show 10-pixel box-car smoothed images of residuals (the middle panels) in the -band.
None of the residuals in Fig.7 shows an extended structure such as seen in the in the middle right panel of Fig.2. In the -band, no obvious residuals are seen even after the images are box-car smoothed (c.f. Fig.4). These sanity checks suggest that the extended structures found in Figs. 2 and 4 are not artifacts from the PSF subtraction.