Atlas of Vega: 3850 – 6860 ņ†thanks: Based on data collected with the 1.8-m telescope operated at BOAO Observatory, Korea
Abstract
We present a high resolving power (/ = 90,000) and high signal-to-noise ratio (700) spectral atlas of Vega covering the 3850 – 6860 Å wavelength range. The atlas is a result of averaging of spectra recorded with the aid of the echelle spectrograph BOES fed by the 1.8-m telescope at Bohyunsan observatory (Korea). The atlas is provided only in machine-readable form (electronic data file) and will be available in the SIMBAD database upon publication.
1 Introduction
Vega( Lyr = HD 172167 = HR 7001) has been the primary spectrophotometric standard for many years. The spectrum of Vega was investigated with high resolution and high signal-to-noise ratio (S/N) (Gulliver et al. (1991), Gulliver, Hill & Adelman (1994), Takeda (2007)). Ultra-high S/N (2500) reported in studies by Gulliver et al.(1991) allowed them to recognize flattened shapes of cores of weak lines caused by the fast and almost pole-on rotation of Vega (Gulliver et al., 1994). The later studies (e.g., Hill, Gulliver & Adelman (2004), Peterson et al. (2006)) ascertained details of the nature of Vega’s rotation: the the star is seen almost pole-on, which causes the flat-bottomed shape of profiles of weak lines.
The chemical composition of Vega has well-known peculiarities: the star demonstrates under-abundances in the majority of elements and, has been regarded as a Boo star (Adelman & Gulliver (1990), Lemke & Venn (1996), Ilijic et al. (1998)). This type of star is characterized by fast rotation, deficit of metals (Baschek & Slettebak, 1988) and slightly overabundant C, N and O elements. The phenomenon of Boo stars has been attributed toe accretion from the circumstellar disk (Venn & Lambert, 1990). However, the extensive dust ring disc around Vega (Aumann et al., 1984) has been observed in many wavelengths (e.g., Marsh et al., 2006). Waters et al. (1992) suggested that abundance anomalies in Vega are caused by selective accretion: grains in the circumstellar disc are accelerated outward by radiation pressure, so that only the gaseous part of the disc is accreted.
Several spectral atlases of Vega have been published: an atlas in the region 2000 to 3187 Å with resolution of 0.1 Å (Rogerson, 1989) and an atlas in the 4000–6350 Å range with signal-to-noise ratio of about 300 (Qiu et al., 1999). Gulliver & Adelman (1990) published an atlas of Vega with ultra-high signal-to-noise ( 2500). The most recent atlas was published by Takeda et al. (2007), who expanded the wavelength range of the high quality spectrum, providing detailed analysis of line profiles in the range 3900-8800 Å. However, the Takeda et al. atlas of Vega is not corrected for telluric lines, although a spectrum of a fast rotating star is given for a comparison. In some wavelength ranges, the Takeda et al. atlas demonstrates features of instrumental or reduction origin (see Fig. 1).
In this work, we present a high resolving power (90,000) and high S/N ratio (700) spectrum of Vega covering the wavelength region 3850 – 6860 Å.
The atlas is available in table form via the Internet. 111http://simbad.u-strasbg.fr
2 Observations and data reduction
The spectra of Vega were recorded in 2006 during observing runs at the Bohyunsan Observatory the aid of BOES, the fiber-fed echelle spectrograph (Kim et al., 2007) attached to the 1.8-m telescope. The spectrograph has 3 observational modes with three levels of resolving power: 30,000, 45,000 and 90,000. The spectrograph has a CCD camera equipped with a 40962048 pixels matrix (pixel size 15m15m) which allows us to cover in a single exposure the wavelength range 3700 Å – 10000 Å divided into 75-83 spectral orders without any gaps up to 9500 Å. Our spectra were recorded in the highest resolving power mode (R = 90,000) corresponding to the full width at the half maximum of the instrumental profile 2.5 pixels.
The collected spectra were reduced using standard software packages IRAF (Tody, 1993) and DECH (Galazutdinov, 1992). The latter was used for final stages of processing: removal of telluric lines, merging of spectra, wavelength scale correction, continuum normalization, measurements of equivalent widths, etc. IRAF was used for bias/background subtraction and one-dimensional spectra extraction. Inter-order stray light in BOES spectra is less than 2 percent of the intensities of the neighboring order (Kim et al., 2007). However, the IRAF task APALL (we used it for the extraction of one-dimensional spectra from echelle images) does not provides any control of background subtraction quality, therefore we used the APSCATTER task for careful background subtraction. Traces of cosmic ray hits were removed during a stage of combining of individual spectra using an algorithm based on a sigma-clipping method.
The sequence of reduction stages after spectra extraction and wavelength calibration was as follows:
-
Averaging of spectra recorded during the same night. Our spectra of Vega were acquired during 5 nights (Table 1). All spectra of every single night were averaged with sigma-clipping filtering of cosmic-ray events. All subsequent procedures were performed with these 5 spectra.
-
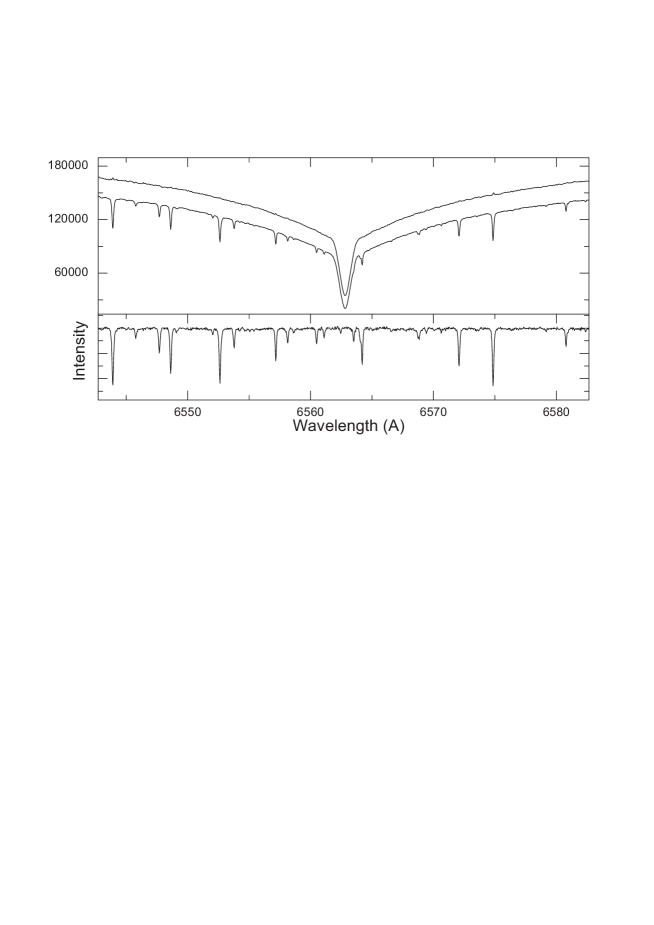
Removal of telluric lines in each individual echelle order. To eliminate telluric lines, we used the spectrum of Peg (a divisor) – a fast rotating early spectral type star without significant reddening, observed during the same nights as the Vega observations. Before the usage of the divisor, all stellar lines existing in its spectrum were removed using the pseudo-continuum (the curve, passing over all stellar lines). An example of the effect of removal of telluric lines is presented in Fig. 2
-
Shift of the wavelength scale of individual spectra to the laboratory system. This procedure is important for the next step, spectra averaging. We measured radial velocity of Hα in each single spectrum and, then by using this velocity value we calculated and applied the wavelength correction for each pixel of the spectrum. The Hα line profile is quite symmetric and occupies many pixels (in comparison to weaker lines of, e.g. Fei),which facilitates finding the center of gravity of the line, based on the method of matching direct and mirrored profiles, which we used. The quality of averaging of the spectra is demonstrated in Fig. 3.
-
Averaging and merging of all spectra. All spectral orders were merged. Then, all individual spectra were averaged.
-
Continuum normalization. The final spectrum was normalized by the fiducial continuum. However, in the region of very broad hydrogen lines the continuum level was adjusted with the help of the theoretical calculations (the synthetic spectrum) - i.e.. the resulting hydrogen line profiles are not completely observational.
We follow the tradition of showing iron lines around 4530 Å, started by Gulliver et al. in 1991 (see Fig. 4). However, our profiles are not smooth like Gulliver’s but rather demonstrate some pattern, which is also the case in the spectrum of Takeda et al.(2007; see their Fig.5).
3 Summary
In summary, we present a high resolution and high signal-to-noise ratio atlas of Vega. Data are downloadable in digital form. We hope that the atlas provides useful information for future studies.
4 Acknowledgements
GAG and IH acknowledge support by KICOS through the grant No. 07-179.
References
- Adelman & Gulliver, (1990) Adelman, S. J., & Gulliver, A. F., 1990, ApJ, 348, 712
- Aumann et al., (1984) Aumann, H. H., Beichman, C. A., Gillett, F. C., de Jong, T., Houck, J. R., Low, F. J., Neugebauer, G., Walker, R. G., & Wesselius, P. R., 1984, ApJ, 278, 23
- Baschek & Slettebak, (1988) Baschek, B., & Slettebak, A., 1988, A&A, 207, 112
- Galazutdinov, (1992) Galazutdinov G.A.. 1992, Preprint Spets. Astrophys. Obs., 92, 2
- Gulliver & Adelman, (1990) Gulliver, A. F., & Adelman, S. J., 1990, J. R. Atron. Soc. Can, 84, 6, 418
- Gulliver et al., (1991) Gulliver, Austin F., Adelman, Saul J., Cowley, C. R., & Fletcher, J. M., 1991, ApJ, 380, 223
- Gulliver et al., (1994) Gulliver, A. F., Hill, G., & Adelman, S. J., 1994, ApJ, 429, 81
- Hill et al., (2004) Hill, G., Gulliver, A. F., & Adelman, S. J., 2004, IAU Symposium No. 224 “The A-Star Puzzle”, held in Poprad, Slovakia; Cambridge, UK: Cambridge University Press, 35
- Ilijić et al., (1998) Ilijić, S., Rosandić, M., Dominis, D., Planinic, M., & Pavlovski, K., 1998, Coska, 27, 4671
- Kim et al., (2007) Kim K.M., Han I., Valyavin G., Plachinda S., Jang J.G., Jang B.H., Seong H.C., Kang D.I., Park B.G., Yoon T.S., & Vogt, S. S., 2007, PASP, 119, 1052
- Lemke & Venn, (1996) Lemke, M., & Venn, K. A., 1996, A&A, 309, 558
- Marsh et al., (2006) Marsh K. A., Dowell C. D., Velusamy T., Grogan K., & Beichman C. A., 2006, ApJ, 646, L77
- Peterson et al., (2006) Peterson D. M., Hummel C. A., Pauls, T. A., Armstrong, J. T., Benson, J. A., Gilbreath, G. C., Hindsley, R. B., Hutter, D. J., Johnston, K. J., Mozurkewich,D., & Schmitt, H. R., 2006, Nature, 440, 896
- Qiu et al., (1999) Qiu, H. M., Zhao, G., Chen, Y. Q., & Li, Z. W., 1999, Publ. Beijing Astron. Obs., 33, 34
- Rogerson, (1989) Rogerson, Jhon B., JR., 1989, ApJ, 71, 1011
- Takeda et al., (2007) Takeda, Y., Kawanomoto, S., & Ohishi, N., 2007, PASJ, 59, 245
- Tody, (1993) Tody, D. 1993, ”IRAF in the Nineties” in Astronomical Data Analysis Software and Systems II, A.S.P. Conference Ser., Vol 52, eds. R.J. Hanisch, R.J.V. Brissenden, & J. Barnes, 173
- Venn & Lambert, (1990) Venn, K. A., & Lambert, D. L., 1990, ApJ, 363, 234
- Waters et al., (1992) Waters, L. B. F. M., Trams, N. R., & Waelkens, C., 1992, A&A, 262, 37
| Date | Number | HJDa | S/N | ||
|---|---|---|---|---|---|
| of spectra | 4000 Å | 5500 Å | 6500 Å | ||
| 2006 Mar 30 | 10 | 2453824.2701 | 195 | 422 | 406 |
| 2006 Mar 31 | 28 | 2453825.3104 | 235 | 394 | 434 |
| 2006 Apr 16 | 21 | 2453841.2743 | 237 | 387 | 442 |
| 2006 Jun 11 | 15 | 2453897.1451 | 203 | 426 | 286 |
| 2006 Oct 03 | 10 | 2454011.9792 | 355 | 478 | 499 |
-
a
Heliocentric Julian date of middle of exposure