1\Yearpublication2010\Yearsubmission2009\Month07\Volume\Issue\DOI
later
Observational Evidence for Expansion in the SSS spectra of Novae
Abstract
For several novae, a bright X-ray source with a spectrum resembling the class of Super Soft X-ray Sources (SSS) has been observed a few weeks to months after outburst. Novae are powered by explosive nuclear burning on the surface of a white dwarf, and enough energy is produced to power a radiatively driven wind. Owing to the evolution of the opacity of the ejecta, the observable spectrum gradually shifts from optical to soft X-rays (SSS phase). It has sometimes been assumed that at the beginning of the SSS phase no more mass loss occurs. However, high-resolution X-ray spectra of some novae have shown highly blue-shifted absorption lines, indicating a significant expansion. In this paper, I show that all novae that have been observed with X-ray gratings during their SSS phase show significant blue shifts. I argue that all models that attempt to explain the X-ray bright SSS phase have to accommodate the continued expansion of the ejecta.
keywords:
novae, cataclysmic variables – stars: individual (V2491 Cyg) – stars: individual (RS Oph) – stars: individual (V4743 Sgr) — X-rays: stars1 Introduction
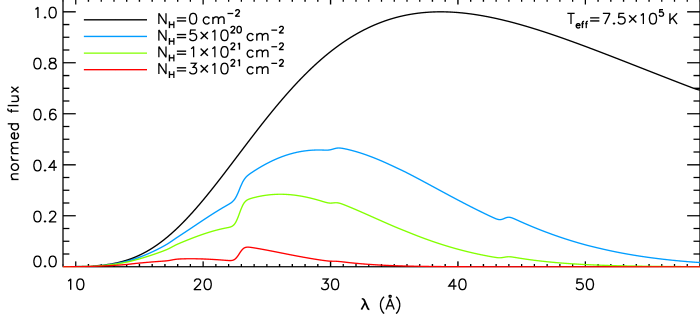
An X-ray source is classified as a Super Soft X-ray Source (SSS) if the X-ray spectrum resembles a blackbody continuum spectrum ([Planck 1901]), yielding an effective blackbody temperature of less than eV (several K, see, e.g., Kahabka & van den Heuvel 1997). The Wien tail of such a spectrum is rarely above 1 keV, while the Rayleigh-Jeans tail can not be observed, because the soft emission is absorbed by the interstellar medium. This is illustrated in Fig. 1, where a blackbody model is shown with no absorption (black) and after correction for interstellar absorption assuming three different values of neutral hydrogen column density, (colour-coded lines). The absorption model as implemented in the PintofAle program package, described by [Kashyap & Drake (2000)] has been used to compute the corrected spectra. One can see that observations of SSSs sample only a small fraction of the source emission, and the shape of the soft part of the spectrum is dominated by the ISM transmission function. This is one of the main challenges to observe SSSs in our own galaxy, which explains why many SSSs, including the two prototypes Cal 83 and Cal 87, are in the LMC, with less galactic foreground absorption. The downside of observing extragalactic SSSs is the larger distance, which dilutes the brightness.
Meanwhile, Classical Novae have been observed to undergo a phase of SSS emission when their X-ray spectra resemble those of the persistent SSSs. Since novae during the SSS phase are much brighter than persistent SSSs, they can be observed at larger distance and with better exposed spectra, yielding important clues about the properties of the emitting plasma.
Novae occur in close binary systems with an accreting white dwarf. After a history of quiet accretion, the point is reached that the accreted hydrogen-rich material can ignite in a thermonuclear runaway. Radiation pressure leads to the ejection of envelope material, forming an optically thick shell. The high-energy radiation produced by nuclear burning has to travel through this material via radiation transport. The resultant spectrum is thus an atmospheric spectrum that originates from the photosphere, and it consists of a blackbody-like continuum with absorption lines. As the mass loss rate decreases, the density of the outer layers decreases, and they become optically thin, thus allowing observations deeper into the outflow. The observed effective temperature thus depends on the radius of the photosphere that determines which regions are observable. As time progresses, successively hotter layers are exposed to observations, and the peak of the spectral energy distribution eventually reaches the X-ray regime.
As a first approach to interpret observed SSS spectra, blackbody models are routinely fitted, mainly for reasons that they are easy to do, and that they are quickly reproducible so the blackbody temperature can serve as a spectral classification criterion. However, the implied assumption of thermal equilibrium is not satisfied, and complex absorption processes are completely ignored. One can thus hardly consider a blackbody fit a suitable model, however, the low spectral resolution of less than 100 and low signal to noise of many available X-ray spectra do not allow us to find sensible constraints to more sophisticated models.
Krautter et al. (1996) derived a bolometric luminosity from blackbody fits that is up to 100 times the Eddington luminosity and argued that this is unphysically high. Atmosphere models assuming local thermodynamic equilibrium (LTE) have been applied by [Balman et al. (1998)], yielding a lower luminosity. However, the spectral resolution of the ROSAT observation of only at 0.93 keV is not sufficient to constrain any atmosphere model. For comparison, the spectral resolution of XMM-Newton/RGS is at 1 keV. It has further not been discussed whether the assumption of LTE is valid. For example, Hartmann & Heise (1997) showed that LTE and non-LTE models can produce very different model spectra where the temperature of the non-LTE model can be closer the blackbody temperature than that derived from the LTE model. [Rauch et al. (2005)] computed a non-LTE model for an X-ray grating spectrum of the nova V4743 Sgr during the SSS phase. Reasonable agreement with the grating spectrum was found, and temperature and elemental abundances were determined. However, the atmosphere model was that of a white dwarf with the plane-parallel approximation, and in order to match blue shifts of the absorption lines that had previously been reported by Ness et al. (2003), they assumed a high radial velocity of the entire system of 2400km s-1. [Petz et al. (2005)] developed a non-LTE model that accounts for expansion of the ejecta, thus modelling the line shifts in a self-consistent way. The radiation transport processes can be much different from those in a static, plane-parallel white dwarf atmosphere. The models by Petz et al. (2005) are currently being improved by Daan van Rossum. The purpose of this paper is to gather all observational evidence that justifies the need for such models.
2 Observations
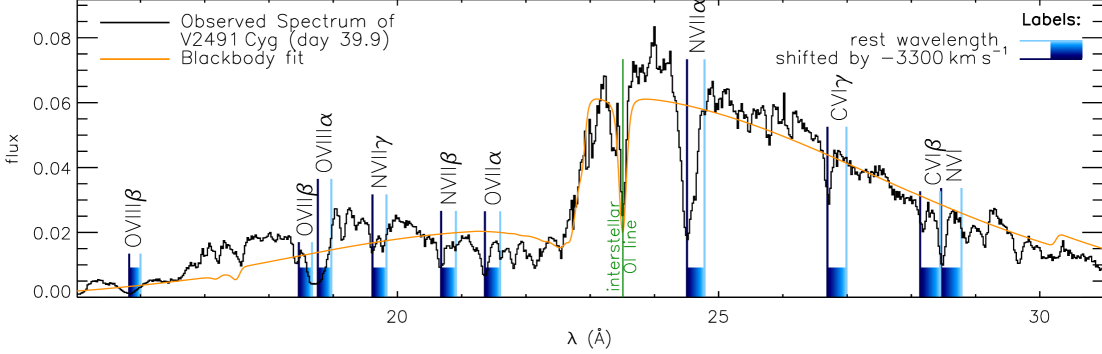
For this work grating observations of the galactic novae V4743 Sgr, RS Oph, and V2491 Cyg are used which have been presented by Ness et al. (2003), Ness et al. (2007), Ness et al. (2009), and Ness et al. in preparation, respectively. In Fig. 2, the XMM-Newton RGS spectrum of V2491 Cyg, taken on day 39.9 is shown as an example. In Table 1, the targets and observations are summarised, giving time of outburst and distance, instrument used for observations, time of the observations (in days after outburst), and exposure time and, in the last three columns, best-fit blackbody parameters. The correction for interstellar absorption was done with the model by [Wilms et al. (2000)], that includes the O i 1s-2p line at 23.51 Å. In Fig. 2, the best-fit blackbody curve to the spectrum of V2491 Cyg is shown, and it can clearly be seen that many absorption features are not fitted with a blackbody model. Note also from Table 1 that the derived bolometric luminosity is in all cases higher than the Eddington luminosity of a 1-M⊙ white dwarf of .
| Nova | day of Outbursta | Instrument | dayc | |||||
|---|---|---|---|---|---|---|---|---|
| V4743 Sgr | 2002 Sept. 20.4 | 3.9 | Chandra/LETGS | 180.4 | 15 | 3.9 | 2.1 | 40.21 |
| Chandra/LETGS | 371.0 | 12 | 4.6 | 1.8 | 39.25 | |||
| RS Oph | 2006 Feb 12.8 | 1.6 | Chandra/LETGS | 39.7 | 10 | 6.2 | 5.1 | 38.43 |
| Chandra/LETGS | 66.9 | 6.5 | 5.0 | 6.9 | 39.86 | |||
| V2491 Cyg | 2008 Apr 10.7 | 10.5 | XMM-Newton/RGS | 39.9 | 39 | 5.2 | 5.0 | 40.02 |
| XMM-Newton/RGS | 49.7 | 30 | 5.7 | 4.7 | 38.94 |
aTime of optical discovery, treated as start time of the outburst bDistance in kpc
cTime of observation in units days after outburst dExposure time in s
eBlackbody temperature in K fNeutral hydrogen column density in cm-2
gLogarithmic bolometric luminosity in erg s-1
In the XMM-Newton RGS spectrum of V2491 Cyg that is shown in Fig. 2, one can clearly see that strong absorption lines are present. Most lines originate from H-like and He-like lines of C, N, and O. Some of these lines are marked in Fig. 2. The shadings, ranging from light to dark blue, indicate the range between the rest wavelengths (light) to the expected wavelengths assuming a Doppler velocity of km s-1 (dark). It can clearly be seen that for the indicated lines, deep absorption lines occur shortwards of the rest wavelengths but in agreement with the blue-shifted wavelengths. For the C vi Ly (1s-3p) line at 28.45 Å, a deep line occurs at the rest wavelength, but the identification as blue-shifted N vi Ly (1s-2p) appears more likely in light of the arguable blue shifts of all the other lines and the given depth of the N vii Ly line around 24.8 Å.

In order to determine the exact line shifts and line widths with uncertainties, I have selected the strongest and most isolated (non-blended) lines in the spectra of V4743 Sgr, V2491 Cyg, and RS Oph and fitted the narrow spectral regions around each line with the curve
| (1) |
where , , and are the continuum, optical depth, and interstellar transmission, as function of wavelength, , respectively. For the continuum, a blackbody curve with adjustable temperature, and normalisation was used. The transmission curve was calculated using the tool bamabs by [Kashyap & Drake (2000)] with the free parameter . The optical depth is defined as
| (2) |
with the optical depth at line centre, the central wavelength, and the Gaussian line width.
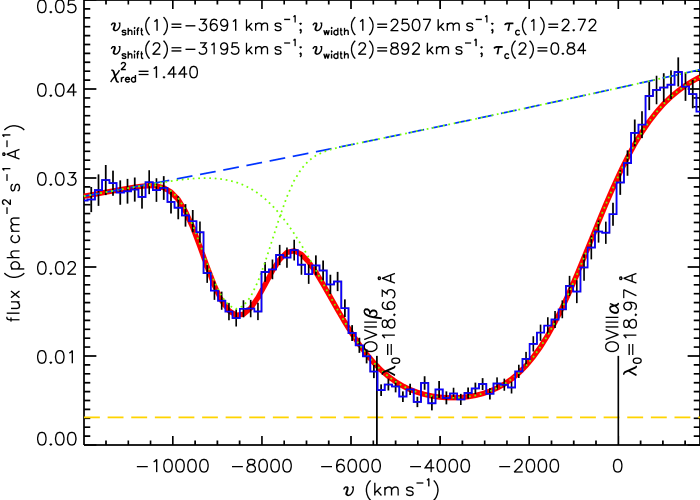
In Fig. 3, I show, as an example, the observation of V2491 Cyg on day 39.7 and the best fit to the the O viii (1s-2p) and O vii (1s-3p) lines at Å and Å, respectively. On the x-axis, a velocity scale is shown, assuming that 18.97 Å is the rest wavelength. The best-fit velocities derived from the line-shifts and line-widths are given in the legend, together the value of reduced . Note that for the purposes of determining line shifts and line widths, the continuum model is not important, and the additional free parameters can be regarded as ’uninteresting’; see [Avni (1976)].
Even without the fit, one can already see that the O viii line is saturated, however, the emission level in the line centre never drops to zero. Therefore, significant continuum emission that arises from above the O viii-absorbing material must be present, and this possibility has been accounted for in the fit by adding a constant flux in all spectral bins. This emission level was a free parameter, and the best-fit emission level of this additional continuum emission is indicated by the dashed yellow line in Fig. 3.
With a value of reduced , the fit is acceptable, however, one can see that the profile of the O viii line is not smooth, indicating that the different absorbing layers are not uniform in column density. While the line shift can be determined relatively accurately, the line widths may be affected by larger systematic uncertainties arising from the irregular shape of the profile and also by blends with weaker lines. In the bottom panel of Fig. 3, I illustrate how the uncertainties for the line shift of the O viii line has been derived. The best-fit line shift is marked by the vertical red line in the centre, and the parabolic curve is the difference of as a function of velocity . The black bullets mark grid points at which a fixed line shift was assumed while all other parameters were refitted. With three free parameters (line shift, line width, and line depth)111All other parameters are ’uninteresting’; see Avni (1976), the value of does not increase by more than 3.53 (horizontal green line in the bottom panel of Fig. 3) if the line shift is within the 1- (=68.3%) uncertainty range. This range is indicated by the vertical black line to the right and left of the best-fit value.
3 Results and Discussion

The results are presented in Fig. 4, where line shifts versus line widths are shown. The main result is that all lines are blue shifted, and that the observed line shifts change with time. One can also see that different velocity systems can be identified from the X-ray spectra. While for RS Oph, all lines are consistently blue shifted by km s-1, the observed velocities in V2491 Cyg are much higher, with more than 3000km s-1. For V4743 Sgr, the situation is more complicated, and more than one velocity system can be identified in some lines. Blue shifts of more than 4000km s-1 can easily be mixed up with other lines, however, the presence of such a fast component in three different lines suggests that this component is indeed present. With the presence of different velocity components, the interpretation of the line widths has to be approached with more care and will be discussed in more detail in upcoming papers.
The detection of blue shifts can either be interpreted as the radial velocity of the system or as the expansion velocity of the ejecta. The former interpretation has implicitly been assumed by, e.g., [Rauch et al. (2005)] in order to bring static atmosphere models in agreement with the observations of V4743 Sgr. However, a radial velocity of 2400km s-1 seems unreasonably high. Especially the fact that the observed blue shifts change by several hundreds km s-1 within only a few weeks is reason enough to confidently rule out this possibility. The only possible conclusion from the line shifts is that the ejecta are still expanding, and that mass loss is thus still continuing.
This conclusion has important implications for several model approaches. For example, Hachisu & Kato (2009) assume for their light curve models that in V2491 Cyg, the wind has stopped on or before day 40 after outburst (see their figure 1). Yet, from Fig. 4 (blue open symbols) one can clearly see that on day 49.7, significant expansion was still detected. While for V2491 Cyg, the change in blue shift from day 39.9 to 49.7 is not significant enough to clearly rule out a radial velocity of the system of km s-1, the situation is clearly different for RS Oph, where the radial velocity can not be higher than km s-1 (see open green symbols in Fig. 4), and at least on day 39.7, the wind had not stopped yet, opposed to the assumptions formulated by [Hachisu et al. (2007)].
Furthermore, most atmosphere models do not account for the expansion. While it is beyond the scope of this paper to test the importance of the expansion, significant effects can not easily be ruled out. It is easy to imagine that radiation transport works differently in a moving atmosphere, and it is thus mandatory that models that account for the expansion are tested. These tests are presented in the same volume by [van Rossum & Ness (2009)].
Acknowledgements.
I thank Mike Bode for comments on the draftReferences
- [Avni (1976)] Avni, Y. 1976, ApJ 210, 642
- [Balman et al. (1998)] Balman, S., Krautter, J., & Ögelman, H. 1998, ApJ 499, 395
- [Hachisu & Kato (2009)] Hachisu, I., & Kato, M. 2009, ApJL 694, L103
- [Hachisu et al. (2007)] Hachisu, I., Kato, M., & Luna, G. J. M. 2007, ApJL 659, L153
- [Hartmann & Heise (1997)] Hartmann, H. W., & Heise, J. 1997, A&A 322, 591
- [Kahabka & van den Heuvel 1997] Kahabka, P., & van den Heuvel, E. P. J. 1997, ARA&A, 35, 69
- [Kashyap & Drake (2000)] Kashyap, V., & Drake, J. J. 2000, Bulletin of the Astronomical Society of India 28, 475
- [Krautter et al. (1996)] Krautter, J., Ögelman, H., Starrfield, S., Wichmann, R., & Pfeffermann, E. 1996, ApJ 456, 788
- [Ness et al. (2009)] Ness, J.-U., Drake, J. J., Starrfield, et al. 2009, AJ 137, 3414
- [Ness et al. (2007)] Ness, J.-U., Starrfield, et al. 2007, ApJ 665, 1334
- [Ness et al. (2003)] Ness, J.-U., Starrfield, 2003, ApJL 594, L127
- [Petz et al. (2005)] Petz, A., Hauschildt, P. H., Ness, J.-U., & Starrfield, S. 2005, A&A 431, 321
- [Planck 1901] Planck, M. 1901, Annalen der Physik 309, 553
- [Rauch et al. (2005)] Rauch, T., Werner, K., & Orio, M. 2005, in AIP Conf. Proc. 774: X-ray Diagnostics of Astrophysical Plasmas: Theory, Experiment, and Observation, ed. R. Smith, 361
- [van Rossum & Ness (2009)] van Rossum, D. R., & Ness, J.-U. 2009, AN, submitted
- [Wilms et al. (2000)] Wilms, J., Allen, A., & McCray, R. 2000, ApJ 542, 914