1\Yearpublication2009\Yearsubmission2009\Month11\Volume999\Issue99
The Evolution of Spheroidal Galaxies in Different Environments
Abstract
We analyse the kinematic and chemical evolution of 203 distant spheroidal (elliptical and S0) galaxies at which are located in different environments (rich clusters, low-mass clusters and in the field). VLT/FORS and CAHA/MOSCA spectra with intermediate-resolution have been acquired to measure the internal kinematics and stellar populations of the galaxies. From HST/ACS and WFPC2 imaging, surface brightness profiles and structural parameters were derived for half of the galaxy sample. The scaling relations of the Faber-Jackson relation and Kormendy relation as well as the Fundamental Plane indicate a moderate evolution for the whole galaxy population in each density regime. In all environments, S0 galaxies show a faster evolution than elliptical galaxies. For the cluster galaxies a slight radial dependence of the evolution out to one virial radius is found. Dividing the samples with respect to their mass, a mass dependent evolution with a stronger evolution of lower-mass galaxies () is detected. Evidence for recent star formation is provided by blue colours and weak [O II] emission or strong H absorption features in the spectra. The results are consistent with a down-sizing formation scenario which is independent from the environment of the galaxies.
keywords:
cosmology: observations – galaxies: evolution – galaxies: elliptical and lenticular, cD – galaxies: fundamental parameters – galaxies: stellar content1 Introduction
Hierarchical structure formation models based on cold dark matter particles predict different evolutionary paths and assembly time-scales for the densest environments of clusters of galaxies and the lowest densities of isolated galaxies (Baugh et al. 1998; Somerville & Primack 1999). From typical age variations of 43% in the overall stellar content between cluster and field galaxies, a late mass assembly for massive spheroidal galaxies of smaller sub-units is expected. However, the involved physical processes (star formation rates, gas cooling and heating) remain poorly understood and thus the simplified baryonic recipes are interpreted and implemented differently. In this paradigm, field early-type galaxies are assembled through merging and accretion events of smaller clumps and fragments on longer time-scales up to the recent past (De Lucia et al. 2004). The environment is therefore suggested to play an important role to shape the formation and evolution of early-type (spheroidal) galaxies and their internal properties.
To shed more light on the formation and assembly history of spheroidal galaxies, we have conducted an extensive observational campaign using a combination of high signal-to-noise (), intermediate-resolution VLT/FORS and CAHA/MOSCA spectroscopy together with HST/ACS plus WFPC2 imaging and deep ground-based multi-band photometry. Target galaxies are residing in environments of various densities, from massive rich galaxy clusters over low-mass (poor) galaxy clusters to the isolated field. The motivation of the project was to look how the physical properties of early-type galaxies, as well as their sub-classes of elliptical and S0 galaxies, depend on their environment. The evolution of galaxies in luminosity, size, mass and their stellar populations were intercompared to test possible environmental effects and to constrain the theoretical formation and evolution model predictions. Throughout this work a cosmology for a flat, low-density Universe is assumed with , and km s-1 Mpc-1.
2 Observational Data
Previous spectroscopic studies at moderate redshift were limited to a small
number of the more luminous galaxies. To overcome bias and selection problems
of small samples, we focus in this work on a large number of 96 cluster
members in two massive rich galaxy clusters Abell 2218 (Ziegler et al. 2001)
and Abell 2390 (Fritz et al. 2005) and 68 cluster members in six low-mass
galaxy clusters at .
(Fritz et al. 2004; Fritz et al. 2010 in prep).
The low-mass clusters were selected to have very low X-ray luminosities
( erg/s)111 between 0.1–2.4 keV
1.0 dex lower than X-ray bright rich CNOC clusters, and poor optical richness
class. Spheroidal candidates in rich clusters were
selected based on deep ground-based imaging using colour-colour
criteria that effectively removes fore- and background objects. Spheroidal
candidates in poor clusters were selected by a combination of
photometry and spectroscopic redshifts.
The galaxies span a wide range in luminosity (),
corresponding for A 2390 to , and a wide field-of-view
of (
Mpc2).
Field spheroidal candidates were selected based upon the deep and multi-band sky surveys of the FORS Deep Field (FDF, Heidt et al. 2003) and William Herschel Deep Field (WHDF, Metcalfe et al. 2001), respectively. For the follow-up VLT/FORS spectroscopy, the main selection criterium was an apparent brightness of mag. This ensured a 15 in the absorption lines, mandatory for a robust measurement of internal kinematics and line-strengths. The final sample comprises 24 field spheroidals down to , cf Fritz et al. (2009).
HST/WFPC2 and ACS structural parameters for 78 spheroidal galaxies were derived with two different algorithms, which analyse each galaxy surface brightness profile with seeing-convolved, sky-corrected and exponential components, both simultaneously and separately. Elliptical (E) and S0 galaxies were morphologically classified using a visual inspection, the profile fitting results and their bulge-to-total fractions. A weak correlation of the bulge fraction of cluster galaxies with visual morphological Hubble type was found. Velocity dispersions () based on 30 spectra could be derived for 110 E+S0s. To ensure a reliable error treatment, Monte Carlo simulations for different stellar templates were performed (Fritz 2006; Fritz et al. 2009).
3 Results
3.1 Cluster spheroidal Galaxies
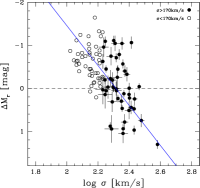
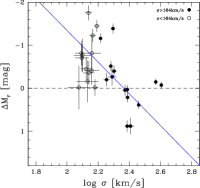
Scaling relations of the Faber–Jackson (FJR) and Kormendy relation as well as the Fundamental Plane (FP) for distant spheroidal galaxies at obey tight relationships similar to the local Universe. Assuming the local slope holds valid with increasing redshift, on average a modest luminosity evolution of the galaxies is derived, regardless of their environment. With respect to the local Coma cluster (Jørgensen et al. 1995), spheroidal galaxies in distant rich clusters display on average a moderate brightening of mag in the Gunn -band. For spheroidal galaxies in three low-mass clusters a median evolution of mag is derived. There is no significant increase of distant FJR scatter. Compared to the local counterparts, the distant FJR have shallower slopes at the 2 significance level, which implies a mass-dependent luminosity evolution.
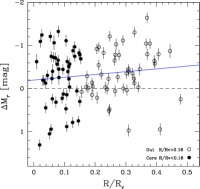
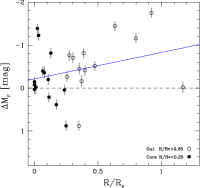
Fig. 1 shows the offsets of the FJR in Gunn for the spheroidal galaxies in two rich (upper panel) and three low-mass clusters (lower panel) from the local FJR of the Coma sample as a function of clustercentric radius and mass. Cluster spheroidals show a slight radial dependence. Galaxies in the outer regions at 0.25 virial radii (0.46 Mpc) show a stronger brightening by 0.2 mag than their central counterparts. This radial trend with a stronger evolution for galaxies residing in the outskirts of a cluster is also found in poor clusters, see Fig. 1. Lower-mass galaxies in all cluster environments are on average brighter by 0.6 mag in rest-frame Gunn than locally, whereas the distant spheroidals with masses of display only a mild evolution with respect to their present-day counterparts.
Lenticular (S0) galaxies in rich clusters exhibit a stronger evolution compared to the local Coma FP than the Es. The stellar populations of these systems could be more diverse or comprise more complex star formation histories (SFH; Fritz et al. 2005). This gets support by the rest-frame galaxy colors. Bluer galaxies () show larger FJR residuals from the local FJR of mag, whereas redder galaxies are less offset mag. In both color ranges, S0 galaxies indicate a stronger evolution (brighter by 0.7 mag for the bluer and 0.45 mag for the redder), but blue Es have on average only a mild brightening of 0.3 mag than the local reference.
3.2 Field spheroidal galaxies
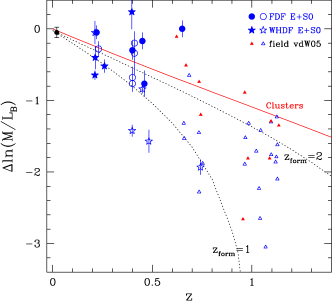
The mass-to-light () ratio of the field spheroidals evolves on average as , which is faster than for cluster spheroidal galaxies. This is consistent with field spheroidals comprising on average younger stellar populations than those of their cluster counterparts.
The evolution as derived from the scaling relations of the FJR, FP and hence effective ratio shows a strong dependence on the mass. Less-massive systems () display a faster evolution , whereas more-massive galaxies () evolve slower . This implies that for the most massive field galaxies the majority of their stellar populations was formed early at . For less-massive galaxies the evolution can be translated into , which is at variance with the predictions of single-burst stellar population models. A fraction of 5%–10% in the total stellar mass of lower-mass galaxies () must have been formed at more recent epochs. At , an accelerated evolution for less-massive galaxies () () than for more-massive ones () is significant on the 2 level (Fritz et al. 2009).
Field S0 galaxies feature a stronger luminosity evolution (), bluer rest-frame colours and more diverse stellar populations and hence evolve faster than field Es (). Interestingly, the scatter appears to be mainly amplified for S0s.
Evidence for secondary star formation (SF) activity in the galaxies is provided by [O II] 3727 emission or strong H Balmer absorption as well as bluer rest-frame colour diagnostics. The H absorption line strengths imply that the residual (low level) SF of the galaxies accounts for 5% to 10% in the total stellar mass budget of these systems.
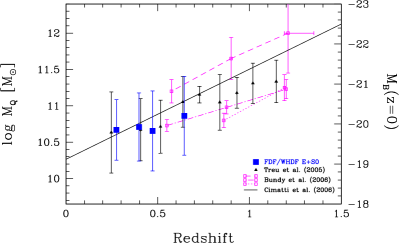
Over the past 6 Gyr, there is the trend of a slow decreasing quenching mass (see Fig. 2), which characterises a crossover in stellar mass above SF in galaxies gets suppressed. This suggests that our systems experience a gradual suppression in their SF processes. Our results favour a scenario where SF is not immediately suppressed for less-massive halos and hence works on longer time scales in lower-mass galaxies. For details, see Fritz et al. (2009).
3.3 Conclusions
The lack of an age difference found for field and cluster galaxies and the dependence of the evolution on galaxy mass suggests that environmental effects are not the dominant factors which drive the formation of early-type galaxies. Internal properties, such as mass, size, or chemical composition, are the main contributors to their evolutionary history. The evolution in the ratio in all environments favors a down-sizing formation scenario (Cowie et al. 1996).
A mass-dependent luminosity evolution is found in all environments (Fritz et al. 2005; 2009). E and S0 galaxies are not a homogeneous group but follow different evolutionary tracks. S0s indicate in all environments a stronger evolution and more recent formation epochs (). Thus S0s may have different stellar populations or more complex, extended SFH, whereas Es evolve passively on longer timescales yielding to older population ages ().
Acknowledgements.
We thank the ESO Paranal and Calar Alto staff for efficient observational support. This work has been supported by the VW Foundation (I/76 520). A.F. acknowledges partial support from grant HST-GO-10826.01 from STScI. STScI is operated by AURA, Inc., under NASA contract NAS 5-26555.References
- Baugh et al. (1998) Baugh, C. M. et al.: 1998, ApJ, 498, 504
- Cowie et al. (1996) Cowie, L. L. et al.: 1996, AJ, 112, 839
- De Lucia et al. (2004) De Lucia, G. et al.: 2004, MNRAS, 349, 1101
- Fritz et al. (2004) Fritz, A., & Ziegler, B. L.: 2004, in IAUC 195, Outskirts of Galaxy Clusters: Intense life in the suburbs, ed. Diaferio, A., p. 502
- Fritz et al. (2005) Fritz, A. et al.: 2005, MNRAS, 358, 233
- Fritz (2006) Fritz, A.: 2006, PhD thesis, University of Göttingen
- Fritz et al. (2009) Fritz, A., Böhm, A., & Ziegler, B. L.: 2009, MNRAS, 393, 1467
- Heidt et al. (2003) Heidt, J., et al.: 2003, A&A, 398, 49
- Jørgensen et al. (1995) Jørgensen, I. et al.: 1995, MNRAS, 273, 1097
- Metcalfe et al. (2001) Metcalfe, N. et al.: 2001, MNRAS, 323, 779
- Somerville & Primack (1999) Somerville, R. S., & Primack, J. R.: 1999, MNRAS, 310, 1087
- Ziegler et al. (2001) Ziegler, B. L. et al.: 2001, MNRAS, 325, 1571