X-ray optical depth diagnostics of T Tauri accretion shocks
Abstract
Context. In classical T Tauri stars, X-rays are produced by two plasma components: a hot low-density plasma, with frequent flaring activity, and a high-density lower temperature plasma. The former is coronal plasma related to the stellar magnetic activity. The latter component, never observed in non-accreting stars, could be plasma heated by the shock formed by the accretion process. However its nature is still being debated.
Aims. Our aim is to probe the soft X-ray emission from the high-density plasma component in classical T Tauri stars to check whether this is plasma heated in the accretion shock or whether it is coronal plasma.
Methods. High-resolution X-ray spectroscopy allows us to measure individual line fluxes. We analyze X-ray spectra of the classical T Tauri stars MP Muscae and TW Hydrae. Our aim is to evaluate line ratios to search for optical depth effects, which are expected in the accretion-driven scenario. We also derive the plasma emission measure distributions , to investigate whether and how the of accreting and non accreting young stars differ. The results are compared to those obtained for the non-accreting weak-line T Tauri star TWA 5.
Results. We find evidence of resonance scattering in the strongest lines of MP Mus, supporting the idea that soft X-rays are produced by plasma heated in the accretion shock. We also find that the of MP Mus has two peaks: a cool peak at temperatures expected for plasma heated in the accretion shock, and a hot peak typical of coronal plasma. The shape of the of MP Mus appears to be the superposition of the of a pure coronal source, like TWA 5, and an alike that of TW Hydrae, which is instead dominated by shock-heated plasma.
Key Words.:
stars: atmospheres – stars: coronae – stars: individual: MP Muscae, TW Hydrae, TWA 5 – stars: pre-main sequence – techniques: spectroscopic – X-rays: stars1 Introduction
Classical T Tauri stars (CTTS) are young low-mass stars, still surrounded by a circumstellar disk from which they accrete material. According to a widely accepted model, they have a strong magnetic field that regulates the accretion process disrupting the circumstellar disk, loading material of the inner part of the disk, and guiding it in a free fall along its flux tubes toward the central star (Uchida & Shibata, 1984; Bertout et al., 1988; Koenigl, 1991).
A characteristic feature of young stars is strong X-ray emission that is traditionally ascribed to magnetic activity in their coronae. Similar to their more evolved siblings, the diskless weak-line T Tauri stars (WTTS), CTTS display high X-ray luminosities and frequent flaring activity. The typical temperature of their coronal plasma is MK, or even higher during strong flares (e.g. MK, Getman et al., 2008).
From a theoretical point of view, the accretion process can also produce significant X-ray emission on CTTS. Material accreting from the circumstellar disk reaches velocities of . A shock forms at the base of the accretion column because of the impact with the stellar atmosphere. This shock heats up the accreting material to a maximum temperature , where is the infall velocity. Because of the high pre-shock velocity, the infalling material reaches temperatures of a few MK, and hence it emits X-rays. Typical values of mass accretion rate for CTTS indicate that the accretion-driven X-ray luminosity should be comparable to the coronal one (Gullbring, 1994). Considering typical inferred stream cross-sectional area ( of the stellar surface, e.g. Calvet & Gullbring, 1998), velocity (), and mass accretion rate (, e.g. Gullbring et al., 1998), it can be inferred that the plasma heated in the accretion shock should have densities , i.e. at least one order of magnitude higher than coronal plasma density. Hence, in principle, the accretion process can produce plasma with: high , high density, and temperatures of a few MK.
To summarize, X-ray emission from CTTS can originate from two different plasma components: plasma heated in the accretion shock and coronal plasma. The former, because of its lower temperatures, should dominate the softer X-ray band (e.g. keV in the case of the CTTS TW Hya, Günther et al., 2007). While the harder X-ray emission, keV, should be produced almost entirely by coronal plasma.
Recently, high-resolution X-ray spectra of a few CTTS enabled measurement of individual emission lines sensitive to plasma density (i.e. He-like triplets), and hence searches for evidence of accretion-driven X-rays. The density of the plasma at MK can be inferred from the O vii and Ne ix triplet lines (at and 0.9 keV, respectively). All but one of the CTTS for which the O vii triplet lines were detected showed cool plasma with high density, (Kastner et al., 2002; Stelzer & Schmitt, 2004; Schmitt et al., 2005; Günther et al., 2006; Argiroffi et al., 2007; Güdel et al., 2007; Robrade & Schmitt, 2007). In contrast, the cool quiescent plasma of active stellar coronae is always dominated by low densities (, Ness et al., 2002; Testa et al., 2004a). This basic difference suggests that the high-density cool plasma in CTTS is not coronal plasma but plasma heated in accretion shocks. One complication to this argument is that mass accretion rates derived from assuming a very high efficiency of conversion of accretion energy into X-rays tend to be an order of magnitude or so lower than rates derived using other methods (e.g. Drake, 2005; Schmitt et al., 2005; Günther et al., 2007).
The idea of accretion-driven X-rays from CTTS is superficially supported by a soft X-ray excess found in high-resolution X-ray spectra of CTTS with respect to similar spectra of WTTS by Telleschi et al. (2007) and Güdel & Telleschi (2007). However, Güdel et al. (2007) and Güdel & Telleschi (2007) noted that this soft X-ray excess is significantly lower than that predicted by simple models of X-ray emission from accretion shocks. Moreover, the soft excess scales with total stellar X-ray luminosity, and hence is related at least partially in some way with the stellar magnetic activity. Güdel et al. (2007) and Güdel & Telleschi (2007) suggested that the CTTS soft X-rays could be produced by infalling material loaded into coronal structures.
The properties of the X-ray emitting plasma in CTTS and in WTTS have also been investigated using CCD X-ray spectra of large stellar samples. These studies, however, commonly covered the keV energy band in which the coronal component dominates. The main results are that CTTS are on average less luminous in the X-ray band than WTTS (e.g. Flaccomio et al., 2003), and that X-ray emitting plasma of CTTS is on the average hotter than that of WTTS (Neuhäuser et al., 1995; Preibisch et al., 2005). CTTS and WTTS therefore do have different coronal characteristics, suggesting that the accretion process can affect coronal properties to some extent.
Numerical simulations have confirmed that the accretion process can produce significant X-rays: Günther et al. (2007) derived stationary 1-D models of the shock in an accretion column; Sacco et al. (2008a) improved those results by performing 1-D hydrodynamical (HD) simulations of the accretion shock, including the stellar atmosphere and taking into account time variability. Assuming optically thin emission, Sacco et al. (2008a) showed that, even for low accretion rates, the amount of X-rays produced in the accretion shock is comparable to the typical X-ray luminosity of CTTS ( for ).
Several aspects of the nature of the high-density cool plasma component observed in CTTS are still debated. In particular, definitive evidence that it is material heated in the accretion shock is still lacking. Moreover, while the simple ”photospheric burial” model of Drake (2005) suggests that under some circumstances a large fraction of the shock X-rays can be absorbed and reprocessed by the photosphere, there are currently no detailed quantitative models explaining why the X-ray luminosities, predicted on the basis of 1-D HD simulation results and mass accretion rates inferred from observations at other wavelengths, are universally much higher than observed.
Understanding the link between accretion and X-rays would also allow more accurate characterization of the coronal component of the X-ray emission from CTTS. This could help in understanding how accretion changes coronal activity, and which other parameters determine the coronal activity level in PMS stars, whose X-ray luminosity cannot simply be explained in terms of a Rossby dynamo number (Preibisch et al., 2005) as is largely the case for active main sequence stars (e.g. Pizzolato et al., 2003).
To address the above issues, we performed a detailed study of the high-resolution X-ray spectra of two nearby CTTS: TW Hya and MP Mus. In particular we investigated:
-
-
optical depth effects in their soft X-ray emission;
-
-
the emission measure distribution (EMD) of the X-ray emitting plasma.
Optical depth effects probe the nature of the high-density cool plasma component: we show that, if the emitting plasma is located in the accretion shock, some emission lines should have non-negligible optical depth; in contrast these lines should be optically thin if the plasma is located in coronal structures. We also investigate how the EMD can help in recognizing coronal and accretion plasma components, which should have different average temperatures. We compare the EMD of accreting and non-accreting young stars, and compare these observed EMD with that predicted on the basis of the HD shock model of (Sacco et al., 2008a).
2 Targets
| Instrument | Start | Exposure |
|---|---|---|
| (UT) | (ks) | |
| MP Mus (ObsId 0406030101) | ||
| RGS1 | 2006 Aug 19 09:30:48 | 98.7 |
| RGS2 | 2006 Aug 19 09:30:56 | 98.8 |
| TW Hya (ObsId 0112880201 ) | ||
| RGS1 | 2001 Jul 9 05:51:39 | 29.0 |
| RGS2 | 2001 Jul 9 05:51:39 | 28.0 |
| MP Mus | TW Hya | |||||||||
| Ion | Fluxc | EMDd | Fluxc | EMDd | ||||||
| 8.42 | Mg xii Mg xii | 7.00 | 8.39 | 4.1 | 4.1 | |||||
| 10.24 | Ne x Ne x | 6.80 | 10.28 | 7.6 | 5.2 | |||||
| 11.00 | Ne ix | 6.60 | 11.01 | 10.8 | 7.2 | |||||
| 11.54 | Ne ix | 6.60 | 11.55 | 23.6 | 16.7 | |||||
| 12.13 | Ne x Ne x Fe xvii | 6.80 | 12.14 | 22.2 | 3.4 | 12.15 | 58.6 | 9.4 | ||
| 12.28 | Fe xxi Fe xvii | 7.00 | 12.30 | 5.5 | 2.6 | |||||
| 12.85 | Fe xx Fe xx Fe xx Fe xx | 7.00 | 12.86 | 3.4 | 2.3 | |||||
| 13.45 | Ne ix Fe xix | 6.60 | 13.46 | 21.1 | 3.7 | 13.46 | 244.7 | 18.5 | ||
| 13.55 | Ne ix Fe xix | 6.60 | 13.55 | 8.6 | 3.1 | 13.56 | 162.4 | 16.4 | ||
| 13.70 | Ne ix | 6.60 | 13.73 | 8.8 | 2.8 | 13.71 | 91.7 | 29.8 | ||
| 14.21 | Fe xviii Fe xviii | 6.90 | 14.19 | 3.3 | 1.7 | |||||
| 14.82 | O viii O viii | 6.50 | 14.84 | 10.5 | 4.8 | |||||
| 15.01 | Fe xvii | 6.70 | 15.02 | 11.8 | 2.9 | 15.05 | 26.5 | 5.7 | ||
| 15.18 | O viii O viii Fe xix Fe xvii | 6.50 | 15.21 | 7.6 | 2.5 | 15.21 | 23.6 | 7.7 | ||
| 16.01 | O viii O viii Fe xviii Fe xviii | 6.50 | 16.02 | 22.6 | 6.3 | 16.03 | 43.2 | 15.5 | ||
| 16.78 | Fe xvii | 6.70 | 16.78 | 8.8 | 1.8 | 16.79 | 13.3 | 6.8 | ||
| 17.05 | Fe xvii Fe xvii | 6.70 | 17.08 | 17.2 | 3.0 | 17.06 | 24.3 | 7.6 | ||
| 17.77 | O vii | 6.40 | 17.80 | 5.7 | 6.6 | |||||
| 18.63 | O vii | 6.30 | 18.65 | 8.7 | 2.6 | 18.65 | 21.6 | 5.8 | ||
| 18.97 | O viii O viii | 6.50 | 18.98 | 65.6 | 4.7 | 18.98 | 292.7 | 13.3 | ||
| 19.83 | N vii N vii | 6.40 | 19.85 | 4.3 | 4.4 | |||||
| 20.91 | N vii N vii | 6.30 | 20.95 | 14.3 | 9.8 | |||||
| 21.60 | O vii | 6.30 | 21.60 | 30.2 | 4.0 | 21.62 | 191.7 | 17.5 | ||
| 21.80 | O vii | 6.30 | 21.81 | 27.9 | 7.9 | 21.83 | 104.6 | 14.3 | ||
| 22.10 | O vii | 6.30 | 22.10 | 8.0 | 2.8 | 22.12 | 13.8 | 8.7 | ||
| 24.78 | N vii N vii | 6.30 | 24.80 | 10.5 | 2.8 | 24.79 | 118.2 | 13.4 | ||
| 28.47 | C vi C vi | 6.20 | 28.49 | 3.8 | 1.3 | |||||
| 28.79 | N vi | 6.20 | 28.82 | 25.2 | 5.2 | |||||
| 29.08 | N vi | 6.10 | 29.10 | 11.5 | 5.0 | |||||
| 33.73 | C vi C vi | 6.10 | 33.74 | 16.4 | 5.2 | 33.75 | 86.5 | 13.8 | ||
a Predicted (APED database) and observed wavelengths (Å). b Temperature (K) of maximum emissivity. c Observed line fluxes () with uncertainties at the 68% confidence level. d Lines selected for the EMD reconstruction.
We selected the two CTTS MP Mus and TW Hya for this study. These stars suffer moderate interstellar absorption (), and good spectra, gathered with XMM-Newton/RGS (high spectral resolution and large effective area in the soft X-ray band) are available. While high-resolution X-ray spectra of TW Hya have also been obtained by Chandra, we chose to analyze the XMM-Newton/RGS spectra so as to have more uniform data for the two stars, enabling more ready comparison of the derived results.
TW Hya is a CTTS, located at 56 pc. From its membership in the eponymous TW Hya Association (TWA), its age is estimated to be Myr (Kastner et al., 1997). Muzerolle et al. (2000) estimated a mass accretion rate of based on its H profile and UV flux. Alencar & Batalha (2002) and Batalha et al. (2002) derived a higher value, , based on UV data, in agreement with the mass accretion rate inferred from the H line width by Jayawardhana et al. (2006). The X-ray emission of TW Hya shows clear evidence of high-density plasma () at low temperatures (Kastner et al., 2002; Stelzer & Schmitt, 2004).
MP Mus is a CTTS with spectral type K1IVe. Mamajek et al. (2002) identified it as a member of the Lower Centaurus Crux (LCC) Association, and determined a distance of 86 pc using the moving cluster method and the LCC convergent point. They inferred for MP Mus a mass of from photometry and isochrone fitting to different evolutionary tracks. Recently Torres et al. (2008) suggested that MP Mus is likely a member of the younger Cha Association. The authors, using their convergent method iteratively with their list of candidates of the association (Torres et al., 2006), determined a distance to the star of 103 pc. Note that both these distance estimates, 86 and 103 pc, depend on correct identification of the parent stellar association. In this work we assume a distance for MP Mus of 86 pc. Adopting the longer distance would lead to higher X-ray fluxes by only 30% or so and would be of no consequence for the purpose of this study. Like TW Hya, MP Mus also exhibits evidence of cool plasma at high density (, Argiroffi et al., 2007). While it is certain that MP Mus is a CTTS (H equivalent width is Å, Gregorio-Hetem et al., 1992), its mass accretion rate is not known. The accretion rate is fundamental for studying the relation between accretion and soft X-ray emission, and we evaluate it in Sect. 4 using an optical spectrum of MP Mus taken with FEROS at La Silla Observatory.
We compare the results obtained for TW Hya and MP Mus with those obtained for TWA 5, a member of the TWA with similar age to TW Hya. TWA 5 is a quadruple system with three similar components of and a brown dwarf. H equivalent width ( Å, Gregorio-Hetem et al., 1992) indicates that TWA 5 is a WTTS, even if some marginal accretion is still present at least in one of the components (Mohanty et al., 2003). We selected TWA 5 for the comparison because: 1) its EMD was derived from an XMM-Newton/RGS observation (Argiroffi et al., 2005) with the same method we adopted in this work for MP Mus and TW Hya; 2) low plasma density was inferred from the O vii triplet (Argiroffi et al., 2005), suggesting that its X-ray emission is entirely produced by the stellar corona.
3 RGS data analysis
TW Hya was observed on July 2001 for 30 ks, and MP Mus on August 2006 for 110 ks. Details of the data processing can be found in Stelzer & Schmitt (2004) and Argiroffi et al. (2007), respectively. In Table 1 we report the log of the XMM-Newton/RGS observations of the two stars. For MP Mus we discarded time segments affected by high background count rates, obtaining a net exposure of ks over the selected good time intervals.
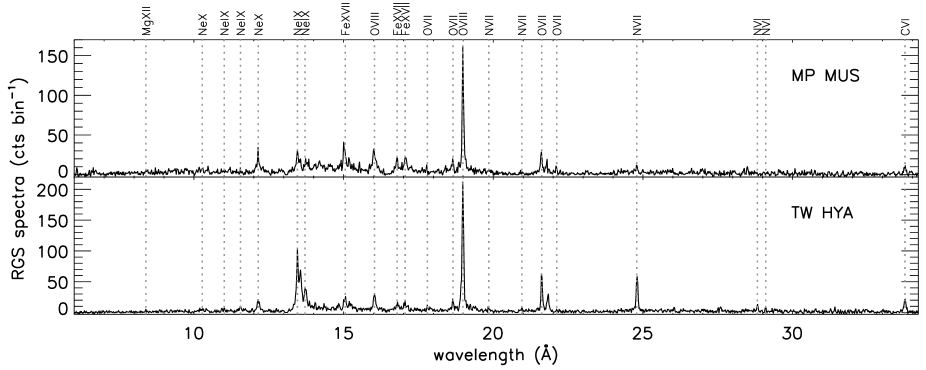
Background-subtracted spectra of MP Mus and TW Hya contain and net counts, respectively. To increase the ratio of the data we added the RGS1 and RGS2 spectra and rebinned by a factor 2. The resulting RGS spectra are shown in Fig. 1.
We based the spectral analysis (line identification, line emissivity functions , line oscillator strengths ) on the Astrophysical Plasma Emission Database (APED V1.3, Smith et al., 2001), as implemented in the PINTofALE V2.0 software package (Kashyap & Drake, 2000). Spectral line fluxes were measured within PINTofALE by fitting the observed lines with a Lorentzian profiles. The results are listed in Table 2.
3.1 EMD reconstruction
Having defined a temperature grid, , with binsize , the EMD of the X-ray emitting plasma is computed as the amount of emission measure, , of plasma with temperature ranging between and . We derived the EMD from the line flux measurements using the Markov-Chain Monte Carlo (MCMC) method of Kashyap & Drake (1998). We considered all the measured lines whose intensity depends only on the plasma temperature, and not on the plasma density: hence, we discarded the intercombination and forbidden lines of the O vii and Ne ix He-like triplets. The lines used for the EMD reconstruction are marked in Table 2.
We reconstructed the plasma EMD over a logarithmic temperature grid ranging between and 7.2, with a bin size of 0.2. This choice was guided by the set of formation temperatures of the measured lines (see in Table 2). This range includes the expected temperature of plasma heated in an accretion shock. On the other hand, coronal plasma may also have temperatures higher than , so the derived EMD does not take very hot coronal components into account.
The derived EMD for MP Mus and TW Hya are reported in Table 3. Simultaneously with the EMD reconstruction, we derived also the relative abundances of elements represented by the selected lines. The absolute abundances, also reported in Table 3, were fixed for both stars by matching the predicted and observed spectra.
| MP Mus | TW Hya | |
| (K) | EMD | EMD |
| Elem. | ||
| C | ||
| N | ||
| O | ||
| Ne | ||
| Mg | ||
| Fe |
Abundances are in solar units (Asplund et al., 2005). EMD values have been derived assuming that MP Mus and TW Hya are located at 86 and 56 pc, respectively.
3.2 Optical depth effects
Assuming that the X-ray emitting plasma has a geometrical depth (in cm) along the line of sight, free electrons with density and temperature (in K), then the optical depth of an emission line is given by (Acton, 1978):
| (1) |
where is the line wavelength (in Å), the line oscillator strength, is the atomic mass of the element (in amu), the density of element with ionization level , the density of element , the hydrogen density (all the densities are in units of ).
For increasing density , and/or increasing source dimension , increases. A non-negligible optical depth (), because of resonance scattering, first occurs in lines with large oscillator strengths and ground state lower levels. Photons produced in these transitions are absorbed again by ions of the same species in the ground state. These photons are then re-emitted in different, random directions. When the optical depth is of the order of unity, resonance scattering only affects the emergent spectrum if the source does not have a spherical symmetry.
In the scenario of accretion-driven X-ray emission, the material heated in the accretion shock is entirely located in a small compact volume at the footpoint of the accretion stream. The high-density cool plasma component observed in CTTS has density of and linear dimension of cm (inferred from measured values of and EM, Kastner et al., 2002; Stelzer & Schmitt, 2004; Argiroffi et al., 2007; Robrade & Schmitt, 2007). Considering these values for and , the optical depth of the strongest emission lines produced by this shock-heated plasma ( MK) should be non-negligible. As an example, the line center optical depth, , of the O vii resonance line at 21.60 Å is for a density , (corresponding to a temperature MK), , , amu, and cm.
On the other hand, if this high-density plasma component observed in CTTS is contained in many separate coronal structures, the average length covered by photons before escaping from the plasma should be significantly smaller, and hence the optical depth negligible. In fact, extensive investigation of coronal spectra for optical depth effects has shown coronae to be effectively optically-thin in almost all cases (e.g. Ness et al., 2003; Testa et al., 2004b, 2007), with only a few notable exceptions (see below).
Optical depth effects in a given line can be investigated by considering, as a reference, another line produced by the same element in the same ionization stage, but with a smaller oscillator strength (Ness et al., 2003; Testa et al., 2004b; Matranga et al., 2005; Testa et al., 2007). In the optically-thin case, the ratio between two such lines is dictated purely by atomic parameters and has only a weak dependence on the plasma temperature. Instead, when the gas is not optically-thin, the line with larger oscillator strength can be quenched relative to the weaker line, causing a discrepancy between the observed and predicted optically-thin ratios.
In the high-resolution X-ray spectra gathered with Chandra and XMM-Newton, the strongest emission lines with the largest oscillator strengths are the Ly lines of O viii and Ne x, the resonance lines of O vii and Ne ix, and the Fe xvii line at 15.01 Å. Considering Chandra/HETGS data, Testa et al. (2004b) and Testa et al. (2007) found significant resonance scattering in the Ly/Ly line ratios of O viii and Ne x of the active stars II Peg and IM Peg. Matranga et al. (2005) and Rose et al. (2008), analyzing RGS data of AB Dor and EV Lac, found that the ratio between the Fe xvii lines at 15.01 and 16.78 Å changes between the flaring and quiescent phases, indicating opacity in the 15.01 Å line.
| Star | ||||
|---|---|---|---|---|
| MP Mus | ||||
| TW Hya | ||||
| TWA 5 | ||||
| Procyon | ||||
| AT Mic | ||||
| CrB | ||||
| YZ CMi | ||||
| 44 Boo | ||||
| Cen | ||||
| Capella | ||||
| AB Dor |
Ratios are derived from line fluxes in . Active stellar measurements are taken from: Raassen et al. (2002) for Procyon; Raassen et al. (2003) for AT Mic; Gondoin (2005) for CrB; Raassen et al. (2007) for YZ CMi ; Gondoin (2004) for 44 Boo; Audard et al. (2001) for Capella; Sanz-Forcada et al. (2003) for AB Dor.
We searched for optical depth effects in the X-ray emission of MP Mus and TW Hya, using TWA 5 as a non-accreting comparison. We investigated three line ratios:
-
-
the ratio of the O vii lines at 21.60 Å and 18.63 Å, produced by transitions to the ground level () from the shells and respectively; the resonance line at 21.60 Å has a large oscillator strength (), while the line at 18.63 Å has a small oscillator strength ();
-
-
the ratio between the O viii Ly at 18.97 (a doublet with oscillator strengths and ) and the O viii Ly at 16.01 Å (a doublet with and );
-
-
the ratio between the Fe xvii lines at 15.01 Å (large oscillator strength, ) and 16.78 Å (small oscillator strength, ).
This line set allowed us to probe the optical depth of the plasma at temperatures ranging from 2 to 5 MK. We did not consider the Ne x Ly and Ly line ratio since, for MP Mus, we detected only the Ly line.
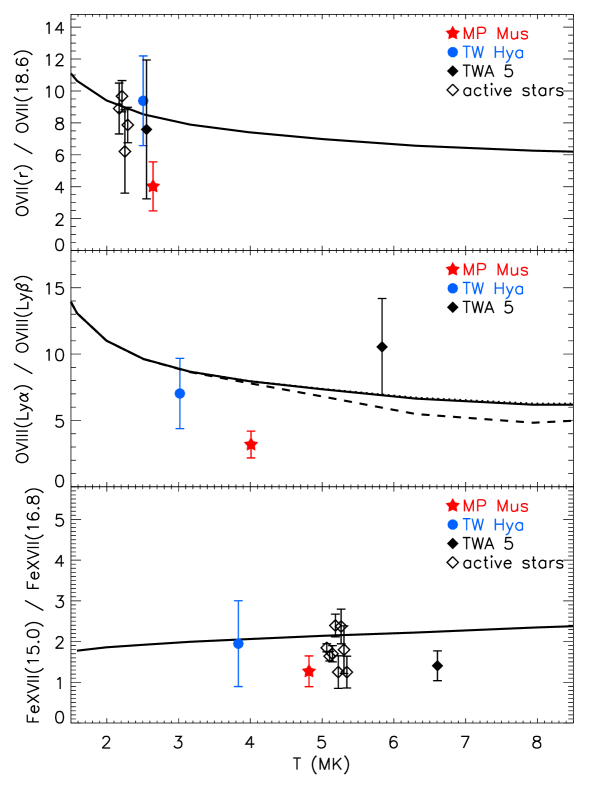
The observed ratios of MP Mus, TW Hya, and TWA 5 are listed in Table 4 and plotted in Fig. 2. These ratios were obtained correcting the observed fluxes (Table 2) for the interstellar absorption, assuming the values derived from the analysis of EPIC spectra (Argiroffi et al., 2007; Stelzer & Schmitt, 2004; Argiroffi et al., 2005). The correction factors due to interstellar absorption range between 0.94 and 1.16. We associated each flux ratio of each star to an average temperature. That average temperature was obtained assuming, as a weighting function, the product of the EMD and emissivity functions, , of the line in the numerator. The predicted flux ratios as a function of plasma isothermal temperature are also illustrated in Fig. 2.
All the lines involved in the analyzed ratios are free from significant blending, except for the O viii Ly line, located at 16.01 Å. This line is blended with two Fe xviii lines (16.00 and 16.07 Å), whose contributions are small but non-negligible (see, e.g. Testa et al., 2007, for a detailed discussion and treatment): the EMD and abundances derived for the X-ray emitting plasma of MP Mus and TW Hya (see Sect. 3.1) indicate that the Fe xviii contribution to the observed fluxes is about and , respectively. To take this into account, we included these contributions in the calculation of the predicted flux ratios. The predicted ratio of the O viii Ly and Ly lines is then weakly dependent on the model abundances and hence differs slightly for different stars.
For comparison, we considered also other coronal sources for which line fluxes and values, obtained from XMM-Newton/RGS data, were published. These stars and their O vii and Fe xvii line flux ratios, corrected for the interstellar absorption, are listed in Table 4 and are included in Fig. 2. We did not consider the O viii line ratio since its analysis requires knowledge of model abundances for each star.
MP Mus shows in all cases an observed ratio significantly lower than the predicted one, over the entire range of plausible temperature. The discrepancy between the observed and predicted ratios for MP Mus are 2.8, 4.7, and 2.3 for the O vii, O viii, and Fe xvii ratios, respectively. Conversely, the observed ratios for TW Hya are perfectly compatible with those predicted for optically-thin emission. The O vii and O viii ratios for all the other stars considered are compatible with the predicted optically-thin values. Conversely some stars, other than MP Mus, show a Fe xvii line ratio discrepant with the optically thin case. The interpretation of the Fe xvii ratio is more controversial: while coronal plasma might have non-negligible optical depth in the 15.01Å line (i.e. the Sun and AB Dor, Saba et al., 1999; Matranga et al., 2005), Ness et al. (2003) found that several stars, in a large sample, exhibit ratios somewhat discrepant from the predicted optically-thin value, as in our case, but they concluded that the interpretation of this result in terms of opacity effects is not convincing.
Summarizing, we detected a significant intensity deficit in lines with the largest oscillator strength in the spectrum of MP Mus: the O vii resonance line at 21.60 Å, the O viii Ly line at 18.98 Å, and the Fe xvii line at 15.01 Å. These lines are mainly formed by the plasma at a temperature of MK. We conclude that this emission is not optically-thin and that resonance scattering has quenched the strongest lines.
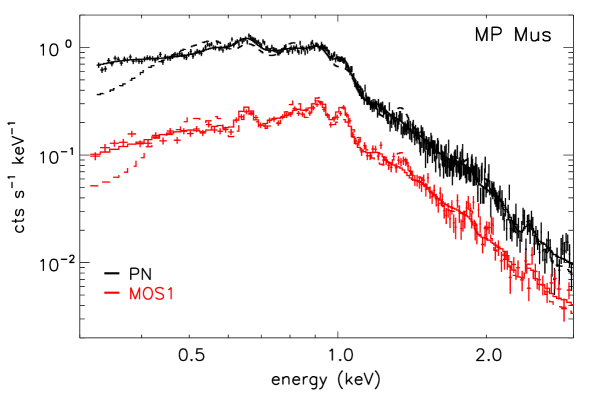
We explored whether the anomalous oxygen line ratios observed in MP Mus could be explained by an absorbing column higher than that assumed (that however could not explain the Fe xvii line ratio). To explain the observed O vii and O viii line ratios for MP Mus, a hydrogen column is required. This value is higher, by a factor 10, than the value constrained from the analysis of the EPIC spectra by Argiroffi et al. (2007), and adopted for the line ratio analysis. In Fig. 3 we show the PN and MOS1 spectra of MP Mus (MOS2 is omitted for clarity). We also plotted the 3 model with the inferred absorption (Argiroffi et al., 2007), and the 3 model obtained by fitting the EPIC spectra with an absorbing column fixed at . The soft part of the EPIC spectra, which constrains the value, is dominated by continuum emission. Therefore, if soft continuum and soft RGS lines, both contained in the keV energy range, are produced by the same plasma component, then the observed line ratios of MP Mus cannot be explained in terms of photoelectric absorption. Instead if soft continuum and soft lines originated from different plasma components, affected by different absorbing columns, then the observed line ratios could be explained by photoelectric absorption, rather than opacity effects in the emitting plasma. However, different absorbing columns would indicate that the highly absorbed component (the one producing the O vii and O viii lines) is located under the accretion stream or buried down in the stellar atmosphere, suggesting again that this plasma component originates in the accretion shock.
4 Optical spectra and their analysis
To gather information on the accretion status of MP Mus, we analyzed its optical spectrum taken from the public archive of La Silla Observatory (ESO). The observation was performed on March 18, 2005 using the echelle spectrograph FEROS at the 2.2m telescope. The spectra cover approximately 3850–9200 Å with a resolving power ( Å, in the region of H, measured in the calibration lamp spectrum). This range includes all the chromospheric activity indicators, ranging from Ca ii H & K to the calcium infrared triplet, as well as the lithium line at 6708 Å. The signal-to-noise ratio at 6550 Å is .
For the reduction, we used the standard procedures in the IRAF111IRAF is distributed by the National Optical Observatory, which is operated by the Association of Universities for Research in Astronomy, Inc., under contract with the National Science Foundation. package (bias subtraction, extraction of the scattered light produced by the optical system, division by a normalized flat-field, and wavelength calibration). After reduction, the spectrum of MP Mus was normalized to the continuum order by order by fitting a polynomial function to remove the general shape from the aperture spectra. We did not perform a flux calibration since it is not necessary for our study.
4.1 H line and accretion rate
We measured the equivalent width of the H line using an IDL procedure developed by us that enables estimation of the error in the measurements using both the signal-to-noise ratio and the spectral resolution. We obtained Å, which is similar to the value reported by Mamajek et al. (2002), but lower than that measured by Gregorio-Hetem et al. (1992), who found Å. This variation of 6 Å in observations obtained yr apart is not very high if compared e.g. with variations observed by Sacco et al. (2008b) in Ori and Ori. However, there is not enough time coverage to study the H variability in detail.
We also measured the width at 10% of the peak of the H line (see Fig. 4), which is indicative of the mass accretion rate for widths above (Natta et al., 2004). We obtained km s-1, corresponding to a mass accretion rate of .

5 Discussion
5.1 Soft X-rays from shock-heated plasma: optical depth effects
It appears that in most CTTS, significant soft X-rays are produced by a high-density plasma component. This result has been interpreted as a strong indication that this plasma, at a temperature of a few MK, is formed in the shock at the base of the accretion stream near the stellar surface. Hence this high-density plasma component should be contained in a small volume at the base of the accretion stream, instead of being located in extended structures like coronal plasma.
We showed in Sect. 3.2 that, considering the characteristic volumes and densities for the high-density cool plasma component of CTTS, the optical depth (eq. 1) in some emission lines with large oscillator strength should be significantly larger than 1, producing detectable opacity effects. We found clear evidence of opacity effects in all the examined line ratios of the soft X-ray spectrum of MP Mus, produced by the high-density plasma at temperatures of a few MK. These lines are: the resonance lines produced by to shell transitions in the O vii and O viii ions (at Å and 18.97 Å, respectively), and the Fe xvii line at 15.01 Å. All these lines are significantly weaker than their predicted optically-thin intensities, a result which can be readily explained in terms of resonance scattering. We did not find evidence of optical depth effects in the X-ray emission from TW Hya.
We explored whether the observed opacity could be produced by coronal plasmas. Studies on large stellar surveys showed that optical depth effects from cool coronal plasma exist but are extremely rare (Ness et al., 2003; Testa et al., 2007). Quiescent plasma confined within coronal magnetic structures can hardly explain the observed non-negligible optical depths in CTTS. In fact the Rosner et al. (1978) model indicates loop semi-length of cm, for MK and . Such scale lengths are unrealistically small if compared to photospheric and chromospheric scale heights, and not large enough to account for the observed optical depth ( would be , in the center of the O vii line at 21.60 Å, assuming that the loop cross section has a radius smaller by a factor 10 than the loop semi-length). In principle flaring plasma, instead of quiescent plasma, could favor opacity effects. In fact standard models suggest that plasma density increases during flares, raising the opacity. Opacity effects have been searched in flaring coronal sources (e.g. Güdel et al., 2004), but they have been detected only a couple of times (Matranga et al., 2005; Rose et al., 2008). In those cases opacity affected Fe xvii lines formed at higher temperatures than the O vii and O viii lines. Moreover the soft X-ray light curve of MP Mus indicates that this emission does not originate from flaring plasma (Argiroffi et al., 2007).
We cannot reject altogether the hypothesis that the high-density cool plasma of MP Mus, showing opacity effects, originates from coronal plasma. However the alternative explanation, based on the hypothesis that this plasma is located in the post shock region at the base of the accretion stream, naturally explains the observed opacity effects. Therefore opacity by itself is not a prove of the nature of this plasma component, but strongly supports the shock-heated plasma hypothesis.
We find evidence of optical depth effects for MP Mus, and not for TW Hya, although optical depth effects were expected for both stars. Moreover the higher densities of the plasma of TW Hya, in comparison to MP Mus, should favor opacity effects, considering that the characteristic dimension of the plasma volume scales with , and hence . A tentative explanation of the lack of opacity effects from TW Hya could be related to the fact that resonance scattering depends on the geometry of the source and on the inclination angle under which the source is observed. In particular, the post-shock accretion hot-spot is likely to have quite different vertical and horizontal dimensions.
The volume occupied by the plasma heated in the accretion shock is defined by the stream cross-section and by the thickness of the hot post-shock region (see Fig. 5). is mainly determined by the post-shock velocity and by the plasma cooling time, and hence by the plasma density (e.g. Sacco et al., 2008a). Estimates of both and can be made from the soft X-ray emission of CTTS: observed electron densities range from to , a typical value of the responsible for the soft X-ray emission is . Assuming an infall velocity of and assuming that all the shock-heated plasma is contained in one shock area, we obtain: and . The difference of the horizontal and vertical dimensions does not depend on assuming only one shock area (Romanova et al., 2004), instead of assuming a few separated () accretion footpoints (Donati et al., 2007).
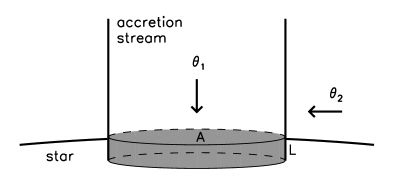
Therefore, the post-shock region has the vertical dimension significantly smaller than the other two dimensions. In Fig. 5 we display a schematic view of the footpoint of an accretion stream and the post shock region. The resonance scattering effect on the X-ray spectrum should be different depending on whether we observe the emitting plasma from the top or from the side (inclination angle or respectively). The latter is the one that favors optical depth effects, while in the former case these effects could even be negligible. The different opacity effects observed for MP Mus and TW Hya could be explained assuming that for the two stars the angle of the accretion footpoints differ significantly. TW Hya and MP Mus are viewed under quite different inclinations : TW Hya is almost pole-on (, e.g. Qi et al., 2004), while MP Mus should have , considering that its optical spectrum indicates and that its rotational period is d (Batalha et al., 1998). Assuming that the footpoints of the accretion streams are located at high latitudes on both stars (i.e. the magnetic dipole field is almost aligned with the rotational axis, Romanova et al., 2004), the orientation of TW Hya should be similar to the top-view ( in Fig. 5), while that of MP Mus to the side view (). We suggest that this important difference in viewing angle might explain the different optical depth obtained from the X-ray spectra of the two accreting stars. We cannot exclude that, although the inclination angles of two stars differ significantly, the two viewing angles of the post shock region are similar (e.g. if the accretion footpoint latitude is ). If it were the case, a different explanation would be required.
5.2 Soft X-rays from shock-heated plasma: EMD
The above results are consistent with the current prevailing view that accreting stars have two distinct plasma components: coronal plasma and shock-heated plasma, both contributing to different extents to the observed X-ray emission. To study the properties of these two plasma components it is necessary to identify and disentangle them with the help of both density and temperature diagnostics.
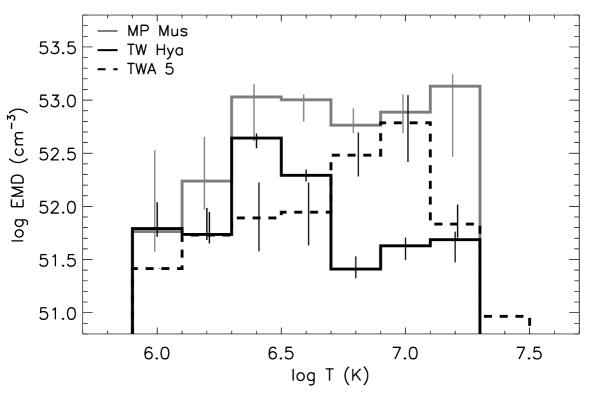
The EMD can also provide information on the nature of the X-ray emitting plasma. In Fig. 6 we show the EMD of the two CTTS MP Mus and TW Hya. To understand their EMD in terms of the coronal and accretion-driven hot plasma components, we compared them with the EMD of TWA 5 (Argiroffi et al., 2005), rebinned on the same grid used for the EMD of MP Mus and TW Hya.
The EMD reconstruction is based on the assumption that emission is optically thin. We know that this hypothesis is not true in the case of MP Mus. The lines affected are the resonance lines of O vii and O viii which constrain the cooler part of the EMD. Hence, it must be noted that the true EMD of MP Mus at low temperatures () is likely to be slightly higher than that inferred by a factor of 2 or so.
Inspecting Fig. 6 we found three main results:
-
1.
MP Mus and TW Hya show a peak in their at low temperature (); this peak is not present in the of TWA 5;
-
2.
MP Mus and TWA 5 have a strong peak at high temperature (), while for TW Hya that peak, even if marginally detected, is significantly lower compared to those of the other two stars;
-
3.
the relative strength of cool and hot peak in MP Mus and TW Hya is significantly different.
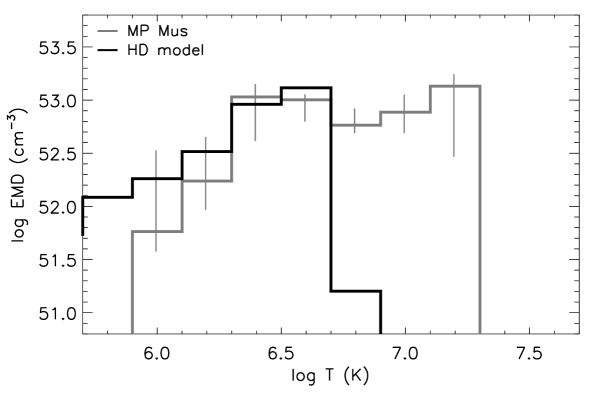
Sacco et al. (2008a) performed hydrodynamic simulations, tuned to the MP Mus case, to study the shock formed by an accretion stream impacting on a chromosphere and its X-ray emission. In Fig. 7 we show the of MP Mus together with the time-averaged of the simulation by Sacco et al. (2008a). The normalization of the model EMD was derived assuming that the soft X-ray emission is entirely produced by the shock-heated plasma component. This is reasonable, considering the O vii line triplets: any contribution from coronal plasma, assuming that it has low density, cannot exceed 20% (Argiroffi et al., 2007). The important result is that the model EMD has a pronounced peak at MK, which is exactly the feature that we observe in MP Mus and TW Hya, while no cool peak is present in the EMD of the WTTS TWA 5.
The cool peak that we found in the EMD of the two CTTS TW Hya and MP Mus explains, in terms of EMD, the soft flux excess observed in the X-ray spectra of CTTS in the XEST survey (Güdel & Telleschi, 2007; Telleschi et al., 2007).
These results suggest that the shape of the EMD in CTTS can be used to determine whether soft emission can be produced by accretion shocks, also in those cases in which the electron density provided by the O vii triplet is compatible with coronal plasma (i.e. the case of T Tau, Güdel et al., 2007), or when the vital diagnostic intercombination and forbidden lines are of poor quality.
5.3 Soft X-rays from shock-heated plasma: mass accretion rate
The comparison between the EMD of MP Mus with that of the WTTS TWA 5, and the results obtained from the hydrodynamical simulations performed by Sacco et al. (2008a) shows that the soft X-ray emission of MP Mus can be entirely explained in terms of the plasma heated in the accretion shock. The mass accretion rate provided by the simulations, , agrees with that derived on the basis of a simplified model by Argiroffi et al. (2007). However the value derived from the H line width exceeds that obtained from X-rays, , by more than one order of magnitude. This discrepancy was noted also by Drake (2005) and Günther et al. (2007) for TW Hya. A similar situation arises for BP Tau, for which mass accretion rates were derived from X-ray data by Schmitt et al. (2005). We list in Table 5 mass accretion rates derived from X-ray data for these three CTTS, compared to those derived from other accretion indicators (i.e. UV or H). In all three cases the values are lower by a factor 10 (or even more) than the corresponding value derived from UV or optical data.
We note that the observed fluxes of the strongest lines were used to derive , assuming optically thin emission. Since we found that the X-ray emission produced by the shock-heated plasma, in MP Mus, is not optically thin, the accretion rate of MP Mus derived from X-rays, ( derived from the Ly and resonance lines of O viii and O vii, Argiroffi et al., 2007; Sacco et al., 2008a), is likely underestimated by a factor of 2 or so—much too little to reconcile the discrepancy between the values.
The accretion flow is likely composed of several funnels, each isolated from the adjacent one because the strong magnetic field inhibits thermal conduction and mass motion perpendicular to its lines. Each funnel is characterized by a given density and infall velocity. Both the density and velocity determine the amount of observable X-rays produced by the accretion shock of each funnel. As explained below a distribution of density and velocity might explain the observed discrepancy.
Drake (2005) argued on the basis of accretion stream ram pressure and shock stand-off height that more dense streams would form smaller, less extended shocks buried too deeply in the photosphere to be observed from most inclination angles. X-rays would then be reprocessed to lower energy by the surrounding photospheric gas. The observed accretion-shocked plasma of MP Mus should have a stand-off height of a cm or so (e.g. Argiroffi et al., 2007; Sacco et al., 2008a)—sufficient to lie well above the photosphere and be visible with minimum absorption from the stellar atmosphere. It is possible that there are other streams of accretion carrying the majority of the inflowing mass flux that are much more dense and that do get obscured from the line-of-sight by absorption. X-ray emission from TW Hya apparently does not fit in this scenario: it is produced by a very high-density plasma, but it suffers low absorption. To solve this issue, Drake (2005) suggested that the plasma density of TW Hya could be slightly overestimated, because of UV radiation and its influence on the He-like triplets.
Another effect might also contribute to the observed discrepancy. Romanova et al. (2004) and Gregory et al. (2006) inferred that accreting material arrives at the base of the accretion stream with a large distribution of infall velocities. Therefore assuming that different funnels (or different part of the same funnel) may have different velocities, then each funnel will produce a post shock region with a temperature depending only on the relevant velocity. In such case, funnels with high velocity would produce hot post shock plasma, and, hence, X-ray emission, while funnels with reduced velocity might produce post-shock plasma of insufficient temperature to contribute to the X-ray emission.
5.4 Coronal X-ray luminosity in CTTS
The presence of coronal plasma for both TW Hya and MP Mus is indicated by their observed flaring activity and by the presence of a hot plasma component detected in their EPIC spectra, and inferred by the presence of emission lines produced by hot plasma ( MK, Kastner et al., 2002; Stelzer & Schmitt, 2004; Argiroffi et al., 2007). Assuming that the cool peak in the EMD of MP Mus and TW Hya is entirely due to accretion, then their coronal component can be evaluated considering only the hottest part of their EMD. If we take into account only , the coronal X-ray luminosity of MP Mus and TW Hya are and , respectively, in the keV band. The coronal luminosity of TW Hya is significantly reduced if compared to its whole X-ray luminosity, , while for MP Mus the corona emits % of its entire X-ray luminosity. With these new estimates for the coronal , MP Mus and TW Hya have , and respectively. Both of these values, but especially that of TW Hya, are significantly lower than previous estimates of their coronal to bolometric luminosities (Mamajek et al., 2002; Kastner et al., 1997), and place the two CTTS under the saturation level , as is usual for CTTS (e.g Preibisch et al., 2005). This suggests that, when the X-ray luminosity is to be used as activity indicator, it would be preferable to compute it excluding the plasma components at MK.
6 Conclusions
In this work we presented an analysis of the high-resolution X-ray spectra, obtained with XMM-Newton/RGS, of the two CTTS TW Hya and MP Mus. For MP Mus we detected significant resonance scattering in the O viii Ly and O vii resonance lines, which are produced by the high-density plasma at temperatures of a few MK. No resonance scattering was detected in the spectrum of TW Hya. This result strongly supports the hypothesis that this plasma is formed by the shock at the base of the accretion column which is likely viewed obliquely. The different optical depths observed for TW Hya and MP Mus could be explained in terms of different viewing angle of their accretion shocks.
We also derived the EMD for TW Hya and MP Mus, finding that they both show a peak at MK, in addition to the hot peak at MK typical of coronal plasma on magnetically active stars. The cool peak is perfectly described by plasma heated in an accretion shock (Sacco et al., 2008a). The same peak is not present in the plasma of the non-accreting young star TWA 5. The identification of this EMD peak as due to shock-heated plasma allows us to assess the characteristics of the true coronal plasma and its luminosity. In particular, the coronal X-ray luminosity of TW Hya is less than 20% of its whole X-ray luminosity in the keV band.
Soft X-ray emission can be used to compute the mass accretion rate. We compared the mass accretion rates derived from X-ray data, , with those obtained from UV and optical indicators, , finding that is underestimated by, at least, a factor 10. Two possible explanations for this are that some accretion streams are most dense and form shocks that are located too deep in the stellar atmosphere to be observed, and that some plasma in accretion streams might not attain the full free-fall velocity required to form X-ray emitting shocks.
Acknowledgements.
The authors thank the referee, M. Güdel, for comments that improved the paper. CA, AM, GP, SS, and BS acknowledge partial support for this work from contract ASI-INAF I/023/05/0 and from the Ministero dell’Università e della Ricerca. JJD was supported by NASA contract NAS8-39073 to the Chandra X-ray Center during the course of this research, and thanks the director, H. Tananbaum, and CXC science team for advice and support. JLS acknowledges financial support by the projects S-0505/ESP-0237 (ASTROCAM) of the Comunidad Autonoma de Madrid and AYA2008-06423-C03-03 of the Spanish Ministerio de Ciencia y Tecnología. Based on observations obtained with XMM-Newton, an ESA science mission with instruments and contributions directly funded by ESA Member States and NASA.References
- Acton (1978) Acton, L. W. 1978, ApJ, 225, 1069
- Alencar & Batalha (2002) Alencar, S. H. P. & Batalha, C. 2002, ApJ, 571, 378
- Ardila & Basri (2000) Ardila, D. R. & Basri, G. 2000, ApJ, 539, 834
- Argiroffi et al. (2007) Argiroffi, C., Maggio, A., & Peres, G. 2007, A&A, 465, L5
- Argiroffi et al. (2005) Argiroffi, C., Maggio, A., Peres, G., Stelzer, B., & Neuhäuser, R. 2005, A&A, 439, 1149
- Asplund et al. (2005) Asplund, M., Grevesse, N., & Sauval, A. J. 2005, in ASP Conf. Ser. 336: Cosmic Abundances as Records of Stellar Evolution and Nucleosynthesis, ed. T. G. Barnes, III & F. N. Bash, 25
- Audard et al. (2001) Audard, M., Behar, E., Güdel, M., et al. 2001, A&A, 365, L329
- Batalha et al. (2002) Batalha, C., Batalha, N. M., Alencar, S. H. P., Lopes, D. F., & Duarte, E. S. 2002, ApJ, 580, 343
- Batalha et al. (1998) Batalha, C. C., Quast, G. R., Torres, C. A. O., et al. 1998, A&AS, 128, 561
- Bertout et al. (1988) Bertout, C., Basri, G., & Bouvier, J. 1988, ApJ, 330, 350
- Calvet & Gullbring (1998) Calvet, N. & Gullbring, E. 1998, ApJ, 509, 802
- Donati et al. (2007) Donati, J.-F., Jardine, M. M., Gregory, S. G., et al. 2007, MNRAS, 380, 1297
- Drake (2005) Drake, J. J. 2005, in ESA Special Publication, Vol. 560, 13th Cambridge Workshop on Cool Stars, Stellar Systems and the Sun, ed. F. Favata, G. A. J. Hussain, & B. Battrick, 519
- Flaccomio et al. (2003) Flaccomio, E., Micela, G., & Sciortino, S. 2003, A&A, 397, 611
- Getman et al. (2008) Getman, K. V., Feigelson, E. D., Broos, P. S., Micela, G., & Garmire, G. P. 2008, ApJ, 688, 418
- Gondoin (2004) Gondoin, P. 2004, A&A, 426, 1035
- Gondoin (2005) Gondoin, P. 2005, A&A, 431, 1027
- Gregorio-Hetem et al. (1992) Gregorio-Hetem, J., Lepine, J. R. D., Quast, G. R., Torres, C. A. O., & de La Reza, R. 1992, AJ, 103, 549
- Gregory et al. (2006) Gregory, S. G., Jardine, M., Simpson, I., & Donati, J.-F. 2006, MNRAS, 371, 999
- Güdel et al. (2004) Güdel, M., Audard, M., Reale, F., Skinner, S. L., & Linsky, J. L. 2004, A&A, 416, 713
- Güdel et al. (2007) Güdel, M., Skinner, S. L., Mel’Nikov, S. Y., et al. 2007, A&A, 468, 529
- Güdel & Telleschi (2007) Güdel, M. & Telleschi, A. 2007, A&A, 474, L25
- Gullbring (1994) Gullbring, E. 1994, A&A, 287, 131
- Gullbring et al. (1998) Gullbring, E., Hartmann, L., Briceno, C., & Calvet, N. 1998, ApJ, 492, 323
- Günther et al. (2006) Günther, H. M., Liefke, C., Schmitt, J. H. M. M., Robrade, J., & Ness, J.-U. 2006, A&A, 459, L29
- Günther et al. (2007) Günther, H. M., Schmitt, J. H. M. M., Robrade, J., & Liefke, C. 2007, A&A, 466, 1111
- Jayawardhana et al. (2006) Jayawardhana, R., Coffey, J., Scholz, A., Brandeker, A., & van Kerkwijk, M. H. 2006, ApJ, 648, 1206
- Kashyap & Drake (1998) Kashyap, V. & Drake, J. J. 1998, ApJ, 503, 450
- Kashyap & Drake (2000) Kashyap, V. & Drake, J. J. 2000, Bulletin of the Astronomical Society of India, 28, 475
- Kastner et al. (2002) Kastner, J. H., Huenemoerder, D. P., Schulz, N. S., Canizares, C. R., & Weintraub, D. A. 2002, ApJ, 567, 434
- Kastner et al. (1997) Kastner, J. H., Zuckerman, B., Weintraub, D. A., & Forveille, T. 1997, Science, 277, 67
- Koenigl (1991) Koenigl, A. 1991, ApJ, 370, L39
- Mamajek et al. (2002) Mamajek, E. E., Meyer, M. R., & Liebert, J. 2002, AJ, 124, 1670
- Matranga et al. (2005) Matranga, M., Mathioudakis, M., Kay, H. R. M., & Keenan, F. P. 2005, ApJ, 621, L125
- Mohanty et al. (2003) Mohanty, S., Jayawardhana, R., & Barrado y Navascués, D. 2003, ApJ, 593, L109
- Muzerolle et al. (2000) Muzerolle, J., Calvet, N., Briceño, C., Hartmann, L., & Hillenbrand, L. 2000, ApJ, 535, L47
- Natta et al. (2004) Natta, A., Testi, L., Muzerolle, J., et al. 2004, A&A, 424, 603
- Ness et al. (2003) Ness, J.-U., Schmitt, J. H. M. M., Audard, M., Güdel, M., & Mewe, R. 2003, A&A, 407, 347
- Ness et al. (2002) Ness, J.-U., Schmitt, J. H. M. M., Burwitz, V., et al. 2002, A&A, 394, 911
- Neuhäuser et al. (1995) Neuhäuser, R., Sterzik, M. F., Schmitt, J. H. M. M., Wichmann, R., & Krautter, J. 1995, A&A, 297, 391
- Pizzolato et al. (2003) Pizzolato, N., Maggio, A., Micela, G., Sciortino, S., & Ventura, P. 2003, A&A, 397, 147
- Preibisch et al. (2005) Preibisch, T., Kim, Y.-C., Favata, F., et al. 2005, ApJS, 160, 401
- Qi et al. (2004) Qi, C., Ho, P. T. P., Wilner, D. J., et al. 2004, ApJ, 616, L11
- Raassen et al. (2003) Raassen, A. J. J., Mewe, R., Audard, M., & Güdel, M. 2003, A&A, 411, 509
- Raassen et al. (2002) Raassen, A. J. J., Mewe, R., Audard, M., et al. 2002, A&A, 389, 228
- Raassen et al. (2007) Raassen, A. J. J., Mitra-Kraev, U., & Güdel, M. 2007, MNRAS, 379, 1075
- Robrade & Schmitt (2007) Robrade, J. & Schmitt, J. H. M. M. 2007, A&A, 473, 229
- Romanova et al. (2004) Romanova, M. M., Ustyugova, G. V., Koldoba, A. V., & Lovelace, R. V. E. 2004, ApJ, 610, 920
- Rose et al. (2008) Rose, S. J., Matranga, M., Mathioudakis, M., Keenan, F. P., & Wark, J. S. 2008, A&A, 483, 887
- Rosner et al. (1978) Rosner, R., Tucker, W. H., & Vaiana, G. S. 1978, ApJ, 220, 643
- Saba et al. (1999) Saba, J. L. R., Schmelz, J. T., Bhatia, A. K., & Strong, K. T. 1999, ApJ, 510, 1064
- Sacco et al. (2008a) Sacco, G. G., Argiroffi, C., Orlando, S., et al. 2008a, A&A, 491, L17
- Sacco et al. (2008b) Sacco, G. G., Franciosini, E., Randich, S., & Pallavicini, R. 2008b, A&A, 488, 167
- Sanz-Forcada et al. (2003) Sanz-Forcada, J., Maggio, A., & Micela, G. 2003, A&A, 408, 1087
- Schmitt et al. (2005) Schmitt, J. H. M. M., Robrade, J., Ness, J.-U., Favata, F., & Stelzer, B. 2005, A&A, 432, L35
- Smith et al. (2001) Smith, R. K., Brickhouse, N. S., Liedahl, D. A., & Raymond, J. C. 2001, ApJ, 556, L91
- Stelzer & Schmitt (2004) Stelzer, B. & Schmitt, J. H. M. M. 2004, A&A, 418, 687
- Telleschi et al. (2007) Telleschi, A., Güdel, M., Briggs, K. R., Audard, M., & Scelsi, L. 2007, A&A, 468, 443
- Testa et al. (2004a) Testa, P., Drake, J. J., & Peres, G. 2004a, ApJ, 617, 508
- Testa et al. (2004b) Testa, P., Drake, J. J., Peres, G., & DeLuca, E. E. 2004b, ApJ, 609, L79
- Testa et al. (2007) Testa, P., Drake, J. J., Peres, G., & Huenemoerder, D. P. 2007, ApJ, 665, 1349
- Torres et al. (2006) Torres, C. A. O., Quast, G. R., da Silva, L., et al. 2006, A&A, 460, 695
- Torres et al. (2008) Torres, C. A. O., Quast, G. R., Melo, C. H. F., & Sterzik, M. F. 2008, Young Nearby Loose Associations, ed. B. Reipurth, 757
- Uchida & Shibata (1984) Uchida, Y. & Shibata, K. 1984, PASJ, 36, 105