Nuclear EMC Effect in a Statistical Model
Abstract
A simple statistical model in terms of light-front kinematic variables is used to explain the nuclear EMC effect in the range , which was constructed by us previously to calculate the parton distribution functions (PDFs) of the nucleon. Here, we treat the temperature as a parameter of the atomic number , and get reasonable results in agreement with the experimental data. Our results show that the larger , the lower thus the bigger volume , and these features are consistent with other models. Moreover, we give the predictions of the quark distribution ratios, i.e., , , and , and also the gluon ratio for iron as an example. The predictions are different from those by other models, thus experiments aiming at measuring the parton ratios of antiquarks, strange quarks, and gluons can provide a discrimination of different models.
keywords:
statistical model, EMC effect, parton distribution functions, nucleon structurePACS:
12.40.Ee, 13.60.Hb, 24.85.+p, 25.30.Mr, ,
1 Introduction
Deep inelastic scattering (DIS) process is an efficient tool to detect the nucleon structure, and the high-energy charged lepton can also reveal the parton distributions in the nuclear environment. The nucleons in a nucleus were initially thought to be highly insensitive to their surroundings, and the only nuclear effect in DIS was believed to be Fermi motion at large . However, in 1982, the European Muon Collaboration at CERN discovered that nucleons inside a nucleus have a remarkably different momentum configuration as expected, i.e., the structure function for a bound nucleon differs from that for an isolated one significantly [1, 2, 3], which was named the nuclear EMC effect (for reviews, see, e.g., Refs. [4, 5, 6, 7, 8, 9, 10]). The existence of the unexpected effect opens a window onto the behavior of quarks at nuclear scale, thus it offers the opportunity to use nuclear targets for exploring aspects of quark dynamics.
In order to account for the EMC effect, there have been many efforts and insights implemented in various models, e.g., the cluster model [11, 12, 13, 14, 15, 16], the pion excess model [12, 17, 18, 19, 20, 21], the -rescaling model [22, 23, 24], the -rescaling model [25, 26, 27], the nucleon swelling model [15, 23], and the deconfinement model [12, 28]. In some sense, most of these available models provide a fairly good description, instead of an explanation, to the phenomena. The cluster model explains the EMC effect by introducing different ways of packing the constituents into clusters of 3 () quarks, to mimic the field acting on partons caused by the nuclear mediate. This was suggested by Pirner et al. [11], and first applied to the EMC effect by Jaffe [12]. Later it was discussed in detail by Carlson and Havens [13]. Furthermore, Barshay and Rein [14] provided a physical picture for this scenario and predicted specific dependence. In the pion excess model, Smith [17] suggested that iron contains more pions which carry 5% of the momentum, and Ericson and Thomas [18] showed that the EMC enhancement in the region can be reproduced with the excess pions if an attractive force was assumed. Close, Jaffe et al. [25, 26, 27] first discovered that the difference between the structure functions for a bound nucleon and that for a free one can be ascribed to the change of the effective , which was named the -rescaling model, and it was explained that these distinctions arise as a result of the difference in the scale of confinement of the nucleon.
On the other hand, due to the complicated non-perturbative effect, it is still difficult to calculate the parton distribution functions (PDFs) of the free nucleon absolutely from the first principle theory of the quantum chromodynamics (QCD) at present. Various models according to the spirit of QCD have been brought forward, therein statistical ones, providing intuitive appeal and physical simplicity, have made amazing success [29, 30, 31, 32, 33, 34, 35, 36, 37, 38, 39, 40, 41, 42, 43, 44, 45, 46, 47, 48, 49, 50, 51, 52, 53, 54, 55, 56, 57, 58, 59]. Actually, as can be speculated, with partons bound in the wee volume of the nucleon, not only the dynamic, but also the statistical properties, for example, the Pauli exclusion principle, should have important effect on PDFs. Angelini and Pazzi [29, 30], as pioneers, found that the nucleon valence quark distribution has a thermodynamical behavior for with the temperature decreasing for different . Cleymans and Thews [31, 32, 33] explored a statistical way to generate compatible PDFs. Mac and Ugaz [34] incorporated first order QCD correction, and afterwards Bhalerao et al. [35, 36, 37, 38, 39] introduced finite-size correction; they both referred to the infinite-momentum frame (IMF). Devanathan et al. [40, 41, 42] proposed a thermodynamical bag model which evolves as a function of , and the structure functions they got have correct asymptotic behavior; in addition, they parametrized on and exhibited the scaling behavior. Bourrely, Soffer, and Buccella [43, 44, 45, 46, 47, 48, 49, 50, 51, 52] developed a new form of statistical parametrization, and by incorporating QCD evolution they got indeed remarkable PDFs. Otherwise, Zhang et al. [53, 54, 55] constructed a model using the principle of balance without any free parameter, and the Gottfried sum they got is in surprisingly agreement with experiments. Later, Singh and Upadhyay [56] extended this model to have spin considered with modifications. Alberg and Henley [57] tracked the detailed balance model for a hadron composed of quark and gluon Fock states and obtained parton distributions for the proton as well as the pion. Recently, Trevisan et al. [58] presented a statistical model with a confining potential and took gluon splitting into account further.
The statistical idea is also applied to the nuclear EMC effect. Angelini and Pazzi [60] introduced thermodynamical analysis to the EMC effect, and by utilizing the ratio of valence quark distributions at different temperatures and confinement volumes, they fit data well. Afterwards, Li and Peng [61] discussed the EMC effect using the Fermi-Dirac distribution for fermions and Bose-Einstein distribution for gluons. Further, Rożynek and Wilk [62] combined nuclear Fermi motion with statistical effect [53, 54, 55] to account for the rise at large .
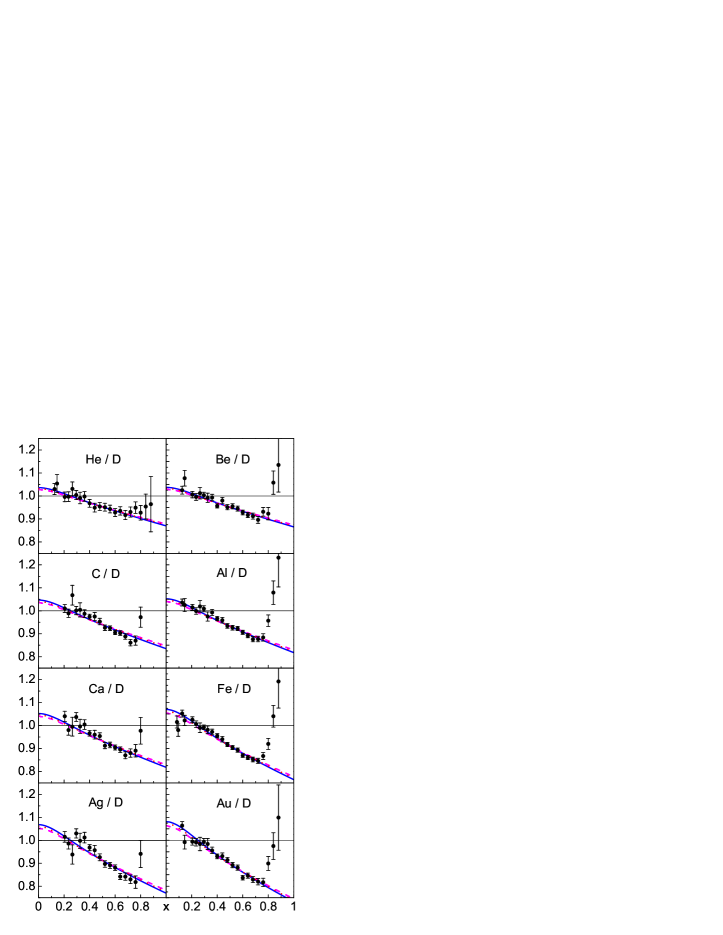
In Ref. [63], we performed a pure statistical model in terms of light-front kinematic variables, without any arbitrary parameter or extra corrected term put by hand, and obtained the analytic PDFs of free nucleons, i.e., the proton and the neutron. The results imply that the statistical effect is important to some aspects of the nucleon structure, and the simpleness and intuition of the model encourage us to apply it to the EMC effect. Here, we introduce the temperature as a parameter versus the atomic number , and the fit to the experimental data in the region is rather reasonable, illustrated in Fig. 1, which indicating that the statistical effect may be an important source to the EMC phenomenon. But in the high- region, where Fermi motion dominates to the effect, which is not considered in our model, our fit is below the data as expected. The temperature we get is about 12 MeV lower in bound nucleons than in free ones, and jointly the volume is bigger about 5%10%. Moreover, we also give the predictions of the quark distribution ratios, i.e., , , and , and the gluon ratio for iron as an example.
2 Statistical approach
We assume that the nucleon is a thermal system in equilibrium, made up of free partons (quarks, anti-quarks, and gluons), and the quarks and anti-quarks satisfy the Fermi-Dirac distribution while the gluons obey the Bose-Einstein distribution. Instead of boosting the distribution functions to the IMF [34, 35, 36, 37, 38, 39], we transform them in terms of light-front kinematic variables in the nucleon rest frame, and get -dependent PDFs analytically [63]
| (1) | |||||
with the upper sign for fermions (quarks, anti-quarks), and nether sign for bosons (gluons); is the degree of color-spin degeneracy, which is 6 for quark (anti-quark) and 16 for gluon; is the corresponding chemical potential, while for anti-quark , and for gluon ; is the light-front momentum fraction of the nucleon carried by the specific parton; is the mass of the nucleon, and the value is taken as 938.27 MeV; and is the polylogarithm function, defined as . Note that the analytic expression above is different from those attained in the previous statistical models [31, 32, 33, 34, 35, 36, 37, 38, 39, 40, 41, 42].
The expression of the PDFs we derived is available for all the partons with mass , however, for simplicity, in Ref. [63], we mainly focused on the , flavors, which can be viewed massless as a quite good approximation. In this paper, we will take a further consideration of the flavor, whose mass is around 100 MeV, so the constraint should be fulfilled [65]. For convenience of a universal manipulation to all partons, we have multiplied explicitly to the expression of the PDFs, i.e., Eq. (1), a factor of the step-function, .
In practice, the PDFs in a certain system should be constrained with some conversation laws. For example, in the proton, they are
| (2) |
| (3) |
| (4) |
where , in Eq. (4), denotes to , , , , if just the , flavors and the gluon are considered, and to , , , , , , when the flavor is appended. However, the contribution of the heavier flavors, the quark for instance, is negligible [63].
There are four unknown parameters , , , and three constraints, thus for a fixed , the rest parameters , , can be determined uniquely, whereafter we can obtain all the PDFs. Worthy to mention that, including the flavor will not introduce any extra parameter, due to .
After the PDFs of the proton have been determined, we can get the PDFs of the neutron as well, using the - isospin symmetry, i.e., , , , , , and .
Eqs. (2)-(4) should be satisfied for free nucleons, as well as the ones immersing in the nuclear environment. Here we mainly assume that a nucleon under a different nuclear circumstance is equivalent to at a different temperature, and subsequently along with different , , and .
Also note that, the PDFs and the nucleon structure function
| (5) |
where is the charge of the parton of flavor , as well as the Gottfried sum
| (6) |
are actually all -dependent.
Afterward, we perform the numerical calculation to determine the temperatures of the nucleons in different nuclear environment, first in deuteron, then in other nuclei. Since deuteron is a weakly bound system, the structure function of it can be taken as a free isoscalar nucleon approximately, i.e., . In practice, we figure out , i.e., the temperature of nucleon in deuteron by using , and then fit to available experimental data in the region where the EMC effect dominates, thus the parameters of the nucleon in the nucleus with atomic number can be determined.
3 Results and Discussions
Numerical calculation is performed under three different conditions below
-
•
just considering the , flavors and the gluon,
-
•
including the flavor and taking the mass of quark MeV,
-
•
including the flavor and taking MeV;
here 130 MeV and 70 MeV are respectively the upper and lower limit of the mass of quark suggested in PDG2008 [66].
In practice, as mentioned above, we figure out the temperature of the nucleon in deuterium firstly, at which the Gottfried sum equals to the experimental value [67, 68]. According to the three different conditions listed above, the results are a bit different
-
•
46.84 MeV when only , and are considered,
-
•
42.53 MeV when , , and are considered with MeV,
-
•
40.08 MeV when , , and are considered with MeV.
Then we fit the analytic expression to various experimental data from Ref. [64] in the region under the constraints aforementioned, and we attain the corresponding temperatures of the nucleons inside various nuclei. The fitting curves of some nuclei are shown in Fig. 1. We can see that, when decreases from 0.2 to about 0.1, our curves predict the right trend and fit to the experimental data roughly; but conflicted with the data, as decreases further from 0.1, our curves still go up and stand as a constant slightly above unity when approaches 0. In the high- direction, the experimental points reveal an apparent rise from about 0.8 as increases, however, our curves depart from them and monotonously go down, caused by the neglect of Fermi motion of the nucleons.
As generally recognized now, the fact that is referred to with different terms: the behavior of in the region is often referred to as the “(special) EMC effect”, where the ratio goes down straight to lower than unity; in the region 0.1, the ratio is smaller than unity, named “shadowing”, and in the range , the ratio shows an enhancement and becomes a little larger than unity, called “anti-shadowing”; further, in the region 0.8, the ratio has a precipitous rise and grows to above unity, where is the mentioned “Fermi motion” region. Here, our model describes the “EMC effect” reasonably but fails in other regions, like most of the other models not considering the effect of “Fermi motion” and “shadowing effect”.
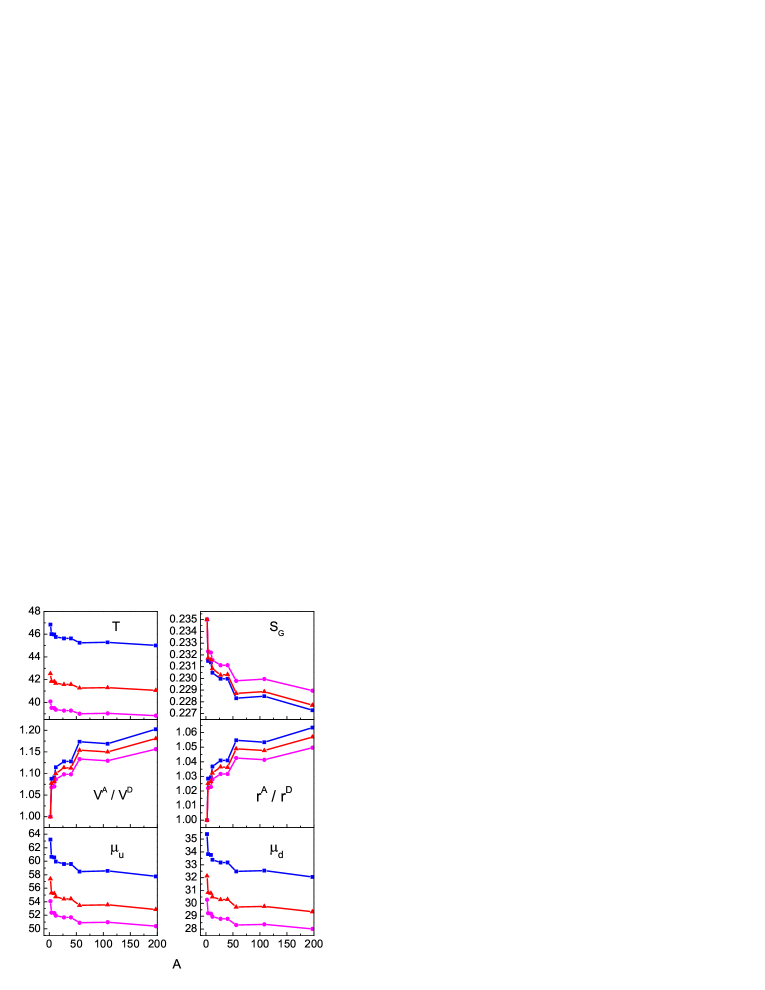
Once the temperatures of the nuclei are determined, the other parameters are also fixed simultaneously concerning Eqs. (2)-(4), and the values are listed in Tables 1, 2, 3 respectively according to the three different conditions noted above. For an intuitive view, we present the physical quantities , , , , , and in Fig. 2, where represents the radius of nucleon from the model. We can see clearly that the nucleus with larger has a lower temperature , jointly a larger volume and smaller quark chemical potentials , .
The features derived above have an self-consistent explanation in a physical picture. When increases, the volume, in which the partons move, becomes larger, thus the average kinetic energy of the partons decreases, due to the uncertainty principle. This agrees with the corresponding lower property. On the other hand, as increases, the number densities of quarks decrease, thus the chemical potentials, which are monotonic functions of the corresponding number densities, become lower.
Our result that the volume of the nucleon in nuclei becomes larger is qualitatively consistent with other models, such as the -rescaling model and the nucleon swelling model, though the starting point of our model is different. The result we derive, 2 MeV, is very close to MeV given in Ref. [60], and our enhancement in is about half of that presented in Ref. [61]. Worthy to note that, including the flavor and taking different masses of it lead to some slightly difference in results, so the flavor is considered as a modification here.
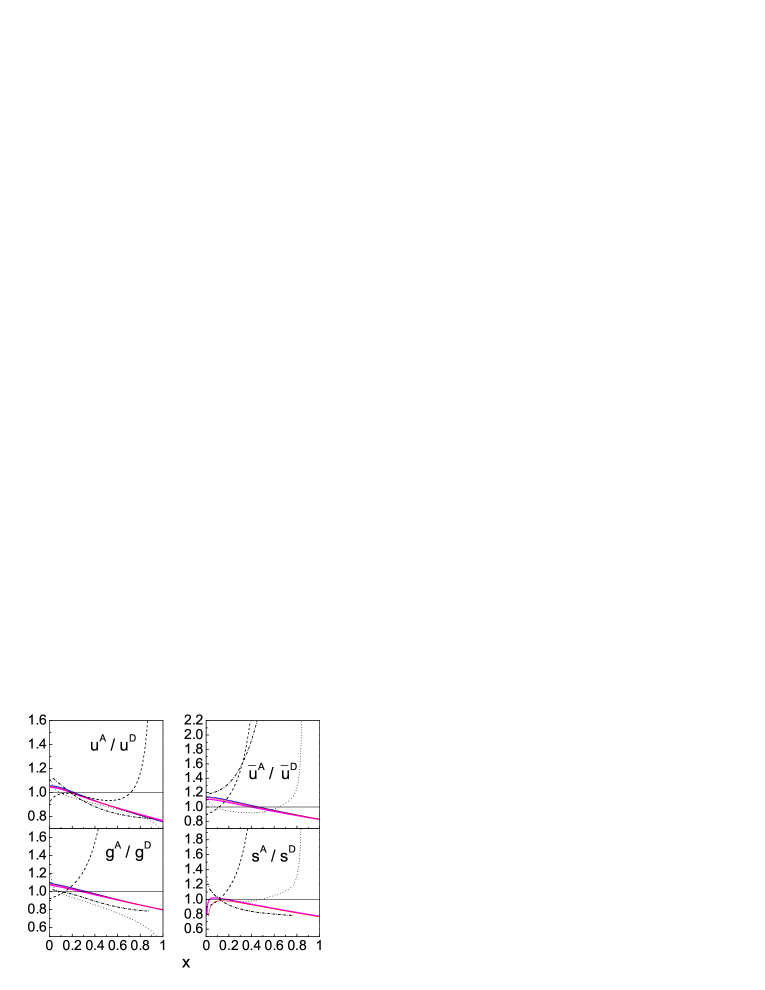
In addition, as parameters are determined, we can give explicitly the predictions of PDFs of the nucleons inside different nuclei. The ratios of the PDFs of iron to deuterium are depicted in Fig. 3 for example. Note that, the distribution of flavor, not presented in Fig. 3, is just the same as that of flavor, for that all nuclei here, including iron, have been adjusted to be isospin scalar. The solid normal, thick, and thin curves correspond respectively to our results in the three conditions mentioned above, and they almost overlap in each sub figure, though the parameters of them are a bit different (see Tables 1, 2, 3). The sub figure of in Fig. 3 lacks the normal solid curve, for it is the condition where no flavor is included.
The ratios in Fig. 3 are only predicted in the range since we only fit to the data in this special region and do not include other effect. We can see that the ratios are monotonous of , indicating more low- momentum configuration in iron than in deuterium, which is in consistency with our intuition of a lower temperature in iron.
And also, we present the fractions of momentum and structure function carried by various partons under the three conditions respectively in Table 4. From the results, we can see that as getting smaller, quarks take up more fractions of momentum and structure function, and the contributions from which are somehow considerable. The case with no quarks can be considered as a limit for .
Together with our results for iron, the predicted PDFs of other models, i.e., the cluster model, the pion excess model, and the -rescaling model, are also illustrated in Fig. 3.
For the cluster model, here we consider -quark cluster only, and employ the PDFs given in Ref. [16]. Also we assume that the probability to form a -quark cluster in iron equals to [13].
Concerning the pion model, we adopt the CTEQ6M parametrization [69] for nucleon and the RMS parametrization [20] for pion, then the PDFs in nuclei read [17, 18, 70]
| (7) |
where and are respectively the parton distributions for the free pion and nucleon, and we make use of the “toy model” in Ref. [21] to give the probability and of finding pionic and normal nucleonic content respectively in iron.
And as to the -rescaling model, we again take the CTEQ6M parametrization [69] and take [27] in the PDFs below [25, 26, 27]
| (8) |
As can be seen in Fig. 3, the predicted PDFs differ significantly from model to model. And to distinguish various models and look into the immanent reason of the EMC effect, we suggest more experiments to identify the PDFs in nuclei, especially for anti-quarks, the strange quark, and the gluon. The dimuon yield in Drell-Yan process [71, 72] can detect the sea content in nuclei. Ref. [70] also advised that the semi-inclusive hadron productions in DIS are sensitive to the sea quark content. Further, the process of charmed quarks production in DIS can probe the gluon constituent via the photon-gluon fusion mechanism, and the strange quark content can be detected in - process.
4 Summary
In this paper, we utilize a concise statistical model to mimic the nuclear EMC effect. The statistical model was used previously to calculate the parton distribution functions (PDFs) of the nucleon in terms of light-front kinematic variables with no arbitrary parameter or extra corrected term [63]. Here, we treat the nucleon temperature as a parameter of the atomic number and find that the nuclear effect can be explained as a shift of — as increases, gets lower and consequently the volume becomes larger; the larger , the more significant influence. These features are consistent with other models, for example, the -rescaling model and the nucleon swelling model.
Further, we present the predictions of the quark distribution ratios, i.e., , , and , and also the gluon ratio for iron as an example. These predictions are rather different from those of other available models. Further experiments are expected to provide more information of the PDFs in nuclei, especially for anti-quarks, the strange quark, and the gluon, then we can test various models better.
Though there is only one free parameter, i.e., the nucleon temperature , in our model, the descriptions to the experimental data are reasonable in the EMC domain . We suggest that the statistical property may be a considerable source to the nuclear EMC effect, and expect to have more relevant experiments to test the predictions.
Acknowledgment
This work is partially supported by National Natural Science Foundation of China (No. 10721063) and by the Key Grant Project of Chinese Ministry of Education (No. 305001). It is also supported by Hui-Chun Chin and Tsung-Dao Lee Chinese Undergraduate Research Endowment (Chun-Tsung Endowment) at Peking University, and by National Fund for Fostering Talents of Basic Science (Nos. J0630311, J0730316).
References
- [1] J.J. Aubert et al., Phys. Lett. B 123 (1983) 275.
- [2] J.J. Aubert et al., Nucl. Phys. B 293 (1987) 740.
- [3] A. Bodek et al., Phys. Rev. Lett. 50 (1983) 1431.
- [4] E.L. Berger and F. Coester, Ann. Rev. Nucl. Part. Sci. 37 (1987) 463.
- [5] L.L. Frankfurt and M.I. Strikman, Phys. Rep. 160 (1988) 235.
- [6] V. Barone and E. Predazzi, Ann. Phys. -Paris 12 (1987) 525.
- [7] M. Arneodo, Phys. Rep. 240 (1994) 301.
- [8] D.F. Geesaman, K. Saito, and A.W. Thomas, Ann. Rev. Nucl. Part. Sci. 45 (1995) 337.
- [9] G. Piller and W. Weise, Phys. Rep. 330 (2000) 1.
- [10] P.R. Norton, Rep. Prog. Phys. 66 (2003) 1253.
- [11] H.J. Pirner and J.P. Vary, Phys. Rev. Lett. 46 (1981) 1376.
- [12] R.L. Jaffe, Phys. Rev. Lett. 50 (1983) 228.
- [13] C.E. Carlson and T.J. Havens, Phys. Rev. Lett. 51 (1983) 261.
- [14] S. Barshay and D. Rein, Z. Phys. C 46 (1990) 215.
- [15] J. Dias de Deus, M. Pimenta, and J. Varela, Z. Phys. C 26 (1984) 109.
- [16] U. Sukhatme, G. Wilk, and K.E. Lassila, Z. Phys. C 53 (1992) 439.
- [17] C.H.L. Smith, Phys. Lett. B 128 (1983) 107.
- [18] M. Ericson and A.W. Thomas, Phys. Lett. B 128 (1983) 112.
- [19] B.L. Friman, V.R. Pandharipande, and R.B. Wiringa, Phys. Rev. Lett. 51 (1983) 763.
- [20] P.J. Sutton, A.D. Martin, R.G. Roberts, and W.J. Stirling, Phys. Rev. D 45 (1992) 2349.
- [21] E.L. Berger, F. Coester, and R.B. Wiringa, Phys. Rev. D 29 (1984) 398.
- [22] M. Staszel, J. Rożynek, and G. Wilk, Phys. Rev. D 29 (1984) 2638.
- [23] A.W. Hendry, D.B. Lichtenberg, and E. Predazzi, Nuovo Cim. A 92 (1986) 427.
- [24] S.V. Akulinichev, S. Shlomo, S.A. Kulagin, and G.M. Vagradov, Phys. Rev. Lett. 55 (1985) 2239.
- [25] F.E. Close, R.G. Roberts, and G.G. Ross, Phys. Lett. B 129 (1983) 346.
- [26] R.L. Jaffe, F.E. Close, R.G. Roberts, and G.G. Ross, Phys. Lett. B 134 (1984) 449.
- [27] F.E. Close, R.L. Jaffe, R.G. Roberts, and G.G. Ross, Phys. Rev. D 31 (1985) 1004.
- [28] T. Kawabe, Lett. Nuovo Cim. 44 (1985) 159.
- [29] C. Angelini and R. Pazzi, Phys. Lett. B 113 (1982) 343.
- [30] C. Angelini and R. Pazzi, Phys. Lett. B 135 (1984) 473.
- [31] J. Cleymans, Presented at International Workshop on Quarks, Gluons and Hadronic Matter, Cape Town, South Africa, 16-20 February 1987, published in Cape Town Workshop 1987, 0447 (QCD161:C375:1987).
- [32] J. Cleymans and R.L. Thews, Z. Phys. C 37 (1988) 315.
- [33] J. Cleymans, I. Dadic, and J. Joubert, arXiv:hep-ph/9307352.
- [34] E. Mac and E. Ugaz, Z. Phys. C 43 (1989) 655.
- [35] R.S. Bhalerao, arXiv:hep-ph/9506367.
- [36] R.S. Bhalerao, Phys. Lett. B 380 (1996) 1.
- [37] R.S. Bhalerao, Nucl. Phys. A 680 (2000) 62.
- [38] R.S. Bhalerao, Phys. Rev. C 63 (2001) 025208.
- [39] R.S. Bhalerao, N.G. Kelkar, and B. Ram, Phys. Lett. B 476 (2000) 285.
- [40] K. Ganesamurthy, V. Devanathan, and M. Rajasekaran, Z. Phys. C 52 (1991) 589.
- [41] V. Devanathan, S. Karthiyayini, and K. Ganesamurthy, Mod. Phys. Lett. A 9 (1994) 3455.
- [42] V. Devanathan and J.S. McCarthy, Mod. Phys. Lett. A 11 (1996) 147.
- [43] C. Bourrely et al., Z. Phys. C 62 (1994) 431.
- [44] C. Bourrely and J. Soffer, Phys. Rev. D 51 (1995) 2108.
- [45] C. Bourrely and J. Soffer, Nucl. Phys. B 445 (1995) 341.
- [46] C. Bourrely and J. Soffer, Phys. Rev. D 68 (2003) 014003.
- [47] C. Bourrely, J. Soffer, and F. Buccella, Eur. Phys. J. C 23 (2002) 487.
- [48] C. Bourrely, J. Soffer, and F. Buccella, Eur. Phys. J. C 41 (2005) 327.
- [49] C. Bourrely, J. Soffer, and F. Buccella, Mod. Phys. Lett. A 21 (2006) 143.
- [50] C. Bourrely, J. Soffer, and F. Buccella, Phys. Lett. B 648 (2007) 39.
- [51] C. Bourrely, J. Soffer, and F. Buccella, Mod. Phys. Lett. A 18 (2003) 771.
- [52] J. Soffer, Nucl. Phys. A 755 (2005) 361.
- [53] Y.-J. Zhang, B. Zhang, and B.-Q. Ma, Phys. Lett. B 523 (2001) 260.
- [54] Y.-J. Zhang, B.-S. Zou, and L.-M. Yang, Phys. Lett. B 528 (2002) 228.
- [55] Y.-J. Zhang, W.-Z. Deng, and B.-Q. Ma, Phys. Rev. D 65 (2002) 114005.
- [56] J.P. Singh and A. Upadhyay, J. Phys. G 30 (2004) 881.
- [57] M. Alberg and E.M. Henley, Phys. Lett. B 611 (2005) 111.
- [58] L.A. Trevisan, C. Mirez, T. Frederico, and L. Tomio, Eur. Phys. J. C 56 (2008) 221.
- [59] R.P. Bickerstaff and J.T. Londergan, Phys. Rev. D 42 (1990) 3621.
- [60] C. Angelini and R. Pazzi, Phys. Lett. B 154 (1985) 328.
- [61] Z. Li and H. Peng, High Energy Phys. Nucl. Phys. (in Chinese) 12 (1988) 55.
- [62] J. Rożynek and G. Wilk, Nucl. Phys. A 721 (2003) 388.
- [63] Y. Zhang, L. Shao, and B.-Q. Ma, Phys. Lett. B 671 (2009) 30.
- [64] J. Gomez et al., Phys. Rev. D 49 (1994) 4348.
- [65] P. Zavada, Phys. Rev. D 55 (1997) 4290.
- [66] Particle Data Group, Phys. Lett. B 667 (2008) 1.
- [67] New Muon Collaboration, P. Amaudruz et al., Phys. Rev. Lett. 66 (1991) 2712.
- [68] New Muon Collaboration, M. Arneodo et al., Phys. Rev. D 50 (1994) R1.
- [69] J. Pumplin et al., JHEP 0207 (2002) 012.
- [70] B. Lu and B.-Q. Ma, Phys. Rev. C 74 (2006) 055202.
- [71] D.M. Alde et al., Phys. Rev. Lett. 64 (1990) 2479.
- [72] G. T. Garvey and J. C. Peng, Prog. Part. Nucl. Phys. 47 (2001) 203 [arXiv:nucl-ex/0109010].
List of Figures
-
•
Fig.1: The ratios of the structure function . The solid, dashed, and dotted curves correspond to three conditions: a) just considering the , flavors and the gluon, b) considering the , , flavors and the gluon with MeV, c) considering the , , flavors and the gluon with MeV, respectively. The experimental data are from Ref. [64].
-
•
Fig.2: The parameters of the nucleons in nuclei — , , , , , and versus the atomic number . , , and are in units of MeV. The squared, circular, and triangular points correspond to the three conditions: a) just considering the , flavors and the gluon, b) considering the , , flavors and the gluon with MeV, c) considering the , , flavors and the gluon with MeV, respectively.
-
•
Fig.3: The ratios of the PDFs of iron to deuterium. The solid normal, thick, and thin curves are our results, corresponding respectively to the three conditions: a) just considering the , flavors and the gluon, b) considering the , , flavors and the gluon with MeV, c) considering the , , flavors and the gluon with MeV. The dashed, dotted, and dash-dotted curves correspond to the predictions of the cluster model, the -rescaling model, and the pion excess model, respectively.
List of Tables
-
•
Table 1: Considering the , flavors and the gluon.
-
•
Table 2: Considering the , , flavors and the gluon ( MeV).
-
•
Table 3: Considering the , , flavors and the gluon ( MeV).
-
•
Table 4: The fractions of and carried by , , , , , in 2D and 56Fe respectively under the three conditions: a) just considering the , flavors and the gluon, b) considering the , , flavors and the gluon with MeV, c) considering the , , flavors and the gluon with MeV.
| 2D | 4He | 9Be | 12C | 27Al | 40Ca | 56Fe | 107Ag | 197Au | |
|---|---|---|---|---|---|---|---|---|---|
| 46.84 | 46.00 | 45.97 | 45.76 | 45.64 | 45.64 | 45.25 | 45.29 | 45.01 | |
| 63.21 | 60.67 | 60.58 | 59.96 | 59.60 | 59.60 | 58.46 | 58.58 | 57.77 | |
| 35.39 | 33.83 | 33.77 | 33.39 | 33.17 | 33.17 | 32.48 | 32.55 | 32.06 | |
| 1.000 | 1.088 | 1.091 | 1.114 | 1.128 | 1.128 | 1.174 | 1.169 | 1.203 | |
| 1.000 | 1.028 | 1.029 | 1.037 | 1.041 | 1.041 | 1.055 | 1.053 | 1.063 | |
| 0.235 | 0.232 | 0.231 | 0.231 | 0.230 | 0.230 | 0.228 | 0.229 | 0.227 |
| 2D | 4He | 9Be | 12C | 27Al | 40Ca | 56Fe | 107Ag | 197Au | |
|---|---|---|---|---|---|---|---|---|---|
| 42.53 | 41.87 | 41.84 | 41.69 | 41.58 | 41.59 | 41.27 | 41.30 | 41.07 | |
| 57.39 | 55.31 | 55.21 | 54.75 | 54.41 | 54.44 | 53.46 | 53.55 | 52.86 | |
| 32.13 | 30.85 | 30.79 | 30.50 | 30.29 | 30.31 | 29.71 | 29.77 | 29.34 | |
| 1.000 | 1.078 | 1.081 | 1.100 | 1.114 | 1.112 | 1.154 | 1.150 | 1.181 | |
| 1.000 | 1.025 | 1.026 | 1.032 | 1.037 | 1.036 | 1.049 | 1.048 | 1.057 | |
| 0.235 | 0.232 | 0.232 | 0.231 | 0.230 | 0.230 | 0.229 | 0.229 | 0.228 |
| 2D | 4He | 9Be | 12C | 27Al | 40Ca | 56Fe | 107Ag | 197Au | |
|---|---|---|---|---|---|---|---|---|---|
| 40.08 | 39.52 | 39.50 | 39.37 | 39.28 | 39.28 | 39.01 | 39.04 | 38.84 | |
| 54.08 | 52.39 | 52.33 | 51.95 | 51.68 | 51.68 | 50.88 | 50.97 | 50.39 | |
| 30.28 | 29.24 | 29.20 | 28.97 | 28.80 | 28.80 | 28.32 | 28.37 | 28.01 | |
| 1.000 | 1.067 | 1.070 | 1.086 | 1.098 | 1.098 | 1.133 | 1.129 | 1.157 | |
| 1.000 | 1.022 | 1.023 | 1.028 | 1.032 | 1.032 | 1.043 | 1.041 | 1.050 | |
| 0.235 | 0.232 | 0.232 | 0.232 | 0.231 | 0.231 | 0.230 | 0.230 | 0.229 |
| The fraction | ||||||||
|---|---|---|---|---|---|---|---|---|
| 2D | 0.295 | 0.041 | 0.295 | 0.041 | 0.328 | |||
| 56Fe | 0.289 | 0.043 | 0.289 | 0.043 | 0.336 | |||
| 2D | 0.703 | 0.097 | 0.176 | 0.024 | ||||
| no quark | 56Fe | 0.696 | 0.104 | 0.174 | 0.026 | |||
| 2D | 0.253 | 0.035 | 0.253 | 0.035 | 0.281 | 0.072 | ||
| 56Fe | 0.249 | 0.037 | 0.249 | 0.037 | 0.286 | 0.072 | ||
| 2D | 0.640 | 0.088 | 0.160 | 0.022 | 0.045 | |||
| 56Fe | 0.634 | 0.093 | 0.158 | 0.023 | 0.046 | |||
| 2D | 0.268 | 0.037 | 0.268 | 0.037 | 0.298 | 0.046 | ||
| 56Fe | 0.263 | 0.039 | 0.263 | 0.039 | 0.305 | 0.045 | ||
| 2D | 0.664 | 0.091 | 0.166 | 0.023 | 0.028 | |||
| 56Fe | 0.657 | 0.098 | 0.164 | 0.025 | 0.028 |