Hydrogen Lyman and Lyman radiances and profiles in polar coronal holes
Abstract
The hydrogen Lyman-alpha (Ly) plays a dominant role in the radiative energy transport in the lower transition region, and is important for the studies of transition-region structure as well as solar wind origin. We investigate the Ly profiles obtained by the Solar Ultraviolet Measurements of Emitted Radiation spectrograph (SUMER) on the SOHO (Solar and Heliospheric Observatory) spacecraft in coronal holes and quiet Sun. In a subset of these observations, also the H i Lyman- (Ly), Si iii, and O vi lines were (quasi-) simultaneously recorded. We find that the distances between the two peaks of Ly profiles are larger in coronal holes than in the quiet Sun, indicating a larger opacity in coronal holes. This difference might result from the different magnetic structures or the different radiation fields in the two regions. Most of the Ly profiles in the coronal hole have a stronger blue peak, in contrast to those in quiet-Sun regions. Whilst in both regions the Ly profiles are stronger in the blue peak. Although the asymmetries are likely to be produced by differential flows in the solar atmosphere, their detailed formation processes are still unclear. The radiance ratio between Ly and Ly decreases towards the limb in the coronal hole, which might be due to the different opacity of the two lines. We also find that the radiance distributions of the four lines are set by a combined effect of limb brightening and the different emission level between coronal holes and quiet Sun.
1 Introduction
As the strongest emission line in the vacuum ultraviolet (VUV) spectral range, the hydrogen Lyman-alpha (Ly) plays a crucial role in the radiative energy transport in the lower transition region (TR) (Fontenla et al., 1988). Its radiance and profile provide important information on the structure of the TR, where the solar wind flows out through coronal funnels (Tu et al., 2005; Esser et al., 2005). The solar Ly line is also very important for interplanetary studies because the spectral irradiance at the center of its profile is the main excitation source responsible for the atomic hydrogen resonant scattering in cool cometary and planetary materials (Emerich et al., 2005).
At the times of Skylab (e.g., Nicolas et al., 1976) and OSO 8 (Orbiting Solar Observatory) (e.g., Lemaire et al., 1978; Kneer et al., 1981; Vial, 1982; Bocchialini & Vial, 1996), full Ly and Ly line profiles were obtained. Ly spectra in different locations of the Sun were also obtained by the HRTS (High Resolution Telescope and Spectrograph) instrument on rocket flights (Basri et al., 1979) and by the UVSP instrument onboard SMM (Solar Maximum Mission, Fontenla et al., 1988). These early observations provided valuable information on the Lyman line profiles. However, since these observations were made in Earth orbits, the obtained Lyman line profiles were hampered by the geocoronal absorption at the center.
The SUMER (Solar Ultraviolet Measurements of Emitted Radiation, Wilhelm et al., 1995; Lemaire et al., 1997) observations at the first Lagrangian point overcame this problem. The whole hydrogen Lyman series is covered by the SUMER spectral range. By analyzing SUMER spectra, Warren et al. (1998) found that the average profiles for Ly through Ly (=5) are self-reversed and show a strong enhancement in the red wings. They also found that the peak separation of these line profiles is larger at limb than at disk center. Xia (2003) found that the asymmetry of the average Ly line profile - the red-peak dominance - is stronger in the quiet Sun than in a coronal hole. Also in sunspots SUMER observed Lyman line profiles (2) and Tian et al. (2009a) found that they are almost not reversed, indicating a much smaller opacity above sunspots than in surrounding regions. However, since the Ly line is so prominent, its high radiance leads to a saturation of the detector microchannel plates. Although attempts were made to observe Ly on the bare part of the detector, the signal determination was highly uncertain due to the gain-depression correction (Teriaca et al., 2005a, b, 2006).
High-quality Ly profiles without geocoronal absorption were obtained after June 2008, when several non-routine observations were made by SUMER. By closing the aperture door to reduce the incoming photon flux to a level of about 20%, the full Ly profiles were obtained (Curdt et al., 2008; Tian et al., 2009b). It turned out that the average Ly profile in the quiet Sun is strongly reversed and has a stronger blue peak. Moreover, this asymmetry is stronger in regions where the downflows are stronger in the TR.
Here we present new results from these unique data sets. Emphasis is put on the results from a more recent observation in a polar coronal hole region. The different behaviors of Ly and Ly profiles in the coronal hole as compared to the quiet Sun are presented and discussed. The data set allows for a study of the ratio between Ly and Ly radiances in the coronal hole. We also investigate the limb brightening effect and the different radiances between coronal holes and quiet Sun for the two Lyman lines as well as Si iii and O vi, by studying their radiance distributions.
2 Observations
| Ion | (Å) | Ion | (Å) | ||
|---|---|---|---|---|---|
| H i Ly | 1215.67 | 4.0 | Si iii | 1206.51 | 4.7 |
| H i Ly | 1025.72 | 4.0 | O vi | 1031.93 | 5.5 |
As mentioned in Curdt et al. (2008), we scanned six quiet-Sun regions with a size of at different locations in the equatorial plane on 24 and 25 June 2008. Three regions along the central meridian and including the southern polar region were scanned on 26 June 2008. For these scans, profiles of Ly and Si iii ( 1206 Å) lines were transmitted to the ground. The scanned region in the southern polar region is outlined in white and is superposed on an XRT (X-ray Telescope, Golub et al., 2007) image, as shown in the right panel of Fig. 1. On 23 September 2008, we added a second wavelength setting for Ly and O vi ( 1032 Å) and scanned a quiet-Sun region at disk center (Tian et al., 2009b). The rest wavelengths and formation temperatures of the four lines are listed in Table 1.
More recently, we adopted these two wavelength settings and scanned a region inside a large coronal hole in the southern polar region from 16:01 to 17:19 on 17 April 2009. Similarly to previous observations, we partly closed the aperture door, and could thus reduce the input photon rate by a factor of . As a prologue to the observation, full-detector images in the Lyman continuum around 880 Å were obtained with open and partially-closed door. In this way, accurate values of the photon flux reduction could be established. After this prologue, the slit 7 (0.3′′ 120′′) was used to scan the target with a size of about 150′′ 120′′, with an exposure time of 15 s. The scanned region is outlined in white and is superposed on an XRT image, as shown in the middle panel of Fig. 1.
The standard procedures for correcting and calibrating the SUMER data were applied, including local-gain correction, dead-time correction, flat-field correction, destretching, and radiometric calibration. Finally, the radiances of the spectra were divided by the factor of the photon flux reduction, which was 18.4% in this observation.
3 Results and discussions
3.1 Peak separation of Ly
Due to the radiative transfer effect, a central reversal and two peaks in the wings are normally present in Ly profiles. The peak separation can be regarded as an indicator of the opacity. It has been found that the peak separation is larger at limb positions than at disk center (Curdt et al., 2008). Here we aim at finding possible differences in the peak separation between coronal holes and quiet-Sun regions at the limb.
We selected four limb scans for this study. For each scan, we first sorted all the data points by the distance from disk center and defined 10 bins. The Ly profiles in each bin were then averaged to pick up general properties out of the large solar variability. The signal to noise ratio is, consequently, very high. By applying a second-order polynomial fit to both peaks of the average profile, we determined the spectral positions of the two peaks and . The variations of the peak separation with the distance from disk center are shown in the left panel of Fig. 1. The off-disk profiles were excluded in the above calculations since their shapes approximate a Gaussian and show no peaks in the wings.
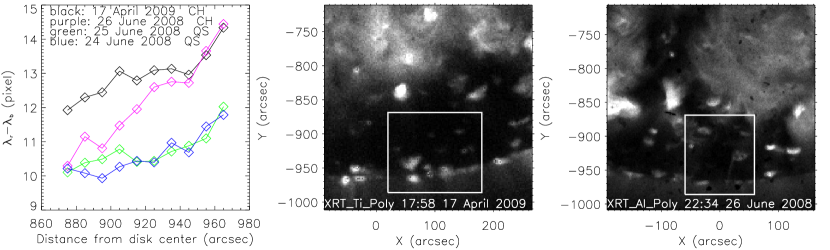
From Fig. 1 we find that in both coronal holes and the quiet Sun the peak separation of the Ly profile increases towards the limb, indicating a larger opacity combined with a source function decreasing with altitude. This result complements the finding by Warren et al. (1998), in which the authors found that the peak separations of the average profiles for Ly through Ly (=5) are larger at limb than at disk center.
It is also obvious that the peak separation in the polar coronal hole is larger than those in the quiet-Sun region at the east limb. The different behavior of the two coronal holes can be understood if we check the positions of the scans with respect to the coronal hole boundaries. From Fig. 1 it is clear that the scanned region on 17 April 2009 was well inside the polar coronal hole. However, the upper part of the scanned region on 26 June 2008 was very close to the boundary, so that the radiance there was likely to be contaminated by the nearby quiet-Sun emission. This effect might explain the fact that the peak separation increases from the quiet-Sun level to the coronal hole level, for the observation on 26 June 2008. Another possibility might be that although coronal radiation is much reduced in the coronal hole (see the next paragraph), from the nearby quiet-Sun structures we may still get quiet a bit of radiation flux which ionizes hydrogen atoms and reduces the opacity. This effect should be weaker with increasing distance from the boundary.
This result indicates a larger opacity in coronal holes, as compared to the quiet Sun. There might be two possible explanations. First, the magnetic-field lines in polar coronal holes are almost perpendicular to the line of sight, whilst they are aligned in various directions at the east limb. It has been shown that since the variations of density and temperature are different when seen across and along the magnetic field lines, the self-reversal of the Lyman line profiles in a prominence can be different if the prominence is observed from different viewing angles (Heinzel et al., 2005; Schmieder et al., 2007). In coronal holes and quiet-Sun regions, we should not exclude the possibility that the different magnetic structures might influence the Ly profile in the processes of emission and absorption. It is also possible that the larger opacity is the result of a weaker radiation field in the upper atmosphere of coronal holes. Due to the lower radiative ionization, more atomic hydrogen will be populated in the upper TR and corona, which leads to a stronger absorption of the profiles. In order to fully understand this phenomenon, sophisticated models including calculations of non-LTE (local thermodynamic equilibrium) radiative transfer should be developed in the future.
3.2 Asymmetry of Lyman line profiles
Previous observations have shown that the dominant asymmetry for profiles of the hydrogen Ly and higher order Lyman lines is opposite in the quiet Sun. Most Ly profiles have a stronger blue peak (Curdt et al., 2008; Tian et al., 2009b), while most Ly profiles have a stronger red peak (Warren et al., 1998; Xia, 2003). The asymmetries are probably produced by the combined effects of the differential flows in the solar atmosphere and different line opacities (Gouttebroze et al., 1978; Fontenla et al., 2002; Gunár et al., 2008; Curdt et al., 2008; Tian et al., 2009b).

Similar to Curdt et al. (2008), here we present in Fig. 2 the average profiles of Ly and Ly in six bins which are equally spaced in radiance. The off-disk profiles were excluded from the averaging. The Ly profiles at the west limb were acquired from 13:25 to 14:36 on 07 June 1996, with an exposure time of 10 s. For this observation only 25 spectral pixels were recorded so that the profiles were not complete. Profiles presented in the other five panels are all from the non-routine observations mentioned above. From Fig. 2 it is clear that the Lyman line profiles are more reversed at limb positions than at disk center, which has already been found by Warren et al. (1998) and Curdt et al. (2008).
The most interesting feature in Fig. 2 is that the Ly profiles in the polar coronal hole have an asymmetry opposite to those in the quiet Sun, while the dominant asymmetry of the Ly profiles is the same in different locations of the Sun. We noticed that Xia (2003) found more locations with blue-peak dominance in Ly profiles in equatorial coronal holes than in quiet-Sun regions. However, the average Ly profile in Xia (2003) is still stronger in the red peak. Here we find very clearly that most Ly profiles are stronger in the blue peak in the polar coronal hole.
Since the asymmetries of the Lyman line profiles are likely to be influenced by flows in various layers of the solar atmosphere, and we know that upflows are predominant in the upper TR and lower corona in coronal holes (Dammasch et al., 1999; Hassler et al., 1999; Tu et al., 2005), it is natural to relate the upflows to the profile asymmetries. In order to investigate this relationship, newly designed observations will be done in the near future. However, the flows of the emitting material might also be different in the coronal hole and quiet Sun, which will also alter the asymmetries of line profiles.
3.3 Radiance ratio between Ly and Ly
The Ly/Ly ratio is very sensitive to the physical and geometrical properties of the fine structures in prominences (Vial et al., 2007). However, this ratio in coronal holes is not well established.
The spectra obtained on 17 April 2009 include both Ly and Ly lines, and, thus, allow for studying the center to limb variation of the radiance ratio between Ly and Ly in the coronal hole. In Fig. 3 we present the radiances of four lines and the ratio Ly/Ly in 23 bins which are equally spaced in distance. In each bin, the diamond and the vertical bar represent the median value and standard deviation, respectively. The median values and the corresponding standard deviations obtained from the disk-center quiet-Sun region on 23 September 2008 are also shown and marked in red for comparison. The radiances are given in energy unit of .
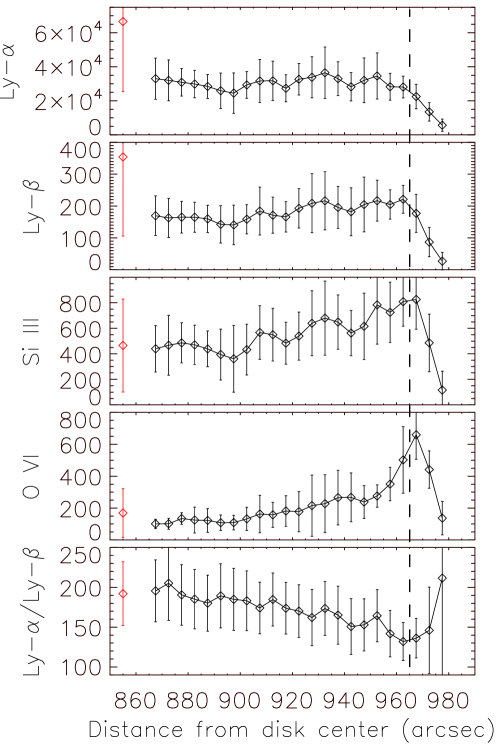
From Fig. 3, we can see that the effect of limb brightening is obviously present in the line radiance of O vi, and also clear in Si iii. This effect is totally absent in Ly, which is consistent with Curdt et al. (2008). The effect is present, although not prominent, for Ly. This is because Ly has a smaller opacity and thus should behave more similarly to optically thin lines than Ly. As a result, the ratio Ly/Ly decreases towards the limb, from the quiet-Sun level of about 190 to 130 at the limb.
Above the limb, the ratio increases further because the opacity of Ly stays higher than one while the lower-than-one Ly opacity leads to a lower radiance. An additional effect might result from the different conditions of formation of the two lines when one goes higher in the atmosphere: the Ly line becomes scattering dominated (and proportional to the density) while the Ly line stays collision-dominated (and proportional to the square of the density).
3.4 Radiance distribution
Radiance distributions of EUV lines have been intensively studied (e.g., Stucki et al., 2002; Raju, 2006; Pauluhn & Solanki, 2007). Radiance histograms of coronal holes are shifted towards lower values, having a narrower and higher peak indicative of more uniform radiances, as compared to those of quiet-Sun regions. As shown in Raju (2006), the radiance distributions are more similar in the quiet-Sun region and the coronal hole for lower-TR lines, while they become increasingly different for lines formed in the upper-TR and corona.
In Fig. 4 we present the radiance histograms of Ly, Ly, Si iii, and O vi at different locations of the Sun, by using the spectra obtained in the non-routine observations mentioned above. Again, off-disk data points were excluded from the histograms.
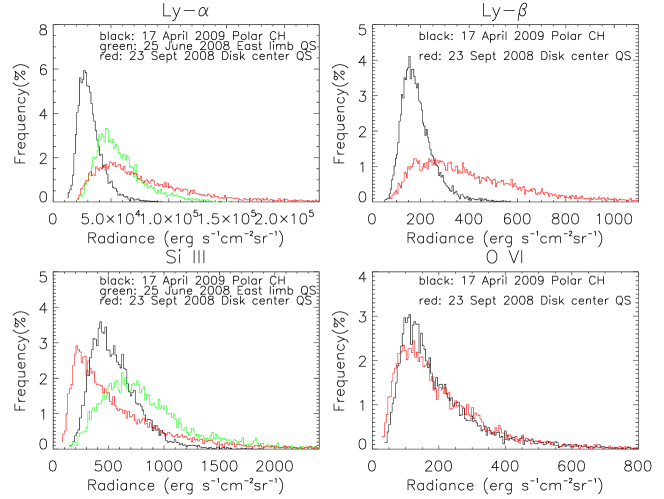
At first sight, the behaviors of the radiance distributions of Si iii and O vi are ”peculiar”. According to Raju (2006), the radiance distribution of the lower-TR line Si iii should be similar in coronal holes and in the quiet Sun, and the radiance distribution of the upper-TR line O vi should be shifted towards the weaker side in coronal holes. However, we have to bear in mind that the east-limb region and the polar coronal hole in our study are much closer to the limb, as compared to the polar regions in Raju (2006). Thus, the limb brightening effect is much more prominent in our distributions. Due to this effect, the radiance of Si iii should be weaker at disk center, and stronger at east/west limb. In polar coronal holes, the radiance should also be stronger than that at disk center, and perhaps slightly weaker than that at east/west limb. This is exactly what we see in the radiance distributions of Si iii. For O vi, a combined effect of dark coronal hole emission and limb brightening makes its radiance distribution similar in the polar hole and at disk center. These two effects are clearly revealed by the median of O vi radiances, as shown in Fig. 3.
The median values of the radiances shown in Fig. 3 also reveal that the polar coronal hole is darker in Ly and Ly, although these two lines are formed in the lower TR. This behavior is likely due to the large optical thickness. The reduced ionizing coronal radiation may also play a role, as in the case of the He ii line (e.g. Raju, 2006). Since the lines of Ly and Ly have no or little limb brightening, their radiance distributions in coronal holes are shifted towards the weaker side, as shown in Fig. 4.
4 Summary
Full hydrogen Ly profiles which are clean from geocoronal absorption were acquired by SUMER with high spectral and spatial resolutions, through several non-routine observations. In some of these observations, in addition Ly, Si iii, and O vi profiles were recorded (quasi-) simultaneously.
The peak separations of Ly profiles are found to be larger in coronal holes than in the quiet Sun, indicating a larger opacity in coronal holes. This difference might be due the different magnetic structures or the different radiation fields in the two regions. We also found that the dominant asymmetry of the Ly profiles in the polar coronal hole is opposite to that in the quiet Sun. In order to understand this phenomenon, we need to investigate the influence of the upflows in the upper TR and the flows of the emitting materials on the line profiles. We also investigated the center to limb variation of the radiance ratio between Ly and Ly , which has a declining trend towards the limb in the coronal hole. Finally, the radiance distributions of the four lines were explained by taking into account the effects of limb brightening and darker emission in coronal holes.
In order to fully understand the above new results, non-LTE models including detailed calculations of radiative transfer should be developed in the future.
References
- Basri et al. (1979) Basri, G. S., Linsky, J. L., Bartoe, J.-D. F., et al. 1979, ApJ 230, 924
- Bocchialini & Vial (1996) Bocchialini, K., & Vial, J.-C. 1996, Sol. Phys. 168, 37
- Curdt et al. (2008) Curdt, W., Tian, H., Teriaca, L., Schühle, U., & Lemaire, P. 2008, A&A, 492, L9
- Dammasch et al. (1999) Dammasch, I. E., Wilhelm, K., Curdt, W., & Hassler, D. M. 1999, A&A, 346, 285
- Emerich et al. (2005) Emerich, C., Lemaire, P., Vial, J.-C., et al. 2005, Icarus 178, 429
- Esser et al. (2005) Esser, R., Lie-Svendsen, Ø., Janse, Å. M., & Killie, M. A. 2005, ApJ, 629, L61
- Fontenla et al. (1988) Fontenla, J. M., Reichmann, E. J., & Tandberg-Hanssen, E. 1988, ApJ 329, 464
- Fontenla et al. (2002) Fontenla, J. M., Avrett, E. H., & Loeser, E. 2002, ApJ 572, 636
- Golub et al. (2007) Golub, L., Deluca, E., Austin, G., et al. 2007, Sol. Phys., 243, 63
- Gouttebroze et al. (1978) Gouttebroze, P., Lemaire, P., Vial, J.-C., & Artzner, G. 1978, ApJ, 225, 655
- Gunár et al. (2008) Gunár, S., Heinzel, P., Anzer,U., & Schmieder, B., 2008, A&A, 490, 307
- Hassler et al. (1999) Hassler, D. M., Dammasch, I. E., Lemaire, P., et al. 1999, Science, 283, 810
- Heinzel et al. (2005) Heinzel, P., Anzer, U., & Gunár, S. 2005, A&A, 442, 331
- Kneer et al. (1981) Kneer, F., et al. 1981, Sol. Phys., 69, 289
- Lemaire et al. (1978) Lemaire, P., Charra, J., Jouchoux, A., et al. 1978, ApJ, 223, L55
- Lemaire et al. (1997) Lemaire P., Wilhelm K., Curdt W., et al. 1997, Sol. Phys., 170, 105
- Nicolas et al. (1976) Nicolas, K. R., Kjeldseth Moe, O., & Tousey, R. 1976, JGR, 81(19), 3465
- Pauluhn & Solanki (2007) Pauluhn, A., & Solanki, S. K. 2007, A&A, 462, 311
- Raju (2006) Raju, K. P., & Bromage, B. J. I. 2006, A&A, 446, 295
- Schmieder et al. (2007) Schmieder, B., Gunár, S., Heinzel, P., Anzer, U. 2007, Sol. Phys. 241, 53
- Stucki et al. (2002) Stucki, K., Solanki, S. K., & Pike, C. D., et al. 2002, A&A, 381, 653
- Teriaca et al. (2005a) Teriaca, L., Schühle, U., Solanki, S. K., et al. 2005a, in Proc. Chromospheric and Coronal Magnetic Fields, ed. Innes, D. E., Lagg, A., & Solanki, S. K., Sept. 2005, Katlenburg-Lindau, Germany, ESA SP-596, 66
- Teriaca et al. (2005b) Teriaca, L., Schühle, U., Solanki, S. K., et al. 2005b in Proc. ESPM The Dynamic Sun: Challenges for Theory and Observations, ed. Danesy, D., Poedts, S., De Groof, A., & Andries, J., Sept. 2005, Leuven, Belgium, ESA SP-600,100
- Teriaca et al. (2006) Teriaca, L., Schühle, U., Solanki, S. K., et al. 2006, in Proc. 10 years of SoHO and beyond, ed. Lacoste, H. & Ouwehand, L., Giardini-Naxos, Italy, ESA SP-617, 77
- Tian et al. (2009a) Tian, H., Curdt, W., Teriaca, L., Landi, E., & Marsch, E. 2009a, A&A, DOI: 10.1051/0004-6361/200912114
- Tian et al. (2009b) Tian, H., Curdt, W., Marsch, E., & Schühle, U. 2009b, A&A, DOI: 10.1051/0004-6361/200811445
- Tu et al. (2005) Tu, C.-Y., Zhou, C., Marsch, E., et al. 2005, Science, 308, 519
- Vial (1982) Vial, J.-C. 1982, ApJ, 253, 330
- Vial et al. (2007) Vial, J.-C., Ebadi, H., & Ajabshirizadeh, A. 2007, Sol. Phys. 246, 327
- Warren et al. (1998) Warren, H. P., Mariska, J. T., & Wilhelm, K. 1998, ApJS 119, 105
- Wilhelm et al. (1995) Wilhelm, K., Curdt, W., Marsch, E., et al., 1995, Sol. Phys. 162, 189
- Xia (2003) Xia, L.-D. 2003, Ph.D. Thesis (Göttingen: Georg-August-Univ.)