Dwarf Nova Oscillations and Quasi-Periodic Oscillations in Cataclysmic Variables, VIII. VW Hyi in outburst observed with the Southern African Large Telescope††thanks: based on observations made with the Southern African Large Telescope (SALT)
Abstract
We analyse four light curves obtained at high time resolution ( 0.1 s) with the 11-m Southern African Large Telescope, at the ends of two normal outbursts and one superoutburst of the dwarf nova VW Hyi. All of these contain at least some Dwarf Nova Oscillations (DNOs), which, when at their highest amplitudes, are seen in unprecedented detail. In addition to the expected DNOs with periods 20 s we find a previously unknown modulation at 13.39 s, but none at shorter periods. The various DNOs and their interaction with the longer period Quasi-periodic Oscillations are interpreted in terms of the model of magnetically controlled flow from an accretion disc proposed earlier in this series of papers. Our observations include rare DNOs very late in outburst; we find that the fundamental period does not increase beyond 90 s, which is the same value that the independent “longer period DNOs” converge on.
keywords:
accretion, accretion discs – binaries: close, dwarf novae, cataclysmic variables – stars: oscillations – stars: individual: VW Hyi1 Introduction
This series of papers is investigating the optical modulation phenomena observed in cataclysmic variable stars (CVs) at moderate time resolution, in particular the Dwarf Nova and Quasi-periodic Oscillations (DNOs and QPOs) that are associated with accretion from a companion star through an accretion disc onto the surface of the white dwarf primary. A review of the general properties of CVs is given in Warner (1995). In previous papers (Woudt & Warner 2002: hereafter Paper I; Warner & Woudt 2002: hereafter Paper II; Warner, Woudt & Pretorius 2003: hereafter Paper III; Warner & Woudt 2006: hereafter Paper IV; Pretorius, Warner & Woudt 2006: hereafter Paper V, and Warner & Pretorius 2008: hereafter Paper VI) we have used integration times of typically 5 s to study in detail the DNOs (periods in the range 3 – 40 s) and QPOs (two kinds; ones with periods 16 times the DNO periods and others of much longer periods, typically 1000 – 2000 s), and have discovered the existence of an intermediate class of oscillations (long period DNOs: lpDNOs, periods 4 times those of the DNOs). A review of the rich phenomenology of these oscillations, which includes systematic variations of period with rate of mass transfer () through the disc and the interactions of the various types of oscillation, is given in Warner (2004), which also presents an interpretation of some aspects in terms of a magnetic accretion model, proposed initially by Paczynski (1978) and developed further in Papers II, V and VI. In many respects it is a generalisation of the standard model of intermediate polars. One aspect that we need to mention immediately is that most DNOs are single valued and interpreted as being generated by magnetically-controlled accretion onto a freely moving equatorial accretion belt on the white dwarf primary. This DNO we refer to as having a sidereal period, , or frequency . Occasionally a second DNO appears (often with a strong first harmonic), at what we call the synodic periodic because the difference in frequency between the two DNOs is equal to the frequency of the QPO (when present), i.e., . The basic model is that the beam of high energy radiation arising from the accretion zone on the equatorial belt is reprocessed off a traveling wave near the inner edge of the magnetically truncated disc that is the source of the observed QPOs (Paper II).
| Run | Filter | Date of first obs. | UTC start | HJD start | Outburst | Length | V | ||
|---|---|---|---|---|---|---|---|---|---|
| (start of night) | (hh:mm:ss.ss) | (+ 245 0000.0) | type | (h) | (s) | (d) | (mag) | ||
| SALT004 | U | 2005 December 09 | 21:39:32.74 | 3714.40199535 | Normal | 0.2, 0.95 | 0.080 | 0.10 0.20 | 12.4 |
| SALT005 | – | 2006 December 18 | 20:09:02.64 | 4088.33904461 | Normal | 1.89 | 0.080 | 1.74 1.83 | 13.4 |
| SALT016 | – | 2008 January 05 | 19:54:55.72 | 4471.32895922 | Super | 2.38 | 0.120 | –0.15: –0.05: | 11.8 |
| SALT017 | – | 2008 January 06 | 19:10:33.67 | 4472.29813736 | Super | 0.55 | 0.120 | 0.82: 0.84: | 13.0 |
Notes: The time is based on a template light curve of VW Hyi as defined in Paper I (see figure 5 of Paper I); is the integration time.
Most CVs are quite faint and therefore the study of their rapid brightness oscillations is often severely photon-limited, with individual pulse shapes not fully resolved. Although a few moderate time resolution photometric and spectroscopic studies of CVs have been made with 8-m class telescopes (e.g., V2051 Oph: Steeghs et al. 2001), there has hitherto not been a substantial study of the short period modulations made at considerably higher time resolution and good signal-to-noise. In particular, for the unpredictable outbursts of dwarf novae there will in general be difficulties of obtaining observing opportunities at the crucial times. Here, in what marks a shift in this series of papers to ultra-high time-domain studies of DNOs and QPOs with 10-m class facilities, we report the results from photometric runs with 0.1 s integrations made with the Southern African Large Telescope (SALT) in ‘slot-mode’ during its start-up phase, where rapid access to the telescope was shown to be feasible. The telescope and its photometer are described in O’Donoghue et al. (2006). Most observations were taken in white light (unfiltered), except for the 2005 December 9 observing run when a -band filter was used.
In Section 2 we give details of the observing runs and a general description of the slow and rapid brightness variations directly observable in the light curves; in Section 3 we give the results of detailed analysis of the light curves. Section 4 provides a brief synopsis.
2 Observation
2.1 The observational procedure
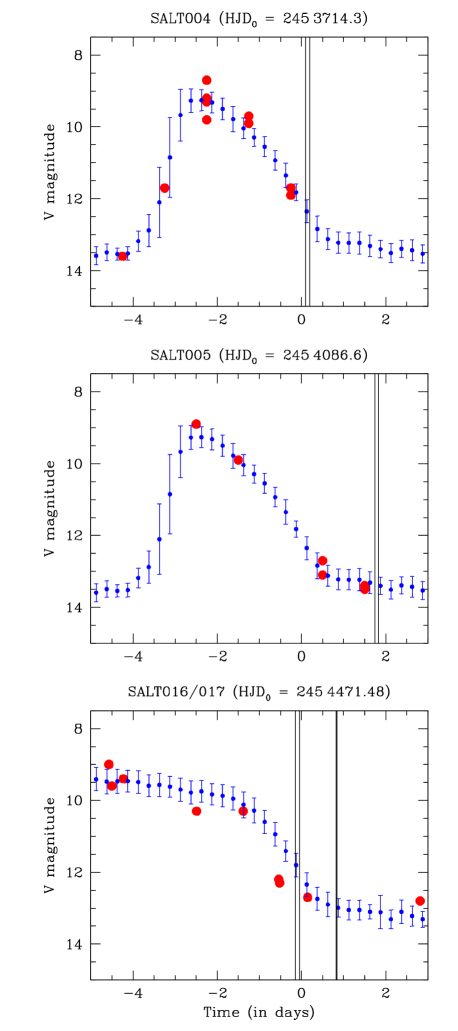
Details of the VW Hyi observations are given in Table 1. The parameter is the time in days derived from comparison of the outburst light curve (obtained from the American Association of Variable Star Observers (AAVSO) and/or the Variable Star Section of the Royal Astronomical Society of New Zealand (RASNZ)) with the appropriate outburst ‘template’ (figure 5 of Paper I), on which = 0 is defined (it is when the V magnitude passes through 12.5 on the decline). This enables the evolution of the outburst decline light curves to be aligned, see Fig. 1. For the 2008 January outburst the sampling of the outburst light curve was sparse over the decline phase; from the relative magnitude difference of VW Hyi on 2008 January 5 and January 6, derived from our SALT photometry (using the same reference star), an appropriate match with the outburst template was found. As it was not possible to put the SALT observations onto a magnitude scale we have used the templates to estimate V magnitudes at the times of observation.
The times of observation were chosen to catch the complex DNO behaviour that occurs near the end of outburst, during the final transition to quiescence, where frequency doubling and tripling are seen (Paper IV).
2.2 Data reduction
All standard photometric data reductions were performed in IRAF111IRAF is distributed by the National Optical Astronomy Observatory, which is operated by the Association of Universities for Research in Astronomy, Inc., under cooperative agreement with the National Science Foundation., including gain corrections of the different amplifiers (SALTICAM has two CCDs with two amplifiers each), merging of the different amplifiers, a superflat correction to remove the effects of vignetting by the spherical abberation corrector in ‘slot-mode’ observations, and aperture photometry using DAOPHOT.
Relative photometry was obtained for all runs by including a reference star in the field of view. This effectively removes the effects of the moving pupil and varying aperture of SALT during the course of a photometric run.
2.3 Preliminary description of the nature of the light curves
The light curves for the four runs are shown in order of and in compacted form in Fig. 2. In the 9 December 2005 run the large gap is caused by an interruption of observation, during which VW Hyi decreased in brightness by 0.4 mag. There is a noticeable change in the amplitude of rapid variations from run to run. This is almost entirely due to the differing prominence of DNOs.

2.3.1 2008 January 5 (SALT016)
This lightcurve, at the end of a superoutburst, is irregular and no DNOs are directly visible in it – but the detailed analysis given below shows that DNOs at very low amplitude are actually occasionally present. Short trains of QPOs are sometimes visible. From the AAVSO archive there are only two magnitude estimates available for the final descending part of this superoutburst, which makes estimation of uncertain. However, there are independent indicators that lead to the values quoted in Table 1. The change of mean magnitude between this and the next night shows that VW Hyi was on a rapidly descending part of the outburst lightcurve. The DNOs that appear in the second half of the 5 January run have a period 22 s, which is at the beginning of the steep climb in period seen in figure 1 of Paper IV, and shows that we have for the first time caught the transition from rare to frequent DNOs at the start of the rapid deceleration. In fact, we have not seen DNOs at this stage of a superoutburst before (e.g. run S1594 in table 1 of Paper IV). These properties indicate 0.0.
Towards the end of the run there are 24.8 s DNOs and 400 s QPOs, which have a ratio of 16.1, close to the expected relationship.
| Run No. | Length | DNOs | QPOs | ||||
| (d) | (s) | (periods in seconds) | (period in seconds) | ||||
| [amplitude in mmag] | [amplitude in mmag] | ||||||
| Fundamental | First harmonic | Second harmonic | |||||
| SALT004 | 0.11 | 706 | 25.64 0.01 [26.6] | – | – | – | |
| 0.17 | 1659 | 27.65 0.01 [23.3] | – | – | – | ||
| 0.18 | 648 | 28.49 0.02 [25.5] | – | – | |||
| 0.19 | 657 | 28.76 0.04 [15.0] | – | – | 403 1 [28.4] | ||
| 0.20 | 812 | 28.82 0.02 [19.5] | – | – | |||
| SALT005 | 1.74 | 708 | – | – | 28.82 0.04 [7.6] | – | |
| 1.76 | 734 | 91.43 0.37 [4.0] | 45.69 0.08 [4.7] | – | – | ||
| 1.77 | 432 | – | 42.14 0.17 [5.9] | – | – | ||
| 1.79 | 605 | – | – | 28.93 0.05 [6.4] | |||
| 1.80 | 605 | – | 45.30 0.09 [8.8] | – | 424 1 [19.7] | ||
| 1.81 | 432 | – | 41.25 0.16 [4.5] | – | |||
| 1.81 | 544 | – | 45.09 0.13 [6.5] | 28.49 0.06 [6.1] | |||
| SALT016 | –0.09 | 845 | 22.05 0.03 [4.6] | – | – | – | |
| –0.05 | 1146 | 24.78 0.03 [3.1] | – | – | 400 1 [25.7] | ||
| SALT017 | 0.84 | 1987 | – | 38.33 0.03 [4.4] | – | – | |
2.3.2 2005 December 9 (SALT004)
In the rapid variation regime the immediately obvious features of the light curve (Fig. 2) are the presence of persistent large amplitude ( 0.1 mag) DNOs and several cycles of similar amplitude QPOs. A Fourier transform (FT) of the entire longer section of the run provides an average period of 28.4 s for the DNOs, and mean period of 403 s for the QPO, though the individual cycles have periods that range over 380 – 440 s, demonstrating their quasi-periodicity. We will look at these modulations in greater detail below. We note here that the ratio = 403/28.4 = 14.2 is similar to what we have found before, and that the two periods fit perfectly onto the correlation diagrams of and with (figures 1 and 10 of Paper IV).
In Fig. 3 we show some examples (each 346 s long) of magnified short sections of the light curve, which demonstrate the good signal/noise aspects of the light curve – in fact, for study of the DNOs there is considerable over-sampling, but the potential for finding higher frequency modulations is evident, which was largely the stimulus for carrying out this investigation. Although it emerges that there are no new periodicities to be found with periods 10 s, the short sections of DNO modulation shown in Fig. 3 shows that the maxima and minima of some cycles are very sharp, with significant changes on time scales 1 s. Previous observations would have integrated over these rapid changes.

2.3.3 2008 January 6 (SALT017)
This very short run shows three obvious cycles of a long time scale modulation, probably a QPO. There are no DNOs immediately evident in the light curve.
2.3.4 2006 December 18 (SALT005)
The overall curvature of the time series data is not understood – maximum brightness of the orbital hump is predicted (van Amerongen et al. 1987) to be roughly in the centre of the run, when VW Hyi was observed at its lowest brightness. DNOs and QPOs are occasionally present in the light curve, which is rare with VW Hyi essentially back in quiescence, but not unprecedented – the light curve obtained on 14 Nov 1985 (Paper I) at = 2.26 had a DNO in it with = 24.7 s, which seemed anomalous at the time but following the discussion in Paper IV on frequency doubling and tripling we now recognize it as a second harmonic, not the fundamental DNO.
3 The DNOs and QPOs
We now look in more detail at the DNO and QPO behaviours in each of the four light curves. None of the FTs shows any coherent periodicities at periods shorter than 13 s.
3.1 The 2008 January 5 Run (SALT016)
We divided the light curve into 10 equal subsections (of length 600 s), the first six of which contain no evidence for DNOs, after which a clear signal at 22.05 s is seen in the seventh section. The next obvious DNO in the FT occurs in the combined ninth and tenth sections at a period of 24.78 s and also a very strong QPO at 400 s. More details are given in Table 2.
We now introduce an diagram, as defined in Paper IV, which gives the Observed – Calculated amplitude and phase variations relative to a fixed period. The diagram of the final part (UTC 0.90 – 0.93) of the light curve, relative to the period 24.78 s, is shown in Fig. 4. Up until 0.918 the DNO has a constant period, after which the period lengthens, as part of the general increase in period normally seen in the decline phase of the light curve. During this latter part there is strong amplitude modulation (middle panel), seen to be approximately in antiphase with the QPO in the light curve (upper panel). This is an indication that we are seeing the synodic and not the sidereal DNO – the DNO rotating beamed radiation is reprocessed off the 400 s QPO travelling wave. This implies = 23.33 s.

3.2 The 2005 December 9 Run (SALT004)
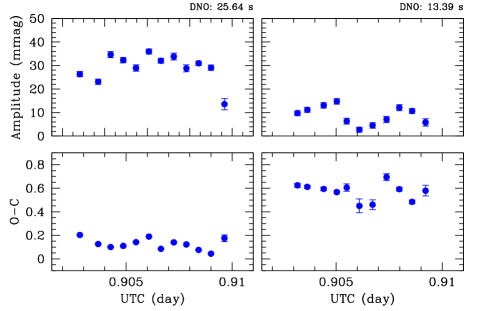
We divided the run into five subsections. The FTs naturally show very strong DNO peaks, their periods increasing through the run, with a mean period of 25.64 s and mean amplitude 26.6 mmag in the short first section and periods at 27.65 s (23.3 mmag) in the second section, increasing to 28.82 s (19.5 mmag) towards the end. There are short lived appearances of lpDNOs, e.g. at 86.6 s and 94.8 s. This general behaviour only serves to add more weight to the same correlations previously found (figure 3 of Paper I and figure 1 of Paper IV).
Fig. 5 shows the diagram for the second part of the light curve (subsections 2 to 5), here split into only two sections, which shows a sudden change of behaviour roughly midway through, where the mean DNO period (adopted for calculating ) changes from 27.65 s to 28.50 s. The first section shows cyclical phase variations (Fig. 5), an FT of which gives a period of 475 13 s, but an FT of the same piece of light curve itself shows no significant QPO period demonstrating (as occasionally seen before) that although the rotating DNO beam intersects the QPO travelling wave, the latter is not necessarily visible in the direction of the observer.
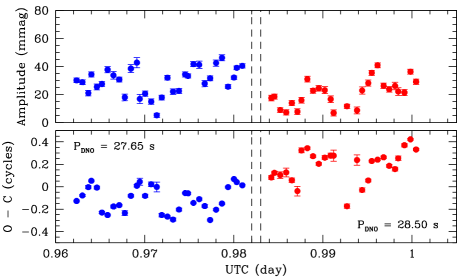

The FT (Fig. 6) of the short first part of the run shows a peak at 13.39 s, which has not been previously seen in any of the extensive studies of VW Hyi. We see from figure 10 of Paper IV that the expected QPO fundamental at = 0.10 – 0.20 d is 400 – 550 s with a first harmonic probably appearing during this at 300 s. The cyclic phase variation seen in the short first part of the run corresponds to the QPO fundamental. The 13.39 s modulation is not the harmonic of the observed DNO (the sidereal period at 25.64 s), but if it is the first harmonic of the synodic period (i.e., /2) then the beat between sideral and synodic periods is at 602 s, which is in the neighbourhood of the QPO period expected from the general correlation with . In the first section of the second, long part of the run, with VW Hyi having faded by 0.4 mag, the main DNO modulation is at 27.45 s and the short period modulation has increased in period to 15.15 s. If it is still a synodic first harmonic it would produce an expected beat at 292 s, which presumably is now the first harmonic of the (still unobservable) QPO.
FTs of the sections of light curve shown in Fig. 3 show only fundamentals of the DNO modulations – although the departure from sinusoidality of some of the pulsations shows that there must be harmonics present they are not detectable above the noise. These oscillations in VW Hyi are almost identical to those commonly observed in intermediate polars, for example see figure 1 of Warner & Cropper (1984), where the light curve of V1223 Sgr has some sharp spikes in it similar to those in Fig. 3 but where it is also stated that no first harmonic is detectable in the FTs of the whole light curves.
3.3 The 2008 January 6 Run (SALT017)
As mentioned above, there are no prominent DNOs in the lightcurve. The run is so short in length that we cannot certainly identify the nature of the three large amplitude peaks, with separations 770 s. After prewhitening (i.e. subtraction from the light curve) with these modulations, the FT (Fig. 8) shows several low amplitude oscillations that have significant relationships among their frequencies. The 5.7 mmag peak at 122.80 0.27 s has a harmonic at 61.50 0.08 s (4.4 mmag). The other two peaks are at 67.36 0.10 s (4.1 mmag) and 38.33 0.03 s (4.4 mmag). The latter is not a harmonic of the former, but if the former is a sidereal period the latter could be a harmonic of a corresponding synodic period with an implied (but not observed) QPO period 550 s (see discussion of similar structure in Sect. 3.2).

3.4 The 2006 December 18 Run (SALT005)
FTs show that there are DNOs present about half of the time in this light curve, near three principal periods, viz 29 s, 42 s and 45 s. From the diagrams at these periods we selected for detailed analysis the regions where the amplitudes are largest (typically 5 mmag) or the phases are most coherent. The individual coherent lengths range from 400 s to 740 s. The results are summarized in Table 2.

We interpret the three periods in the following way: the 45 s and 29 s periodicities are an example of the 3:2 ratio first discussed in Paper IV (which here is a 3:2 ratio in the first harmonic of the synodic period), and this is supported by the brief appearance of a fundamental of the synodic period at 91 s in one section (see Table 2). The 45 s and 42 s periodicities are synodic and sidereal DNOs, for which we would expect a QPO at 460 s, and there is indeed a strong QPO at 420 s (see Fig. 9). Also seen in Fig. 9 is the switch from synodic to sidereal period and back, as seen before in VW Hyi (see figure 12 of Paper IV – which is switching of the second harmonic – and seen in TY PsA in figures 1 and 2 in Paper VI). One section of the light curve contains the 29 s and 45 s modulations present simultaneously.
4 Discussion
In the various runs we have identified many of the DNO and QPO components seen in previous studies – namely , , , 2 , 2 and . In addition, for the first time we have seen the harmonic 2 () early in the evolution, when the fundamental period was 22 s, and the harmonics 2() and 3() at the very end of an outburst, when the fundamental period was 90 s. We will not attempt to explain these components beyond what has already been proposed in Papers II and IV, but we note the richness of the FTs, which is a challenge for any model.
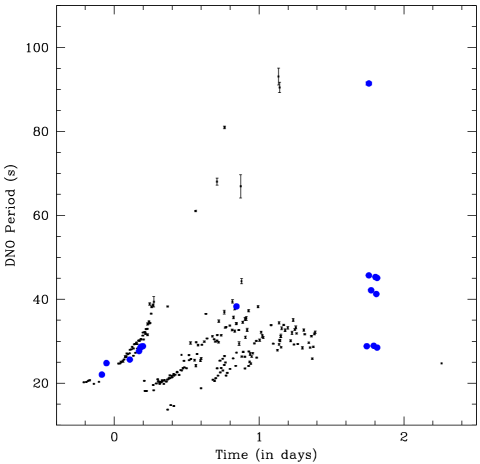
Our new observations add an interesting extension to the evolution of DNO periods and harmonics in VW Hyi. Fig. 10 is based on figure 1 of Paper IV with addition of our new observations. We note first that our identification in Section 3.1 of the 24.78 s modulation as rather than results in better agreement with the evolution. The DNOs observed at 1.8 d, and the later DNO mentioned in Sect. 2.2.4, demonstrate that after 1.1 d the DNOs cease to increase, as was suspected in Paper IV. The maximum value of the implied is 90 s, which is essentially the same as the maximum value of in VW Hyi (Paper III) – the lpDNOs show little evolution in VW Hyi, increasing in period by about 10% through an outburst, ultimately converging on the same period as that of the fundamental DNO.
Acknowledgments
We thank Albert Jones for providing alerts of outbursts of VW Hyi, and Pauline Loader for supplying a file of the archived observations of VW Hyi collected by the Royal Astronomical Society of New Zealand. We kindly acknowledge the use of the AAVSO observational archive of VW Hyi for determining the shape of the 2008 January outburst light curve. PAW’s and BW’s research is supported by the University of Cape Town and the National Research Foundation of South Africa. All of the observations reported in this paper were obtained with the Southern African Large Telescope (SALT), a consortium consisting of the National Research Foundation of South Africa, Nicholas Copernicus Astronomical Center of the Polish Academy of Sciences, Hobby Eberly Telescope Founding Institutions, Rutgers University, Georg-August-Universität Göttingen, University of Wisconsin - Madison, Carnegie Mellon University, University of Canterbury, United Kingdom SALT Consortium, University of North Carolina - Chapel Hill, Dartmouth College, American Museum of Natural History and the Inter-University Centre for Astronomy and Astrophysics, India.
References
- [1] O’Donoghue D., et al., 2006, MNRAS, 372, 151
- [2] Paczynski B., 1978, in Zytkow A., ed., Nonstationary Evolution of Close Binaries. Polish Scientific Publ., Warsaw, p. 89
- [3] Pretorius M.L., Warner B., Woudt P.A., 2006, MNRAS, 368, 361 (paper V)
- [4] Steeghs D., O’Brien K., Horne K., Gomer R., Oke J.B., 2001, MNRAS, 323, 484
- [5] van Amerongen S., Damen E., Groot M., Kraakman H., van Paradijs J., 1987, MNRAS, 225, 93
- [6] Warner B., 1995, Cataclysmic Variable Stars, Cambridge Univ. Press, Cambridge
- [7] Warner B., 2004, PASP, 116, 115
- [8] Warner B., Brickhill A.J., 1978, MNRAS, 182, 777
- [9] Warner B., Cropper M., 1984, MNRAS, 206, 261
- [10] Warner B., Pretorius M.L., 2008, MNRAS, 383, 1469 (paper VI)
- [11] Warner B., Woudt P.A., 2002, MNRAS, 335, 84 (paper II)
- [12] Warner B., Woudt P.A., 2006, MNRAS, 367, 1562 (paper IV)
- [13] Warner B., Woudt P.A., Pretorius M.L., 2003, MNRAS, 334, 1193 (paper III)
- [14] Woudt P.A., Warner B., 2002, MNRAS, 333, 411 (paper I)