Charged Kaon Mass Measurement using the Cherenkov Effect
Abstract
The two most recent and precise measurements of the charged kaon mass use X-rays from kaonic atoms and report uncertainties of 14 ppm and 22 ppm yet differ from each other by 122 ppm. We describe the possibility of an independent mass measurement using the measurement of Cherenkov light from a narrow-band beam of kaons, pions, and protons. This technique was demonstrated using data taken opportunistically by the Main Injector Particle Production experiment at Fermi National Accelerator Laboratory which recorded beams of protons, kaons, and pions ranging in momentum from +37 GeV/ to +63 GeV/. The measured value is 491.3 1.7 MeV/, which is within 1.4 of the world average. An improvement of two orders of magnitude in precision would make this technique useful for resolving the ambiguity in the X-ray data and may be achievable in a dedicated experiment.
1 Introduction
The charged kaon mass is an important input in determining the CKM matrix element from measurements of the branching ratio of . The value of the charged kaon mass reported by the Particle Data Group is 493.677 MeV/ with an uncertainty of 26 parts per million (ppm) [1]. This value is a weighted average of six measurements but is dominated by the two most recent and precise measurements from Denisov [2] and Gall [3] which measure X-ray energies from kaonic atoms. While these measurements report uncertainties of 14 and 22 ppm they differ by 122 ppm (4.6). In this article we explore one possibility to resolve this discrepancy using an independent technique for measuring the charged kaon mass based on the Cherenkov effect. The well known pion and proton masses are used as references. The technique is demonstrated using data taken opportunistically using the Ring Imaging Cherenkov (RICH) sub-detector of the Main Injector Particle Production (MIPP) experiment at Fermilab [4].
2 Measurement Concept
Cherenkov light is emitted when a relativistic charged particle of mass , momentum , and speed travels through a radiator volume of index of refraction with . (As is customary in high energy physics we work in units in which the speed of light, , is 1.) Neglecting dispersive effects for the moment, the light is emitted in a cone at an angle given by [5, 6] which is approximately
| (1) |
for small angles. Now, consider two particles and with identical momenta but different masses , and speeds , . They will emit Cherenkov light at angles , which are related by the expression
| (2) |
In the relativistic limit , . This, when combined with Eqn. 2, gives
| (3) |
where we have neglected the small difference between and . If the particles and are pions, protons, and kaons, we have two independent angle-squared differences that can be measured
| (4) |
Using these, the kaon mass is given by
| (5) |
where . Notice that for a monochromatic beam in the absence of dispersion the index of refraction and momenta drop out. The kaon mass can be determined, in principle, through measurements of the pion and proton masses and the Cherenkov angles of the three particles. The proton and pion masses are known to 0.9 ppm and 2.5 ppm respectively and will not be the limiting factors in the experiment.
Using Eqn. 5 we can estimate the uncertainty in measured using this method as:
| (6) | |||||
The first two terms are due to the uncertainties in the pion and proton masses and are small. The third term grows with momentum and suggests that it is best to conduct the measurement at as low a momentum as possible where the differences in the Cherenkov angles are largest, while staying above proton threshold.
In a RICH detector, the angle can be determined on a track-by-track basis from the pattern of Cherenkov photons recorded. However, the light for a single ring will be distributed about the central angle due to the variation of the index of refraction of the radiator medium over the wavelengths at which Cherenkov photons are produced. This gives as contribution to the uncertainty in the average angle determined from a single track of
| (7) |
where is the amount of dispersion over the photomultiplier tube (PMT) wavelength acceptance and is the number of PMT hits in the ring.
In a beamline, particles will be accepted if their momentum lies in a narrow window about some central value . The finite size of this momentum acceptance window introduces an additional uncertainty in the average angle measured from a single track. Averaging over rings, the momentum spread contributes an uncertainty
| (8) |
to the measurement of , where is the spread in the beam particle momenta about their central value. We take the specific case of an experiment using CO2 as the radiator (, ) and a beam of central momentum 40 GeV/ with a width of =0.01. Under these assumptions, values are in good agreement with observed widths of ring radius distributions. This gives a statistical uncertainty in the kaon mass of
| (9) |
where the first term results from uncertainties in the pion mass, the second from uncertainties in the proton mass, and the final three terms result from uncertainties in the angles , , and with , , and being the number of millions of pion, kaon, and proton rings recorded. Using Eqn. 9 we find that the uncertainty is minimized if 32% of the data is collected using protons, 23% using pions, and 45% using kaons. This result is only weakly dependent on momentum as shown in Figure 1 which plots the expected statistical precision of the charged kaon mass as a function of momentum choice and total number of rings recorded.
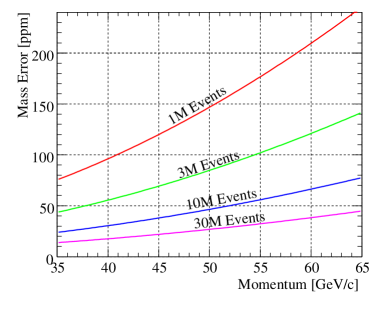
With 10 million rings at 40 GeV/c, we expect a statistical precision of 30 ppm using this technique.
3 RICH detector overview
The RICH detector used by MIPP was built by the SELEX Collaboration [7] for use in that experiment. We summarize here only the most important features of the detector as deployed for the MIPP experiment and refer the reader to [8, 9, 10, 11] for details.

The geometry of the RICH counter is shown in Figure 2. The detector was constructed from a low carbon cylindrical steel vessel 10.22 m in length and 93 in. in diameter with a wall thickness of in. The ends were sealed with 1.5 in. thick aluminum flanges that were cut out to hold thin beam windows at each end and a photomultiplier tube holder plate at the upstream end. The vessel was wrapped by a water line carrying chilled water and 15 cm of building insulation to regulate the temperature.
A 2.4 m1.2 m array of 16 mirrors mounted at the downstream end of the counter focused Cherenkov light on an array of 1/2 in. photomultiplier tubes. On average the mirrors had a radius of curvature of 1980 cm with variations less than 5 cm and a reflectivity of more than 85% at 160 nm.
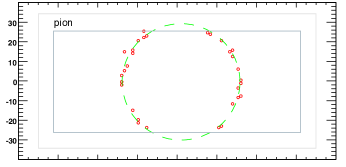
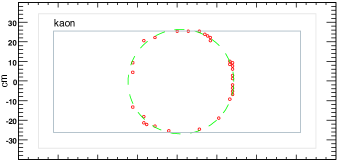
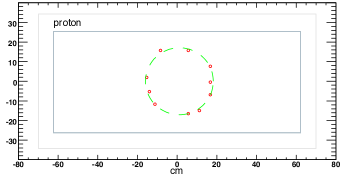
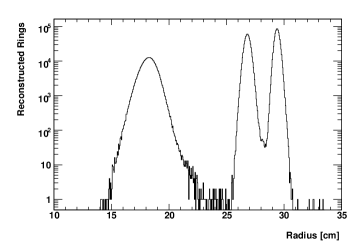
MIPP used CO2 gas held at just above atmospheric pressure as the radiator. At STP, CO2 has an index of refraction of 1.00045 at nm giving thresholds of GeV/ for pions, 17 GeV/ for kaons, and 31 GeV/ for protons. The gas temperature and pressure were continuously monitored enabling calibration of the index of refraction. A particle produced a ring of radius 29.5 cm and an average of 30 PMT hits providing 3 / separation up to 80 GeV/ and 3 / separation up to 120 GeV/. Figure 3 shows sample event displays for each beam species showing PMT hits and reconstructed rings.
The PMTs were mounted in a hexagonal array behind a 2 mm thick quartz window which provided a gas-tight seal between the phototubes and the radiator volume. They were read out in threshold (on/off) mode. Two models of PMTs were used: Hamamatsu R760 and Russian made FEU60. The FEU60 tubes were coated with a wavelength shifter to match the acceptance region of the R760’s. The R760 (FEU60) tubes have a maximum quantum efficiency of about 25% (11%) at 350 nm. Of the available 89 PMT columns, 68 were used, with R760’s installed in 15 columns and FEU60’s installed in 53 columns. The front-end electronics of the RICH detector was re-designed and rebuilt by the MIPP collaboration.
4 Data Analysis
In outlining the measurement concept, we made several simplifying assumptions which must be accounted for during analysis. Due to dispersion, Cherenkov light is not observed at a single angle, but as a distribution across several angles. In our analysis, we measured the average PMT occupancies for pion, proton, and kaon rings as a function of Cherenkov angle in data and compared them to calculations which incorporated the kaon mass as a free parameter. In total 12 million rings were recorded for this measurement using positively charged beams of pions, kaons, and protons ranging from 37 GeV/ to 63 GeV/ in momentum.
In the data, wire chambers upstream and downstream of the RICH counter were used to reconstruct the particle trajectory and predict the center of the RICH ring. Using that prediction for the center position, a Cherenkov angle was assigned to each PMT and the average probability for a PMT to fire was computed as a function of Cherenkov angle. This procedure was done separately for each PMT type, mirror, and momentum setting. As the measurement was made with beam particles, light struck only the two central mirrors, labeled 8 and 9.
To compare to the data, we calculated the expected occupancy of each PMT in the RICH array for pion, proton, and kaon rings. The calculation starts with the number of Cherenkov photons produced per unit path length between wavelengths and [5, 6]:
| (10) |
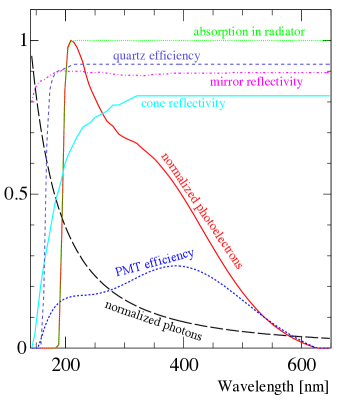
where is the fine structure constant. These photons travel through the radiator medium, reflect off mirrors, pass through a quartz window, and are collected by a reflective cone before they are incident on the photodetector. The transmission probability for a Cherenkov photon of wavelength for each of these steps is plotted in Figure 4 along with the photodetector efficiency. Combining these factors, the average number of photoelectrons detected by PMT is given by
| (11) | |||||
where is the product of all wavelength-dependent efficiency factors, is the absorption coefficient of CO2, is the mirror focal length, and is the geometric acceptance of the PMT. Scattering of light from angular bin to bin is accounted for by the function . The light scattering was modeled as a Gaussian of width with three components. These include an intrinsic term independent of wavelength and a wavelength-dependent dispersive term [12]. A third term accounts for multiple scattering of the beam particle in the RICH radiator:
| (12) |
where is the intrinsic scattering width and is the dispersive scattering width. The calculated shapes are implicitly functions of the particle masses through .
Using Poisson statistics, the probability for a PMT seeing photoelectrons to be on is:
| (13) |
where accounts for the PMT dark noise rate.
The measured and calculated PMT occupancies were compared using a statistic. In the comparison several parameters were allowed to vary to minimize . These were:
-
i.
Intrinsic detector smearing width,
-
ii.
Dispersive smearing width,
-
iii.
Density ratio scaling factor
-
iv.
Density ratio offset
-
v.
Level of air contamination in CO2
-
vi.
Central pion momentum
-
vii.
Width of momentum distribution
-
viii.
Kaon mass
The density ratio is defined as the gas density inside the RICH divided by density at STP and was varied to account for uncertainties in the calibration of the pressure and temperature monitors installed in the counter.
The momentum acceptance of the beamline was modeled as a Gaussian and uncertainties in the mean and width of this acceptance were incorporated into the calculation. The average proton and kaon momenta accepted by the beamline differ slightly from the average pion momentum due to variations in particle production at the secondary target. This effect was incorporated using a simulation of the copper secondary target using the FLUKA [13, 14] production model.
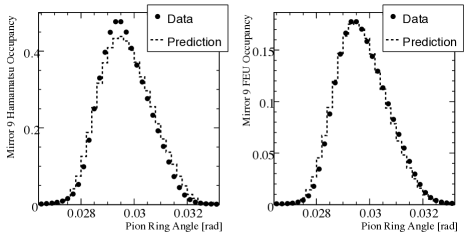
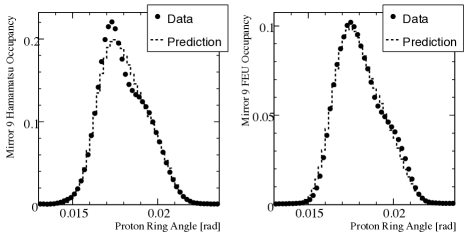

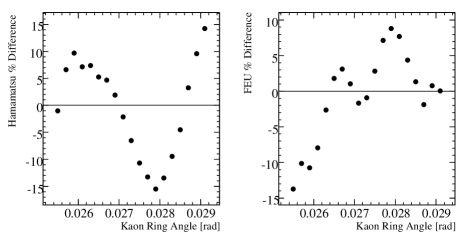
After all known effects were accounted for there were (10%) differences between the measured and calculated PMT occupancies, due presumably to our incomplete understanding of the factors which control Cherenkov photon production and transport in our detector. To account for these differences, the uncertainties in the PMT occupancies were increased until was achieved at the minimum. The scaling factor ranged from about 25 to 100 for the different combinations of PMT type, mirror, and beam momentum. Systematic uncertainties overwhelm the statistical uncertainties for this data set. A sample fit for 40 GeV/ data is shown in Figure 5. Percent difference between data and predicted occupancy is shown in Figure 6. They agree within 5-15% over the angular rangue illuminated by kaon rings. This difference is typically 15 times larger than the statistical uncertainty in each angular bin.
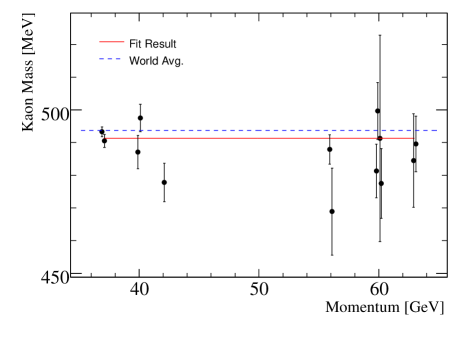
Kaon mass results for each data set are shown in Figure 7. Using just the low momentum data sets results in a kaon mass measurement of 491.9 1.1 MeV; using just the high momentum data sets gives 486.7 3.0 MeV. These results agree within uncertainties and are combined to give a final result for the charged kaon mass of 491.3 1.7 MeV (3500 ppm). The convention of scaling error bars when combining measurements so that is followed resulting in a larger final uncertainty. This result is within 1.4 of the PDG value [1].
See [15] for a detailed discussion of the analysis presented in this paper.
5 Suggestions for Improvement
In the analysis above we achieved an understanding of the PMT occupancies as a function of Cherenkov angle at the 10% level resulting in a final uncertainty in the kaon mass of 3500 ppm. If the uncertainties in the PMT occupancies could be reduced to 1% the contribution of this source of uncertainty in the kaon mass would be reduced to the level of the statistical uncertainties and make this technique useful for resolving the 122 ppm discrepancy in the X-ray measurements.
The largest uncertainty in our calculation of the PMT occupancy as a function of angle results from knowledge of the acceptance of the PMT array which was complicated by cross-talk in the readout electronics – a problem which manifested itself during the high rate conditions the detector was operated under for this measurement. Occasionally, a single PMT hit would cause all 16 channels sharing the same readout board to register a hit. In our analysis we rejected PMT hits that appeared to be due to cross-talk. As the cross-talk was difficult to model, its affect on the PMT acceptances has large uncertainties accounting for most of the 10% uncertainty in PMT occupancy as a function of angle.
Additional uncertainties in the occupancies result from our treatment of the detector response as a function of wavelength. A measurement of the PMT response on a tube-by tube basis would have required dis-assembly of the detector and was not undertaken, rather we used a single average response for all PMTs. As the response of individual PMTs typically differ from the average by about 15%, this introduces an uncertainty of 6% in the calculation of occupancy versus angle. Likewise, we assumed identical reflection efficiencies for the two reflecting mirrors. Taken together, the uncertainties in the PMT acceptances and spectral response of the optical system contribute 3400 ppm to our measurement of the kaon mass.
During the run the temperature and pressure of the radiator gas varied considerably and the index of refraction had to be calibrated several times a day. We estimate that uncertainties in the knowledge of index of refraction contributed 500 ppm in our kaon mass measurement. The spread on the beam momentum about its central value contributed roughly 50 ppm to the kaon mass measurement.
To achieve 40 ppm precision with this technique each of the uncertainties listed above would need to be addressed. The largest improvements are to be gained by using a simpler optical system which could be completely characterized and operated at a more consistent pressure and temperature free from electronic cross-talk problems. For example, the optical system would be simpler if only a single primary mirror could be used and the transmission windows eliminated. Use of a fine-grained optical detector would allow for the device to be made much more compact allowing for better control of pressure and temperature. A more compact device could be built to run with large excursions in gas pressure and temperature allowing for the variation in the index of refraction with temperature and pressure to be studied in situ. Finally, a charge based readout (rather than the on/off readout used in the above analysis) would allow for better pixel-by-pixel knowledge of the detector response. This configuration could be achieved, for example, by replacing the secondary mirror in the MIPP beam Cherenkov counter with a GEM-based photo-cathode [16] which would afford 30 micron resolution of the Cherenkov rings in a device with is 45.7 cm in diameter and 22.9 m long. A complete assessment of the performance of such a device would require a significant research effort and awaits an experimental proposal. We hope that this initial work will inspire these future investigations.
In conclusion, we have used the Cherenkov effect to measure the charged kaon mass with 3500 ppm precision using an existing RICH detector. We believe that there are significant opportunities for a future experiment dedicated to the kaon mass measurement to reduce systematic uncertainties to the level where this technique may be useful to resolve the 122 ppm discrepancy in the X-ray measurements of the charged kaon mass.
Acknowledgments
Fermilab is operated by Fermi Research Alliance, LLC under Contract No. DE-AC02-07CH11359 with the United States Department of Energy.
References
- [1] C. Amsler et al., “Particle data group,” Phys. Lett. B667 1 (2008) 704.
- [2] A. Denisov et al., “New measurement of the mass of the meson,” JEPT Lett. 54 (1991) 558.
- [3] K. Gall et al., “Precision measurement of the and masses,” Phys. Rev. Lett. 60 (1988) 186.
- [4] “MIPP Collaboration.”. http://ppd.fnal.gov/experiments/e907/.
- [5] V. Zrelov, Cherenkov Radiation in High-Energy Physics. Israel Program for Scientific Translations, Ltd., 1970.
- [6] J. Jelley, Cherenkov Radiation and its Applications. Pergamon Press, 1958.
- [7] “SELEX Collaboration.”. http://fn781a.fnal.gov.
- [8] J. Engelfried et al., “The SELEX phototube RICH detector,” Nucl. Instr. and Meth. A 431 (1999) 53–69.
- [9] J. Engelfried et al., “The RICH detector of the SELEX experiment,” Nucl. Instr. and Meth. A 433 (1999) 149–152.
- [10] J. Engelfried et al., “The e781 (SELEX) RICH detector,” Nucl. Instr. and Meth. A 409 (1998) 439–442.
- [11] L. Stutte, J. Engelfried, and J. Kilmer, “A method to evaluate mirrors for Cherenkov counters,” Nucl. Instr. and Meth. A 369 (1996) 69.
- [12] R. Forty and O. Scheider, “RICH pattern recognition.” Lhcb technical note number lhcb/98 040, 1998. http://lhcb.web.cern.ch/lhcb-rich/html/lhcb_rich_notes.htm.
- [13] A. Fasso’, A. Ferrari, J. Ranft, and P. Sala, “FLUKA: a multi-particle transport code.” Cern 2005-10, infn/tc_05/11, slac-r-773, 2005.
- [14] A. Fasso’ et al., “The physics models of FLUKA: status and recent developments,” in Computing in High Energy and Nuclear Physics Conference. 2003.
- [15] N. J. Graf, Measurement of the Charged Kaon Mass with the MIPP RICH. PhD thesis, Indiana University, Bloomington, IN, August, 2008.
- [16] C. D. R. Azevedo et al., “Towards THGEM UV-photon detectors for RICH: on sinlge-photon detection efficiency in Ne/CH4 and Ne/CF4,” arXiv:0909.5357 [physics.ins-det].