On the optimal form of branching supply and collection networks
Abstract
For the problem of efficiently supplying material to a spatial region from a single source, we present a simple scaling argument based on branching network volume minimization that identifies limits to the scaling of sink density. We discuss implications for two fundamental and unresolved problems in organismal biology and geomorphology: how basal metabolism scales with body size for homeotherms and the scaling of drainage basin shape on eroding landscapes.
pacs:
89.75.Fb,89.75.Hc,87.19.U-,92.40.GcIn both natural and man-made systems, branching networks universally facilitate the essential task of supplying material from a central source to a widely distributed sink population. Branching networks also underlie the complementary process of collecting material from many sources at a single sink. Such networks typically exhibit structural self-similarity over many orders of magnitude: river networks drain continents (Horton, 1945; Tokunaga, 1966; Rodríguez-Iturbe and Rinaldo, 1997), arterial and venal networks move blood between the macroscopic heart and microscopic capillaries (Fung, 1990), and trees and plants orient leaves in space taking on the roles of both structure and transportation.
We address the following questions regarding supply networks: (1) What is the minimum network volume required to continually supply material from a source to a population of sinks in some spatial region ?; and (2) How does this optimal solution scale if is rescaled allometrically? (For convenience, we use the language of distribution, i.e., a single source supplying many sinks.) Our approach is inspired by that of Banavar et al. (Banavar et al., 1999, 2002) who sought to derive scaling properties of optimal transportation networks in isometrically growing regions based on a flow rate argument; Banavar et al.’s approach followed the seminal work of West et al. (West et al., 1997) who suggested supply networks were key to understanding the metabolic limitations of organisms, and focused on network impedance minimization (see (Dodds et al., 2001; Makarieva et al., 2003)). In contrast to this previous work, our treatment is explicitly geometric. We also accommodate four other key features: the ambient dimension, allometrically growing regions, variable sink density, and varying speed of material transportation.
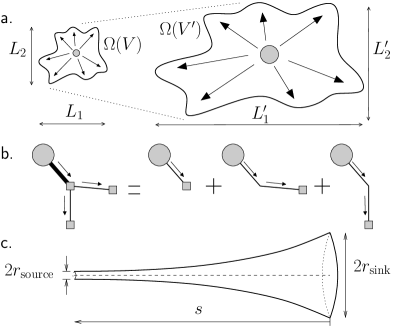
We consider the problem of network supply for a general class of -dimensional spatial regions in a dimensional space. Each region has volume and overall dimensions (see Fig. 1a). We allow these length scales to scale as , creating families of allometrically similar regions. For isometric growth, all dimensions scale uniformly meaning , while for allometric growth, we must have at least one of the being different (Fig. 1b). For the general case of allometry, we choose an ordering of such that the length scales are arranged from most dominant to least dominant: .
We assume that isolated sinks are located throughout a contiguous spatial region (volume ) which contains a single source located at . We allow sink density to follow where is fixed, , and is the distance from the source. When the exponent , is constant throughout the region (as for capillaries in organisms), but remains a function of the region’s overall volume . While decreasing sink density () does not reflect the reality of biological organisms, it is not an unreasonable postulate for other supply/collection systems, and may be of use in modelling transportation to and from cities. Last, we assume each sink draws approximately the same amount of material from the source per unit time. The material travelling from the source to a specific sink takes up a certain volume of the network, and while this volume of material may not be coherent away from the sink, we can nevertheless imagine separate ‘virtual vessels’ transporting material from the source to the sinks (see Fig. 1b). (Only in the smallest, outer branches will virtual vessels coincide with physical vessels.) Material flow rate will then vary according to changes in the cross-sections of these vessels.
We take the cross-sectional area of these virtual vessels to be bounded by a fixed upper limit at the sink (see Fig. 1b). We allow that material speed may increase with proximity to the source, meaning these virtual vessels may taper. If the radius decreases as , where is the length of the vessel as measured from the sink and is a constant, then the volume of a virtual vessel grows as for and for (we can therefore focus on to represent the latter case). We ignore all other possible taperings since only an algebraic decay relationship between vessel radius and length will affect the scaling of overall network volume . If however, there is a minimum virtual vessel radius (i.e., a limit to material speed) then vessel volume must grow linearly with length: .
The overall network volume is the sum of all virtual vessel volumes, and is evidently minimized when virtual vessels travel directly from the source to each sink—the extreme case of a star network. While real, large-scale distribution networks are branched, many examples are close to this limit in terms of path length (Gastner and Newman, 2006). Minimal network volume therefore grows as
| (1) |
where , and we have indicated a spatial region scaled to have volume by . The integral’s leading order behavior gives the optimal scaling of with :
| (2) |
where again . When , . The scaling of minimal network volume with is thus governed by sink density , vessel scaling, and the dominant length scale through , and we first address the role of the latter. Since for isometric scaling, , whereas for allometric scaling, , we immediately see that from a scaling perspective, isometrically growing regions require less network volume than allometrically growing ones, and are in this sense more efficiently supplied. Efficiency also increases with the dimension since network volume scales more closely with overall volume ( decreases). Furthermore, shapes that scale allometrically effectively function as lower-dimensional, isometrically scaling objects and are therefore less efficiently supplied (the equivalent spatial dimension is ).
We see from Eq. (2) that network volume straightforwardly increases linearly with . How in turn scales with depends on the specific system, and in particular on whether or . We now specialize our general result for the two cases of blood networks and river networks.
Blood networks [==3]: If material is costly, as in the case of blood, then we expect that isometric scaling () to be attained by evolution. We take because capillaries (the sinks) are distributed relatively uniformly. Furthermore, since both blood velocity in the aorta and in capillaries change little with during resting states (West et al., 1997; Weinberg and Ethier, 2007), we have . Lastly, it is well observed that the volume of blood scales linearly with organismal volume (Stahl, 1967), . (In general, for , we must have as otherwise we would have the nonsensical limits of or as .) Since we already have that , the additional constraint means sink density must decrease as volume increases: , where for resting organisms now refers to the effective or active sink density (organisms at rest have a substantial proportion of inactive capillaries that are called into use during higher rates of overall activity (Hoppeler et al., 1981)).
It follows that , the average rate of energy use in a resting state (basal power), which is proportional to the number of active sinks in , can at best scale as , where we have assumed that scales as body mass . For three dimensional organisms, we therefore have
| (3) |
If organism shapes obey instead an allometric scaling then power scales more slowly as with , contrary to the McMahon’s theory of elastic similarity (McMahon, 1973).
We note that in detail, blood networks do not appear to have universal forms (Huang et al., 1996), showing substantial variation in branching structure across and within species; we therefore argue that it is only the system level that matters and that branching networks need only approximate star networks.
Crucially, the scaling law of Eq. (3) balances with the standard one based on organismal surface area . For homeothermic organisms, who must constantly balance heat loss to maintain a steady internal temperature, we have that (due primarily to radiation but also convection (Hardy and DuBois, 1937)). For isometrically scaling organisms, , and this is well supported empirically (Stahl, 1967). Moreover, it is easy to show that only isometrically growing shapes balance since the dimensional surface area of a growing region scales as , and therefore . Thus, the most efficient network in terms of minimal volume is also the one that precisely balances radiative heat loss.
Our seemingly reasonable result, which was empirically observed over a century ago by Rubner (Rubner, 1883), runs counter to nearly eighty years of reports that . Kleiber (Kleiber, 1932) first suggested the exponent might be 3/4 in the 1930’s after measuring a value of 0.76 for 13 mammals (his practical reason for choosing 3/4 was to simplify slide rule calculations (Schmidt-Nielsen, 1984)). In the decades following, a general but not universal consensus on a “3/4-law of metabolism” was reached (Blaxter, 1965; West et al., 1997; Lane, 2005) The issue remains controversial both theoretically (Dodds et al., 2001; Savage et al., 2008; Kozłowski and Konarzewski, 2004; Brown et al., 2005), and empirically: some recent statistical analyses have shown that a 2/3 exponent is well supported by large data sets for warm-blooded organisms (both birds and mammals) (Heusner, 1991; Dodds et al., 2001; White and Seymour, 2003, 2005) while others have found evidence in favor of a 3/4 exponent or no simple scaling relationship (Savage et al., 2004; Dodds et al., 2001; White et al., 2006, 2007; Packard and Birchard, 2008); and for cold-blooded organisms, plants, and invertebrates, a much broader range of exponent values have been measured empirically and predicted from theory (Patterson, 1992; Glazier, 2005; Reich et al., 2006; Glazier, 2006).
Perhaps the most important aspect of the 2/3 vs. 3/4 debate is that from an optimization point of view, the lower the scaling of resting metabolism the better. A scaling of (or any power exceeding 2/3) would point to either a fundamental scaling limitation for warm-blooded organisms, or to the existence of a cost other than volume minimization, such as impedance (West et al., 1997). Where a higher exponent would be desirable is in the scaling of maximal power , which is unsustainable and depends on stored energy, and indeed, scales almost linearly with mass (Glazier, 2005).
River networks [=3 =2]: The patterns of large-scale river networks have long drawn scientific interest, naturally from hydrologists and geomorphologists (Horton, 1945; Rodríguez-Iturbe and Rinaldo, 1997), but also from statistical physicists seeking evidence of universality in nature (Maritan et al., 1996; Dodds and Rothman, 1999; Banavar et al., 2001; Maritan et al., 2002). In our framework, river networks are collection systems: water flows from many sources (channel heads (Montgomery and Dietrich, 1992)) to a single sink, the outlet of the network’s main stream. The description of river network geometry has often focused on Hack’s law (Hack, 1957) which relates the area of a drainage basin to the length of its longest stream: . Various studies of small-scale basins, starting with Hack’s initial work (Hack, 1957; Rodríguez-Iturbe and Rinaldo, 1997), have suggested that the ‘Hack exponent’ exceeds 1/2, indicating an anomalous allometric scaling of basin shape wherein large basins are relatively long and thin compared to smaller ones. Indeed, for sufficiently small, homogeneous landscapes, there may be a universal value of , yet to be fully understood theoretically Maritan et al. (1996, 2002); Banavar et al. (2001). However, the most comprehensive data sets robustly show that for large-scale networks; in particular, Montgomery and Dietrich (Montgomery and Dietrich, 1992) found that over twelve orders of magnitude variation in basin area, (their data set mixed both Euclidean overall basin length and main stream length ; generally, with very close to, if not equal to, unity).
The empirical observation that accords with our result that with respect to network volume minimization, isometrically growing regions are most efficient; with our optimality argument, this becomes a stronger statement than appealing only to dimensional analysis.
Beyond isometry, we have the scaling of network volume to consider. We now take to be constant and again set , meaning we assume that, when averaged over time, rain falls approximately uniformly across a landscape. We also assume for the continental scale networks we examine below. In contrast to the case of cardiovascular networks, the constraint that network volume must scale as overall volume (or basin area ) cannot apply to river networks, since Eq. (2) now gives . The reason is simple: river networks lie on a dimensional surface embedded in dimensions, and the presence of a third dimension allows the total water in the network to grow faster than if the embedding dimension was .
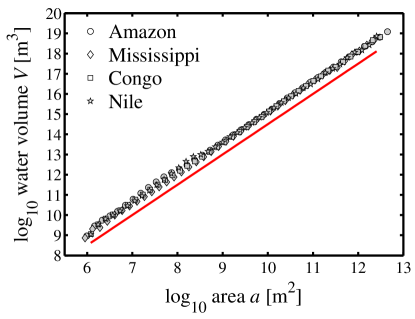
In Fig. 2 we show that scales as for four continental-scale networks: the Mississippi, the Amazon, the Congo, and the Nile (Dodds and Rothman, 2001). The scaling is robust and holds over 6 and 10 orders of magnitude in area and network volume respectively, indicating that self-similar drainage basins most efficiently drain large-scale landscapes.
While we have argued that the optimal scaling corresponds to the isometric case of , we can directly see this connection arising from known scaling laws of river networks (Maritan et al., 1996; Dodds and Rothman, 1999). As put forward in Maritan et al. (2002), network volume scales with basin area as , showing that for the optimal case, we indeed have . Note that only by considering allometrically growing regions, as we do here, can this connection be formally made.
We acknowledge that a stronger optimization may be at work for eroding landscapes. In particular, previous theoretical analyses suggest that in terms of energy minimization, landscapes may reach local, dynamically accessible minima Banavar et al. (2001); Maritan et al. (2002), though sufficient self-averaging inherent in larger landscapes may render such minima indistinguishable from the global one. Nevertheless, our argument and data analysis show that for large-scale networks on heterogeneous landscapes, far exceeding the typical correlation length for precipitation events, a kind of optimal volume minimization is achieved.
With suitable modifications, our findings may be found relevant to other systems, in particular to plants (when seen as two connected branching networks), as well as to the scaling limits of episodic movement such as the transportation of people in and out of city centers. (Assuming constant flow as we do here, then a decay of sink density with follows for growing cities where transportation remains unchanged with city size.) While we have demonstrated that empirical evidence supports a geometric optimality for two kinds of large-scale natural branching networks, not all systems will be optimal or may be optimized. For example, if allometric scaling of organismal shape is demanded by some other constraints (e.g., due to the effects of gravity), then blood volume will be forced to obey a poorer scaling with overall volume (Makarieva et al., 2003).
References
- Horton (1945) R. E. Horton, Bulletin of the Geological Society of America 56, 275 (1945).
- Tokunaga (1966) E. Tokunaga, Geophysical Bulletin of Hokkaido University 15, 1 (1966).
- Rodríguez-Iturbe and Rinaldo (1997) I. Rodríguez-Iturbe and A. Rinaldo, Fractal River Basins: Chance and Self-Organization (Cambridge University Press, Cambrigde, UK, 1997).
- Fung (1990) Y.-C. B. Fung, Biomechanics: motion, flow, stress, and growth (Springer-Verlag, New York, 1990).
- Banavar et al. (1999) J. R. Banavar, A. Maritan, and A. Rinaldo, Nature 399, 130 (1999).
- Banavar et al. (2002) J. R. Banavar, J. Damuth, A. Maritan, and A. Rinaldo, Proc. Natl. Acad. Sci. 99, 10506 (2002).
- West et al. (1997) G. B. West, J. H. Brown, and B. J. Enquist, Science 276, 122 (1997).
- Dodds et al. (2001) P. S. Dodds, D. H. Rothman, and J. S. Weitz, Journal of Theoretical Biology 209, 9 (2001), .
- Makarieva et al. (2003) A. M. Makarieva, V. G. Gorshkov, and B.-L. Li, J. Theor. Biol. 221, 301 (2003).
- Gastner and Newman (2006) M. T. Gastner and M. E. J. Newman, J. Stat. Mech.: Theor. & Exp. 1, 01015 (2006).
- Weinberg and Ethier (2007) P. D. Weinberg and C. R. Ethier, Journal of Biomechanics 40, 1594 (2007).
- Stahl (1967) W. R. Stahl, Journal of Applied Physiology 22, 453 (1967).
- Hoppeler et al. (1981) H. Hoppeler, O. Mathieu, E. Weibel, R. Krauer, S. Lindstedt, and C. Taylor, Respir. Physiol. 44, 129 (1981).
- McMahon (1973) T. McMahon, Science 179, 1201 (1973).
- Huang et al. (1996) W. Huang, R. Yen, M. Mclaurine, and G. Bledsoe, J. Appl. Physiol. 81, 2123 (1996), .
- Hardy and DuBois (1937) J. D. Hardy and E. F. DuBois, Proc. Natl. Acad. Sci. 23, 624 (1937).
- Rubner (1883) M. Rubner, Z. Biol. 19, 535 (1883).
- Kleiber (1932) M. Kleiber, Hilgardia 6, 315 (1932).
- Schmidt-Nielsen (1984) K. Schmidt-Nielsen, Scaling: Why is Animal Size So Important? (Cambridge University Press, UK, 1984).
- Lane (2005) N. Lane, Power, Sex, Suicide: Mitochondria and the Meaning of Life (Oxford University Press, Oxford, UK, 2005).
- Blaxter (1965) K. L. Blaxter, ed., Energy Metabolism; Proceedings of the 3rd symposium held at Troon, Scotland, May 1964 (Academic Press, New York, 1965).
- Kozłowski and Konarzewski (2004) J. Kozłowski and M. Konarzewski, Functional Ecology 18, 283– (2004).
- Brown et al. (2005) J. H. Brown, G. B. West, and B. J. Enquist, Functional Ecology 19, 735– (2005).
- Savage et al. (2008) V. M. Savage, E. J. Deeds, and W. Fontana, PLoS Computational Biology 4, e1000171 (2008).
- Heusner (1991) A. A. Heusner, Journal of Experimental Biology 160, 25 (1991).
- White and Seymour (2003) C. R. White and R. S. Seymour, Proc. Natl. Acad. Sci. 100, 4046 (2003).
- White and Seymour (2005) C. R. White and R. S. Seymour, J. Exp. Biol. 208, 1611 (2005).
- Savage et al. (2004) V. M. Savage, J. F. Gillooly, W. H. Woodruff, G. B. West, A. P. Allen, B. J. Enquist, and J. H. Brown, Functional Ecology 18, 257 (2004).
- White et al. (2007) C. R. White, P. Cassey, and T. M. Blackburn, Ecology 88, 315 (2007).
- Packard and Birchard (2008) G. C. Packard and G. F. Birchard, J. Exp. Biol. 211, 3581 (2008).
- White et al. (2006) C. R. White, N. F. Phillips, and R. S. Seymour, Biol. Lett. 2, 125 (2006).
- Patterson (1992) M. Patterson, Science 255, 1421 (1992), .
- Glazier (2005) D. S. Glazier, Biol. Rev. 80, 611 (2005).
- Reich et al. (2006) P. B. Reich, M. G. Tjoelker, J.-L. Machado, and J. Oleksyn, Nature 439, 457 (2006).
- Glazier (2006) D. S. Glazier, BioScience 56, 325 (2006).
- Maritan et al. (1996) A. Maritan, A. Rinaldo, R. Rigon, A. Giacometti, and I. Rodríguez-Iturbe, Physical Review E 53, 1510 (1996).
- Maritan et al. (2002) A. Maritan, R. Rigon, J. R. Banavar, and A. Rinaldo, Geophys. Res. Lett. 29, 1508 (2002).
- Banavar et al. (2001) J. R. Banavar, F. Colaiori, A. Flammini, A. Maritan, and A. Rinaldo, J. Stat. Phys. 104, 1 (2001).
- Dodds and Rothman (1999) P. S. Dodds and D. H. Rothman, Physical Review E 59, 4865 (1999).
- Montgomery and Dietrich (1992) D. R. Montgomery and W. E. Dietrich, Science 255, 826 (1992).
- Hack (1957) J. T. Hack, United States Geological Survey Professional Paper 294-B, 45 (1957).
- Dodds and Rothman (2001) P. S. Dodds and D. H. Rothman, Physical Review E 63, 016115 (2001).