The EMCCD-Based Speckle Interferometer of the BTA 6-m Telescope: Description and First Results
Abstract
The description is given for the speckle interferometer of the BTA 6-m telescope of the SAO RAS based on a new detector with an electron multiplication CCD. The main components of the instrument are microscope objectives, interference filters and atmospheric dispersion correction prisms. The PhotonMAX-512B CCD camera using a back-illuminated CCD97 allows up to 20 speckle images (with 512512 pix resolution) per second storage on the hard drive. Due to high quantum efficiency (93% in the maximum at 550 nm), and high transmission of its optical elements, the new camera can be used for diffraction-limited (0.02′′) image reconstruction of stars under good seeing conditions. The main advantages of the new system over the previous generation BTA speckle interferometer are examined.
pacs:
95.55.Aq, 95.55.Br, 95.75.Kk1 INTRODUCTION
Improvement of the angular resolution of ground-based optical telescopes remains one of the most important astronomical problems. The advantages of the largest astronomical instruments cannot be implemented without an introduction of the newest methods of correction of phase degradations, arising during the light propagation through the turbulent atmosphere. This problem obtains a special meaning in connection with the development of the new generation of giant telescopes.
The adaptive optics and speckle interferometry allow approaching the diffraction limit of the telescope’s angular resolution. Image reconstruction in speckle interferometry is achieved by the integration of a series of short-exposure images of the object (exposure time is 5–40 ms) with the subsequent calculation of the ensemble-averaged power spectrum of the object Labeyrie1970:Maximov_n , and its phase defined from the bispectrum Lohmann1983:Maximov_n . In contrast to the adaptive optics, which is effective today mainly in the infrared, speckle interferometry can be used for observations in visible and near UV bands. In addition, speckle interferometry is realizable under poor atmospheric conditions, while the adaptive optics always needs the best seeing. Another important fact is the value of speckle interferometric equipment, which is significantly lower than the expenses for the development of adaptive optics for a large telescope.
5mm
\onelinecaptionstrue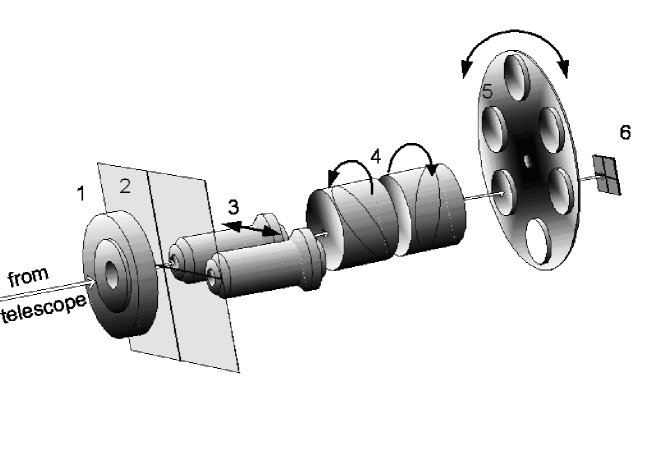 \captionstylenormal
The speckle interferometry technique has been significantly upgraded throughout its 35 years long history. First detectors based on image intensifiers and film cameras Bonneau1973:Maximov_n were replaced by the television photon counting systems Labeyrie1977:Maximov_n . In the 1990s, television tubes were driven out by fast CCDs Blazit1985:Maximov_n ; Balega2002:Maximov_n , however, different types of image intensifiers were still used as brightness amplifiers. Lately, these systems were replaced by new EMCCDs with electron charge multiplication. They have certain advantages for application in the optical speckle interferometry: photon counting sensitivity allied with the maximum quantum efficiency, fast image readout, and high geometric and photometric stability.
In the present paper we give the description of the EMCCD-based speckle interferometer (SI), which is in active use in the observations conducted at the BTA 6-m telescope of the Special Astrophysical Observatory of the Russian Academy of Sciences (the SAO RAS) since 2007. The main characteristics of the optical components of the instrument are given in Chapter 2. Then, Chapter 3 describes the EMCCD detector. The control system is briefly presented in Chapter 4. In conclusion, capabilities of the new instrument, estimated from the observations of binary stars, are laid out in Chapter 5. The algorithms and software for image reconstruction from the series of short-exposure speckle interferograms will be described in a separate paper.
2 MAIN OPTICAL COMPONENTS
The main optical elements of the SI optical-mechanical unit are (Fig. 1): the electro-mechanical shutter with the 6 mm aperture to block the light beam from the telescope (1), microscope objectives for the image magnification (3), the set of prisms for atmospheric dispersion compensation (4), a the set of interference filters for the narrow spectral band selection (5). The :4 beam from the telescope’s primary mirror forms an image in the focal plane (2), and then it is recorded by the EMCCD detector after the passage through all optical elements (6). Let us consider the main components of the SI in details.
2.1 Microscope Objectives
The SI microscope objectives are designed for matching the image scale in the prime focus of the BTA with the detector’s pixel size. The size of a single speckle in a speckle interferogram, corresponding to the diameter of the first dark ring in the Airy disk at the wavelength , is equal to , where is the aperture diameter. In the BTA focal plane, for =550 nm =2 m. The detector pixel size is 16 m, therefore, following the Kotelnikov’s theorem (, where is the maximum frequency in the signal spectra), an image magnification of approximately 20 times must be applied to reconstruct the speckle profile.
5mm
\onelinecaptionstrue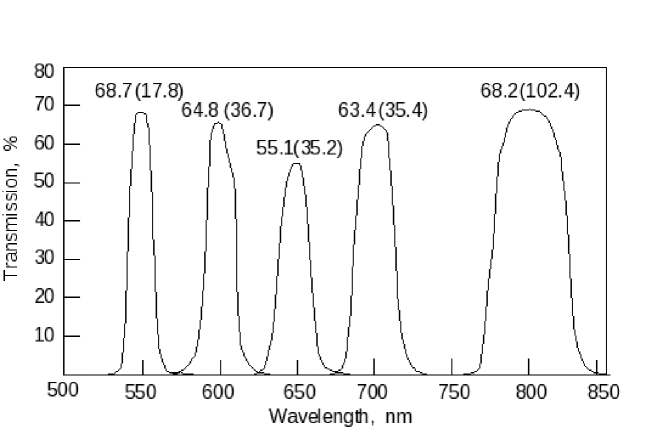 \captionstylenormal
We use two high-quality Carl Zeiss objectives with the corrected field curvature to match the scales: a 2.5-fold achromat with the numerical aperture 0.08 and a 16-fold plan-achromat with the numerical aperture 0.35. They both have a back working distance of 160 mm and form a magnified, inversed and free from aberrations image of the star at the CCD. With the BTA main mirror curvature radius of =4805115 mm (floor measurement by L.I. Snezhko using the Hartmann method), the microscope objectives provide scales of 3.44′′/mm and 0.54′′/mm on the detector. For the 512512 pixel detector with the size of the sensitive area 8.198.19 mm, the corresponding scales are 0.0550′′/pix and 0.0087′′/pix, giving the fields of view of 28.2′′ and 4.4′′. The 16-fold objective is the main working objective of the SI, while the small magnification is used only for pointing on the object and tying-in the position angles of the system.
For some purposes that require obtaining a detailed profile of the Airy disk, one might need to use higher optical magnifications. One of the examples is the image reconstruction of visible disks of cool supergiant stars. For such cases, we anticipated an installation of a 32-fold microscope objective with a corresponding reduction of the field of view.
Small convergence of the beam after the 16-fold objective (1:64) permits fitting other optical elements (prisms, filters) on the axis between the objective and the detector, without resorting to additional transfer optics.
2.2 Interference Filters
To keep the coherence during the interferometric picture recording, the width of the filter transmission band is selected following the relation
| (1) |
where is the center wavelength of the filter transmission band, is the atmospheric coherence radius (Fried parameter) Fried1965:Maximov_n , or
| (2) |
where is the mean-square aberration of the incoming wavefront phase given in radians.
Under the seeing of approximately 1′′, (20 cm), the filter limitations for the BTA applications are chosen by the ratio 1/30. For poor atmospheric conditions the filter passband must be reduced. However, in most of the cases the filter transmission band can be doubled without significant dissipation of the high-resolution data. This simplification leads to a larger detected flux. In the near infrared, the filters with a band width of 100 nm can be used. Narrower filters can be installed in the beam to cut out the selected bands in the spectrum of an object. One of the examples of such tasks is the Mira stars image reconstruction in the TiO absorption bands and in the nearby continuum.
5mm
\onelinecaptionstrue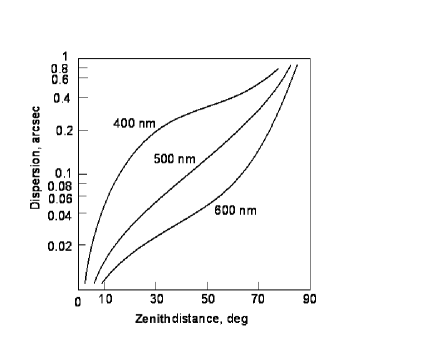 \captionstylenormal
Five interference filters, manufactured by Andover (USA), are arranged on the turret assembly, and are being brought in the beam by the rotating mechanism. All the filters have the diameter of 25 mm (the light diameter is 21.2 mm) and thickness of 6 mm. The parameters of the filters are given in Fig. 2. The thickness of the filter dielectric layers is constant (0.25%) throughout the surface in order to ensure the design performance. During the detector calibration procedures or the system testing in the white light, no filter is needed in the optical path. For these purposes the filter wheel has one additional hole.
2.3 Atmospheric Dispersion Correction
The atmospheric dispersion has an effect on the resolution in speckle interferometry even while applying narrow interference bands. The dispersion value can be estimated from the empirical formula proposed by Lambert as far back as in 1759:
| (3) |
where is the refraction index of the atmosphere, is the zenith distance of the object.
The Owens empirical expression Owens1967:Maximov_n is most frequently used to describe the wavelength dependence of the refraction index
| (4) | |||
where and are the factors accounting for the density of the dry air and water vapors, respectively. The value of can be estimated with an accuracy of 10-7–10-8 from formula (2.2.3). Fig. 3 shows the dependence of zenith distance from the refraction index in three wavelengths for the BTA site (pressure 720 mbar, temperature 0∘C, relative humidity 30%) as follows from expressions (3) and (2.2.3).
For example, an image of a point source at =30∘ and =500 nm will be shifted by 0.05′′ from its true position. The vertical extension of speckles in the region =500 nm through the =20 nm filter will be around 0.02′′, which is comparable with the size of the diffraction spot.
The simplest way to compensate the atmospheric chromatism is the use of a direct-vision prism with the dispersion vector opposite to the atmospheric dispersion. The angular dispersion of the prism must change with the zenith angle. One should keep in mind that in the SI we use the 16-fold magnification, therefore the prism corrector, which is installed behind the microscope objective, must provide a proportionally higher dispersion.
Beam deviation in the prism with the index of refraction and the apex angle is equal to
| (5) |
For a prism consisting of a pair of wedges with the angles and and the indices of refraction and , the refracting angle is
| (6) |
The wedge angles ratio is obtained by specifying the zero deviation at =550 nm:
| (7) |
To compensate the atmospheric dispersion at the maximum zenith angle =60∘ in the 20 nm band at =550 nm, the following equation should be valid:
| (8) |
leading to the apex angle of the first wedge:
| (9) |
5mm
\onelinecaptionstrue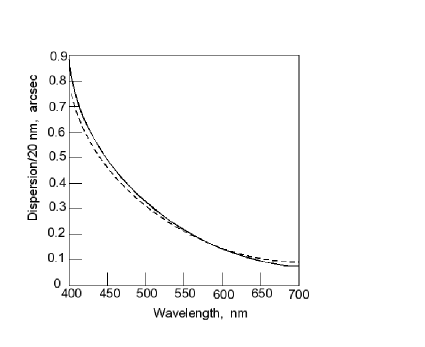 \captionstylenormal
where means the variation range of and in the wavelength range from nm to nm. To correct the atmospheric chromatism at smaller , the compensating prism should provide lower dispersion.
In our observations until September 2007, a direct-vision Amici prism from a pair of wedges has been used for dispersion compensation. The dispersion value has been changed by translation of the prism along the axis: the lowest value was obtained in the immediate proximity of the detector; the highest dispersion was reached at the remote position. The advantage of such construction consists in its low light losses in the glass and on the surfaces. The disadvantage of the assembly is its remaining dispersion in the circumzenithal zone. This dispersion cannot be eliminated as the prism cannot be installed closer than some minimum distance from the image acquisition plane.
The dispersion curve for the prism compared to the atmospheric dispersion is shown in Fig. 4. It can be seen that by the selection of the wedge angles and refractive indices, it is possible to match the dispersion variation of the prism and atmosphere in the range of 550–700 nm.
The new compensator was built on the base of a direct-vision Risley prism consisting of a pair of identical prisms rotating around the instrument axis in opposite directions (see Fig. 1). The compensator gives a dispersion of , where is the dispersion of a single prism, is the rotation angle of the prisms. Each prism in the assembly is a glued pair of wedges (crown + flint) with carefully selected indices of refraction, providing a dispersion of 330′′/20 nm at the direct-vision wavelength of 550 nm. Shorter and longer wavelengths deviate symmetrically in opposite directions from the 550 nm beam. The net deviation of the beam is the vector sum of the two separate deviation vectors. If the prisms are rotated by 90∘, they combine to act as a parallel plate with no net angular deviation. To simplify the construction, the rotation mechanism of the prisms is made dependent, providing the rotation of the prisms by equal angles about the optical axis. The rotation angle of the prisms is defined by the computer when the object is chosen and its zenith distance is calculated. The calibration of the relationship is made using the observations of bright stars at different during the nights of good seeing.
Due to different distances of the prisms from the detector plane (the front prism is at larger distance and produces larger dispersion), the net deviation of the assembly is shifted from the vertical. The value of this shift is zenith angle dependent. The remaining residual dispersion can be easily compensated via rotating the prism mounting by a small angle (about 10∘) in the opposite to the differential dispersion direction.
The Risley compensator, consisting of a pair of rotatable wedged elements, provides the correction of the atmospheric chromatism of speckle interferograms in the range of zenith distances from 0∘ to 60∘. The prisms were manufactured by B.Halle Nachfolger GmbH, Germany, from the SF L6 crown glass and heavy flint glass LaSF N30. The apex angles of the wedges made of crown glass and heavy flint glass are =41.6∘ and =41.9∘, respectively. The prisms have a 5-layer antireflection coating for the range of 450–1100 nm.
3 DETECTOR
3.1 General Characteristics
The PhotonMAX-512B camera developed by Princeton Instruments, USA, on the base of electron multiplication CCD97 (EMCCD) is used as the detector in the SI. The back-illuminated CCD has 1616 m pixels in a 512512 frame transfer format with the total photosensitive area of 8.198.19 mm. The quantum efficiency of the CCD is QE=93% at 550 nm. The quantum efficiency curve at different wavelengths is shown in Fig. 5.
5mm
\onelinecaptionstrue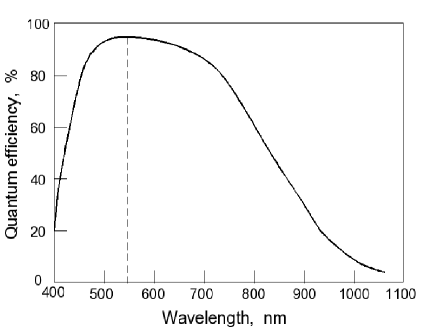 \captionstylenormal
The EMCCD has two independent readout registers on the output. The first one is used for standard, high dynamic range application as in traditional CCDs, the second one is devoted for high-speed, low light level multiplication gain mode. In the normal readout application (no multiplication), the readout mean-square noise is 45 and 60 at operating readout frequencies 5 and 10 MHz, respectively. Under maximum multiplication of the charge generated in the pixels, the readout noise falls below 1 . The PhotonMAX can offer a multiplication gain factor between and . The typical relationship between the 12-bit setting of the DAC (digital-to-analog converter), which defines the voltage applied to multiplication register clocks, and the charge multiplication factor is close to exponential (see Fig. 6). The maximum multiplication is achieved under the voltage of about 43 V on the extended multiplication register. Further register voltage gain can destroy the CCD. Most of the time we use the PhotonMAX-512B camera in the high-multiplication mode, and the normal mode (no gain) with low multiplication is used only during the speckle observations of bright stars.
To reduce the dark current, the EMCCD is cooled by a 4-stage thermoelectric Peltier cooler. It is stabilized to within 0.05 ∘C by a feedback control system. The lowest achievable temperature of the CCD is –70∘C providing the dark current below 0.01 /s per pixel.
The CCD is mounted on the cold finger in the vacuum module. The photosensitive area of the CCD is protected by a single optical entrance window, which provides low light losses. The heat produced by the Peltier device is removed from the camera by an inbuilt fan. The fan is designed for low vibration and does not adversely affect the image.
The camera can be used in the frame transfer mode in the wide range of exposures between 10 s to 10 min. Maximum readout rate of the camera in the full-frame mode is 29 frames per second (fps). As the PhotonMAX camera uses a frame-transfer CCD, it does not incorporate any electro-mechanical shutters that set the exposure time. The exposure time is set electronically by the software. The external shutter 1 (see Fig. 1) is used solely to block the incoming light in the SI.
3.2 Time Stability
Basic properties of the PhotonMAX camera were studied at the laboratory and on the telescope. The study included measurements of the wavelength dependence of the quantum efficiency of the SI, an analysis of the system’s stability, its frame rate in different acquisition modes, the signal homogeneity over the field, and the flat field response of the system.
5mm
\onelinecaptionstrue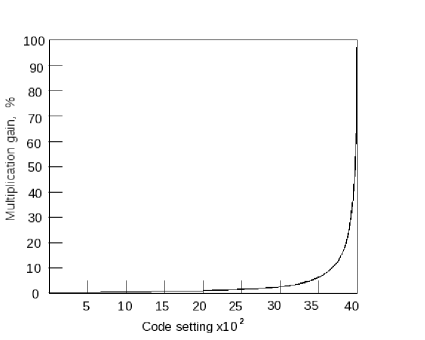 \captionstylenormal
Speckle interferometry operates with series of a few thousand short-exposure images of an object. The total integration time of the series is less than a few minutes as the optical transfer function of the atmosphere is not stable for longer periods. To check the time stability of the detector, we have accumulated a few sets of 1000 uniform (flat) light fields obtained at 10 MHz operating frequency with an exposure time of 10 ms. In Fig. 7 presents the variations of the summed signal from the CCD. It can be seen that the CCD signal intensity varies exponentially by almost 10% during the acquisition of 1000 frames (54 s). This circumstance must be taken into account for photometric measurements. To stabilize the multiplication level of the CCD before the main exposure, the CCD has to be read for more than 5 min.
5mm
\onelinecaptionstrue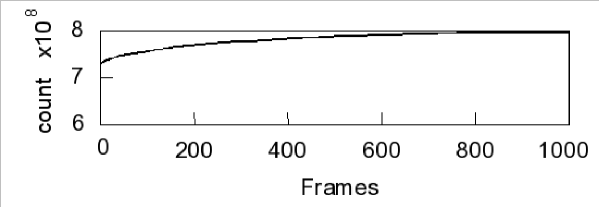 \captionstylenormal
3.3 Readout Speed
Regardless of the exposure time, the highest readout speed of the 512512 pix full format image is 29 fps. Binning (combining pixels into one super pixel) and sub-region selection allow increasing the sensitivity and frame rate of the PhotonMAX-512B. The camera allows the binning of 22, 44 and 66 along either direction of the CCD. The maximum frame rate vs. binning for different readout regions is shown in Fig. 8. The maximum rate of 350 fps is obtained for 66 binning and reading only the 1/64 area of the CCD. However, all types of binning are rarely used in speckle interferometry as it reduces spatial resolution.
5mm
\onelinecaptionstrue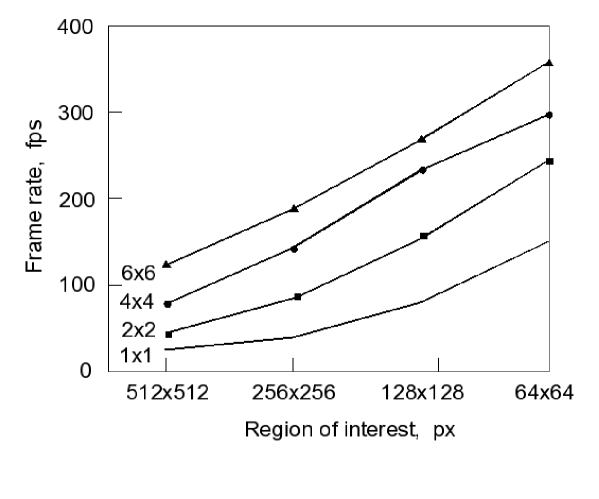 \captionstylenormal
3.4 Flat Field Signal and the Dark-Charge Pattern
Even under uniform incoming illumination (flat field) of the CCD, the obtained image is not perfectly flat. Inhomogeneity of the response is explained by different reasons:
-
-
lack of uniformity of the chip;
-
-
contamination and granularity of the camera’s entrance window;
-
-
imperfections of the CCD readout electronics, which become apparent mostly on the edge zones of the frame.
Flat field problems do not play such an important role in speckle image reduction as compared to the classical long-exposure astronomical imaging due to the fact that interferometry exploits ensemble-averaged power spectra. Nevertheless, the standard reduction procedure in speckle interferometry also implies a flat-field reduction of each speckle interferogram.
We have studied the SI flat field by integration of the twilight sky. One of the examples obtained by averaging of 2000 short exposures is presented in Fig. 9. The field inhomogeneity (signal dispersion) for this image is 0.5%. Summing a larger number of images allows determining the PhotonMAX-512B flat filed with the noise dispersion under 0.05%.
5mm
\onelinecaptionstrue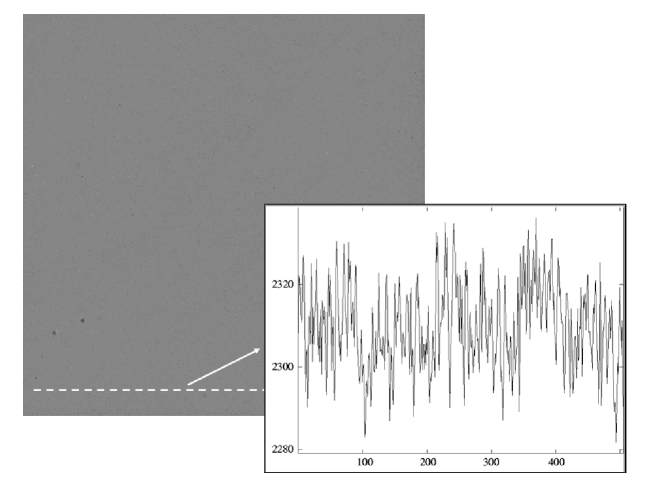 \captionstylenormal
The CCD offset signal measurements with no light coming into the camera (bias) were performed with the closed shutter using 10 s exposures. An average of 500 frames obtained with the highest CCD multiplication is shown in Fig. 10. The general view of the base plate is shown on the left, and its 3-dimensional presentation is on the right. Pixel values of the charge are given in the corners of the bit map. It can be seen that first lines in the frame have significantly higher charges due to the charge inleakage from the chip edges. Maximum difference in the counts is 0.6% from the full range of the analog-to-digital converter scale (65536). The bias pattern is fully subtractable if the dark-charge pattern is acquired under conditions identical to those used to collect the actual speckle images.
5mm
\onelinecaptionstrue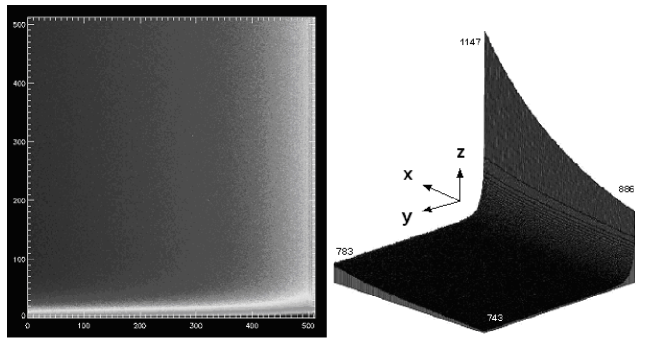 \captionstylenormal
3.5 Single Photon Sensitivity
During the speckle observations of faint stars with the maximum gain, the PhotonMAX-512B acquires images in the photon counting mode. Fig. 11 shows the 20 ms exposure image of LkHA 198 (=14.3m) obtained at the 6-m telescope in the 600/40 nm filter under seeing. The cross-section illustrates intensity maxima corresponding to single photon events. The CCD noise dispersion for this image is 30–40 counts. Individual photons are detected by the PhotonMAX-512B with a signal-to-noise ratio of 10 to 50.
5mm
\onelinecaptionstrue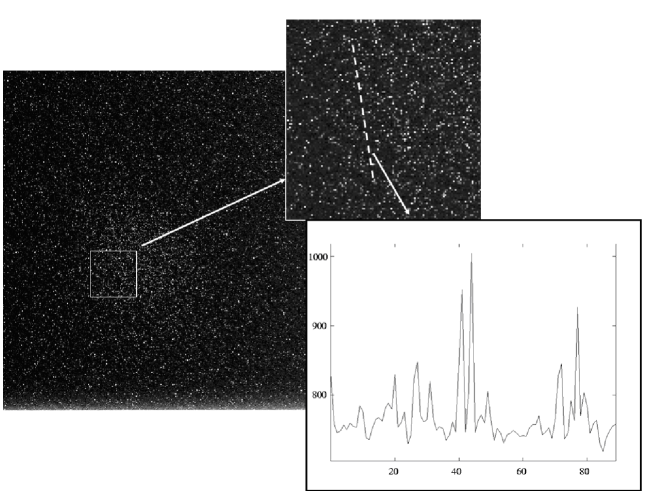 \captionstylenormal
4 CONTROL SYSTEM
The SI control system diagram is given in Fig. 12. Control of optical elements is performed by the stepper motor drive controller TMCM-310 from Trinamic Motion Control GmbH & Co., Germany. It can drive up to three bipolar stepper motors through the TMC246 drivers with a peak coil current of up to 1.5 A. A built-in microprocessor (P) and a nonvolatile 16 KB memory (EEPROM) with the aid of the parameter setting module TMC428 allow flexible adjustment of the drive for selected translation mechanisms. The controller is plugged in the COM-port of the control computer through the standard series RS-232 interface via the 8-channel fiber optic LWL converters.
5mm
\onelinecaptionstrue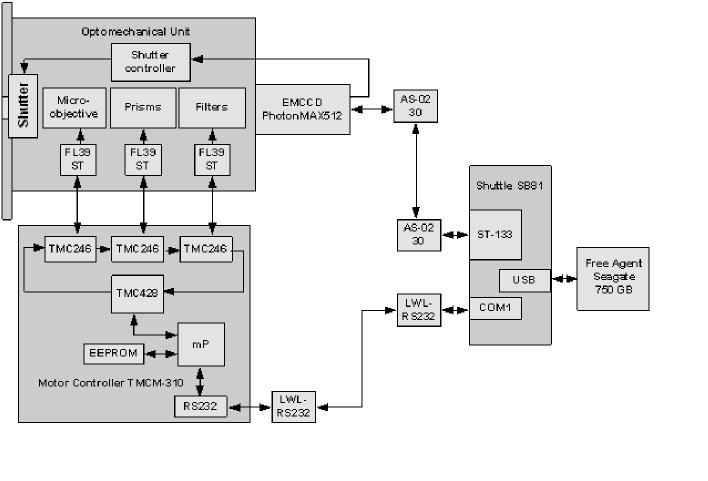 \captionstylenormal
The microscope objectives are translated by the precision linear motorized translation stage ERLIC 85 produced by OWIS GmbH, Germany. The setting accuracy is 2 m for the 50 mm travel.
The filter wheel is fixed on the rotation stage mechanism DMT-65. A filter can be installed in the beam with the positional accuracy of 0.01∘. The atmospheric dispersion compensation prisms are rotated by stepper motors through a differential mechanism. Special guidance provides a practically slip-stick free movement as well as high load capacity for all translation stages.
The camera and other units of the SI are controlled by one computer based on Intel Pentium 4 3.2GHz processor. We use the Shuttle XPC SB81P Barebone system with low electromagnetic radiation. The PhotonMAX-512B camera control is conducted by the ST-133 controller through a PCI-bus via the fiber optic AS-0230 receiver-transmitters. RAM is increased to 2 GB to enable rapid accumulation of up to 1940 speckle images, which are then recorded on the computer hard drives in the binary files of SPE type with a 4100 byte header. The file header contains all the important camera settings that were used during the accumulation of the speckle images. The accumulation of the data can be performed on the high-capacity external hard drives via a USB-interface.
5mm
\onelinecaptionstrue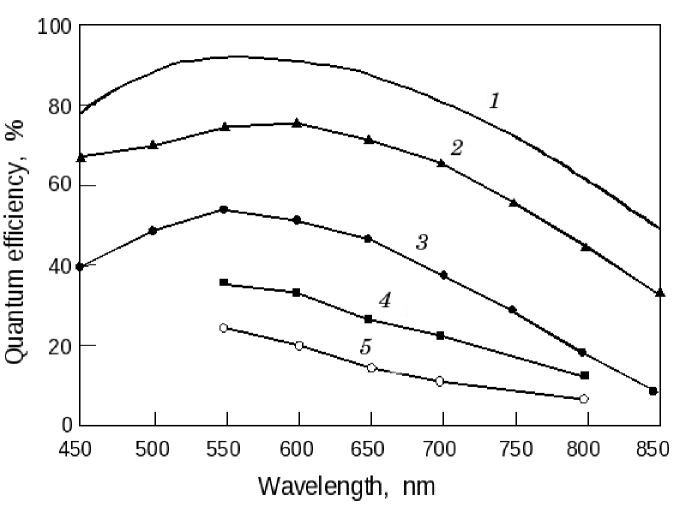 \captionstylenormal
During the observations we often need to monitor the accumulation of power spectrum of the object in the real time mode. The information on duplicity (multiplicity) of the object at the initial stage allows assessing the appropriateness of further acquisition. To solve this problem we are currently implementing reconfigurable multiprocessor computing systems into the process of observations and data reduction. Unlike systems based on rigid architecture, reconfigurable systems allow on-the-fly changes of the calculation parameters. As a result, users may fit the system’s architecture to the structure of a given task.
5mm
\onelinecaptionstrue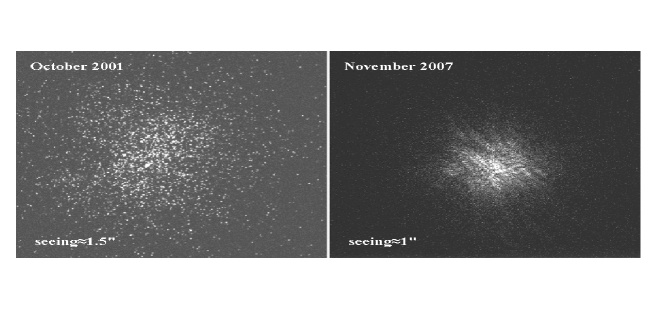 \captionstylenormal
5mm
\onelinecaptionstrue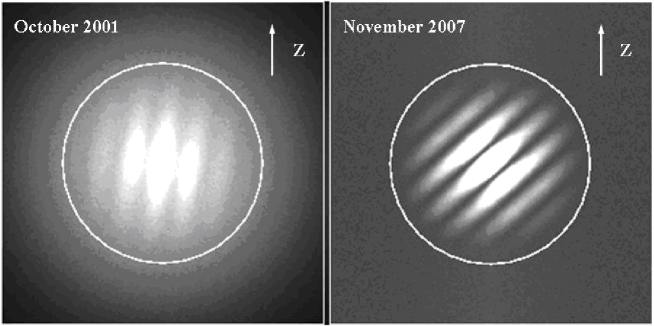 \captionstylenormal
To calculate the power spectrum in real time mode, a unit based on a reconfigurable accelerator of personal computers (RAPC-25) with 25 gigaflops processing power Kalyaev2008:Maximov_n was designed in the Research Institute of Multiprocessor Computing Systems, Taganrog, Russia. This unit implements parallel algorithms to correct the optical images for atmospheric distortion, allows real-time reduction of speckle interferograms, and on-the-fly calculations of the power spectrum of the observed object’s image. The unit is reprogrammable, an option that can be used, e.g., for object phase reconstruction.
5 EFFICIENCY OF THE SYSTEM
Quantum efficiency of the SI was measured in 9 wavelengths using the MDR-41 grating monochromator, and the OL 730D programmable DSP-radiometer, which is sensitive in the range of 200–1000 nm. Fig. 13 shows the system’s efficiency curves vs. wavelength, adjusted for losses at the optical components: the upper curve (1) gives the QE of the CCD97 chip, the lowest curve (5) presents the total QE of the SI. Note that the CCD itself has a 20% efficiency at =950 nm.
We compared the PhotonMAX-512B camera performance with the previous detector, which has been used for speckle observations until 2007. This camera was built on the base of a 3-stage electrostatic-focusing image intensifier AEG1510 (Siemens, Germany) optically coupled to the fast CCD camera SensiCam 370LL, manufactured by the PCO Computer Optics, Germany.
Individual speckle interferograms of the binary star DF Tau (=12m) obtained with the 6-m telescope in October 2001 (intensifier–SensiCam) and November 2007 (PhotonMAX-512B) are shown in Fig. 14. Both observations were performed under 1′′–1.5′′ seeing in the =800/100 nm filter. In 2001, a scale of 0.004′′/pix was provided by the 32 microscope objective, while in 2007 a scale of 0.0087′′/pix was provided by the 16 image magnification. The difference between the two images is evident. Photon noise is dominating at the intensifier–SensiCam speckle image. To reconstruct an image of the binary from such data, it is necessary to process up to 104 individual speckle interferograms. On the other side, the speckle structure is clearly seen on the PhotonMAX-512B image; in this case a diffraction-limited reconstruction of the DF Tau image can be obtained from several tens of frames.
In speckle interferometry, the power spectrum of the star’s image is recovered from a series of short-exposure speckle interferograms using the Labeyrie’s method Labeyrie1970:Maximov_n . For binary and multiple star speckle interferometry at the BTA telescope we use the procedures described in Balega2002:Maximov_n ; Maximov2003:Maximov_n . Fig. 15 represents power spectra for DF Tau averaged from 2000 speckle images, recorded by the intensifier-SensiCam (left) and PhotonMAX-512B (right) cameras. The diffraction cutoff frequency of the aperture in the used filter is marked by circles. The period of fringes in the power spectrum corresponds to the angular separation between the components of the binary (about 0.1′′). Orientation of the fringes determines the relative position angle of the binary components; the magnitude difference between the two stars can be found from the fringe contrast.
The drop of intensity with increasing spatial frequency on the left image is caused by an additional photon noise spectrum, resulting in a frequency-dependent bias in the fringe contrast. Correcting this bias poses a separate intricate problem, being an obstacle for differential photometry of the components of faint sources. In the power spectra accumulated on the EMCCD data, the influence of photon noise leads to a common change in the level of background, which is easy to define. High contrast fringes are indicative of the power spectrum of DF Tau, obtained in 2007 with the new system. These fringes can be traced up to the cutoff frequency, determined by the diffraction at the telescope aperture.
6 CONCLUSIONS
In conclusion, we shall list the main advantages of our new system based on the EMCCD, as compared to the previous generation BTA speckle interferometer based on an image intensifier optically coupled to a CCD camera:
-
-
reduction of the total object exposure time thanks to the 4-fold performance advantage of the EMCCD;
-
-
improvement of limiting magnitude up to 15m owing to the 10-fold quantum efficiency advantage of EMCCD over the image intensifier photocathode;
-
-
amelioration of image reconstruction accuracy thanks to the absence of photon bias, which is the main problem of image intensifiers application;
-
-
increase of the maximal achievable magnitude difference in binary star observations up to 5m owing to the high dynamic range, and high signal-to-noise ratio in the reconstructed image;
-
-
geometrical stability of the EMCCD-based detector and lack of distortions inherent to image intensifiers;
-
-
broadening of the speckle interferometer’s working field up to 4′′ owing to the smaller optical magnification provided by the small EMCCD pixel size (16 m).
Acknowledgements.
The authors are grateful to the professor of the Max Planck Institute for Radio Astronomy in Bonn G. Weigelt for his support in procurance of some optical components of the speckle interferometer. We would like to thank the head of the laboratory of Advanced Design of the SAO RAS S. V. Markelov and the leading engineer of the same laboratory V.A. Murzin for useful discussions and for their help in calibration measurements. We thank the software engineers of the Information Technology Department E.I. Kaisina and S.L. Komarinskii for their help in software debugging. The work was supported by the program of the Presidium of the RAS ‘‘The Origin, Structure and Evolution of the Universe’’, and the fundamental research program of the Division of Physical Sciences of the RAS ‘‘Extended Objects in the Universe’’. The work was as well partially supported by the grant of the Russian Foundation of Basic Research (project no. 07-02-01489-a).References
- (1) A. Labeyrie, Astronom. and Astrophys. 6, 85 (1970).
- (2) A.W. Lohmann, G. Weigelt, and B. Wirnitzer, Applied Optics 22, 4028 (1983).
- (3) D. Bonneau and A. Labeyrie, Astrophys. J. 181, L1 (1973).
- (4) A. Labeyrie, L. Koechlin, D. Bonneau, et al., Astrophys. J. 218, L75 (1977).
- (5) A. Blazit, in ESA Colloquium on Kilometric Optical Arrays in Space (Saint Vallier de Thiey, France, 1985), p. 155.
- (6) I.I. Balega, Y.Y. Balega, K.-H. Hofmann, et al., Astronom. and Astrophys. 385, 87 (2002).
- (7) P.L. Fried, Journal of the Optical Society of America 55, 1427 (1965).
- (8) J.C. Owens, Applied Optics 6, 51 (1967).
- (9) I.A. Kalyaev, I.I. Levin, E.A. Semernikov et al., Reconfigurable Multipipelined Computational Structures (SFU RAS Publishing, Rostov-on-Don, 2008) [in Russian].
- (10) A. F. Maximov, Y. Y. Balega, U. Beckmann, et al., Bull. Spec. Astrophys. Obs. 56, 102 (2003).