Evolving Starburst Modeling of FIR/sub-mm/mm Line Emission. III. Application to Nearby Luminous Infrared Galaxies
Abstract
In a previous work, we showed that the observed FIR/sub-mm/mm line spectra of a starburst galaxy (M 82) can be successfully modeled in terms of the evolutionary scheme of an ensemble of giant molecular clouds (GMCs) and shells, and such studies can usefully constrain the age(s) or star formation history of a starburst galaxy. In this paper we present a preliminary study of using the template of an ensemble of evolving GMCs/shells we developed for M 82. we apply the model to represent various stages of starburst evolution in a well known sample of nearby luminous infrared galaxies (LIRGs). In this way, we attempt to interpret the relationship between the degree of molecular excitation and ratio of far-infrared (FIR) to 12CO (or simply CO) luminosity to possibly reflect different stages of the evolution of star-forming activity within their nuclear regions.
1 Introduction
Star formation is one of the fundamental process that drives the evolution of galaxies. Understanding the interplay between star formation and the surrounding interstellar medium (ISM), as well as being able to parametrize the star formation history, are crucial in understanding the physics of galaxy evolution in the universe. To constrain theories of how the ISM evolves, one needs to investigate both individual galaxies and large statistical samples of data at multiple wavelengths. Especially, with the available data for the dust component, studying the gas in the co-space ISM becomes more interesting and important.
Starburst galaxies (e.g. M 82) have large reservoirs of molecular gas in their centers to fuel generations of star formation (e.g. Walter et al., 2002). Bursts of massive star formation can create a profound impact on the surrounding ISM (both its structure and evolution) in their host galaxies by injecting large amounts of energy and mass into the ISM via strong stellar radiation, repeated supernova explosions, and cosmic rays (Robert, 1998). Hence, the main excitation mechanisms for molecular gas in starburst regions are the combination of collisional processes in dense gas and strong UV radiation field stemming from photoelectric heating, far-UV pumping of H2, strong mechanical energy, enhanced cosmic rays and X-rays, as well as shock-induced and turbulent heating (e.g. Mao et al., 2000; Veilleux et al., 2009, and references therein).
The volume of multi-wavelength observations of starburst galaxies throughout the cosmic-scale has increased dramatically due to the significant improvement in the sensitivity and resolution of available instrumentation. These observations provide an essential basis for starburst modeling; in turn, models provide systematic predictions of the properties of the ISM in starburst galaxies. In two previous papers (Yao et al. 2006, hereafter Paper I; Yao 2009a, hereafter Paper II), we presented a unique set of starburst models that allow us for the first time to relate observed molecular line properties of a starburst region to its age and provided better interpretations for the observations. Few previous models for neutral gas media, if any, have all physical elements included at the same time to search for the time signal in the CO spectral energy distribution. In our model, the molecular gas responding to star formation in a starburst galaxy is treated as an ensemble of GMCs with different initial masses, each of which responds to massive star formation at its center. The four physical elements incorporated in our model are i) a standard similarity solution for the bubble/shell structure around a super star cluster (SSC), ii) a time-dependent stellar population synthesis method, iii) a fully time-dependent chemistry problem for the PDRs, and iv) a non-LTE radiative transfer method for molecular and atomic lines. Detailed discussion of each of these elements and the importance in evaluating the physical and chemical properties of molecular gas in a starburst galaxy, are presented in the Ph.D. thesis of Yao (2009b, and references therein, hereafter Yao Thesis111The thesis is available from the University of Toronto library website: http://www.astro.utoronto.ca/AALibrary/theses.html).
In Papers I and II, we have successfully demonstrated that the kinematic and far-infrared/sub-millimeter/millimeter (FIR/sub-mm/mm) emission properties of individual expanding shells and star-forming regions in nearby archetype starburst galaxy M 82 can be understood by following the evolution of individual SSC or an ensemble of SSCs surrounded by compressed shells and GMCs (Keto et al., 2005; Melo et al., 2005; Weiss et al., 2005; McCrady & Graham, 2007). We found that the spectral energy distributions (SEDs) of the molecular and atomic line emission from these swept-up shells and the associated parent GMCs contain a signature of the stage of the starburst evolution. We suggested that the physical and chemical properties of molecular and atomic gas and their excitation conditions depend strongly on the stage of starburst evolution in the central kiloparsec region of M 82.
At distances beyond M 82 (3.25 Mpc; Lord et al. 1996), the sub-millimeter common user bolometer array (SCUBA) sources represent an inherently distinct population from low- to high- universe (Holland et al., 1999; Sanders, 1999). Multi-wavelength studies of these galaxies in the local universe, for example, the SCUBA local universe galaxy survey (SLUGS; Dunne et al., 2000; Thomas et al., 2002; Yao et al., 2003), has revealed that the properties of molecular gas and dust in the central starburst regions differ significantly from those of quiescent star forming disks and the center of the Galaxy. The SLUGS dust sub-millimeter survey (Dunne et al., 2000) contains 104 galaxies selected from the Infrared Astronomical Satellite (IRAS) bright galaxy sample, with a flux limit of 5.24 Jy, and FIR luminosities in the range 1010 L⊙ 1012 L⊙, and the SLUGS CO survey (Yao et al., 2003) contains about 60 SLUGS galaxies over a restricted range in RA. It is essentially complete to the same IRAS flux based on the selection criteria of a flux-density and distance limited for the SLUGS sample.
Low-lying CO rotational line transition at millimeter wavelength (CO = 1 - 0) is often used as a tracer of the total molecular hydrogen content in a galaxy (e.g. Mauersberger, 1996; Mauersberger et al., 1999; Yao et al., 2003). But it is not a good tracer of dense or warm gas in star-forming regions. The most common method of deriving H2 masses from 12CO(1-0) luminosities is through the controversial parameter , which converts CO line intensity or luminosity to the H2 column density or mass. Previous studies have shown that this parameter varies from galaxy to galaxy (Booth & Aalto, 1998; Boselli et al., 2002; Zhu et al., 2009), and it is thought to be higher in metal-poor galaxies and lower in starburst galaxies than in Galactic molecular clouds, where is about 2.8 1020 cm-2 [K km s-1]-1 (Bloemen et al., 1986; Strong et al., 1988). Hereafter we refer to this as the standard value. Thus in starburst galaxies, application of the standard factor can produce a significant overestimate (4 - 10 times) of molecular hydrogen mass (Solomon et al., 1997; Downes & Solomon, 1998; Yao et al., 2003). The question we ask is Does the -factor depend on the phase of starburst evolution?.
In § 2 of this paper we present the application of our evolving starburst models to the SLUGS sample, using the template of a shell ensemble we developed for M 82 (Paper II). We examine one interesting and yet puzzling issue in particular - whether the relation between the degree of molecular gas excitation and the star formation properties in these SLUGS objects can be understood in terms of our evolving starburst model as a preliminary study. This issue is a follow-up to an earlier observational paper by Yao et al. (2003) in which a clear connection between these two properties was identified. We also investigate whether the variations in these properties from galaxy to galaxy may derive simply from seeing galaxies in different stages of their post starburst evolution, as seen in our models. Previous interpretation of these effects require that they reflect the diversity in the intrinsic properties of galaxies, with no necessary connection to starburst evolutionary phases. In § 3 of this paper, we present a first attempt to model the time dependence of this well known controversial CO-to-H2 conversion factor in starburst regions.
2 Correlation between CO Excitation and Star Formation Properties
We first compute the relevant star formation related characteristics (e.g. degree of molecular gas excitation, star formation efficiency) as a function of time (i.e. the stage of starburst evolution) for a model shell ensemble, then we compare these predicted characteristics with those observed in a modest sample of nearby luminous IR galaxies. Each galaxy in the sample is presumed to represent a different evolutionary stage of our model starburst. We specifically investigate the ratios of quantities, 12CO(3-2) to (1-0) line intensity ratio (Yao et al., 2003), and the FIR luminosity (10 100 m) to molecular gas mass ratio / (H2), that are used in our analysis. These ratios describe intrinsic properties independent of galaxy size and assumed distance (Yao et al., 2003). The lack of such a correlation may be due to a sample selection effect, since the more distant galaxies may have a larger fraction of highly excited CO molecular gas. In the standard literature, the is used as an indicator of star formation rate (SFR; Kennicutt, 1998a), and the quantity / or / (H2) is taken to be a measure of the star formation efficiency (SFE; Yao et al., 2003), i.e. star formation rate per unit available molecular gas mass. However, in our model this ratio does not simply measure a constant star formation efficiency, but is a parameter which undergoes a dramatic evolution during the tens of millions of years following a starburst event. The FIR luminosity can be readily derived from a dusty starburst model (Efstathiou et al., 2000), but currently our starburst model is not available for computing the continuum emission from the dust media. In this paper, we use the stellar cluster luminosity to represent the , by crudely assuming that all of the UV photons is absorbed by dust enshrouding the star clusters and distributed in the galaxies, processed and re-emitted in the far-infrared. The ratio of 12CO(3-2) to (1-0) line emission is known to provide a more sensitive measure of the gas temperature and density than the ratio of 12CO(2-1) to (1-0) lines (e.g. Mauersberger et al., 1999). The ratio is often used to measure the degree of molecular CO excitation (Sanders et al., 1993; Yao et al., 2003).
An important feature observed in luminous IR galaxies is that the degree of 12CO excitation tends to increase with increasing concentration and efficiency of star formation activity (Yao et al., 2003; Wilson et al., 2008). Here we examine the effects of starburst phase in our model on the excitation ratio by comparing a theoretical plot based on our modeling results with this observed relationship found in Yao et al. (2003). We begin with the explanation of the effect outlined by Yao et al. (2003), and follow this with a different possible origin based on our starburst evolution scenario.
Fig. 1 (see also Fig. 10 of Yao et al. (2003)) shows that there is a significant observed correlation between and /(H2) within the 15″ aperture for the data with /(H2) 200 L⊙/M⊙. The SLUGS sample shown is divided into two ranges by gas mass centered at (H2) = 108 M⊙, and also by dust FIR luminosity centered at = 1010 L⊙ which are indicated by three different symbols in the plot. The segmentation according to gas mass range and dust IR luminosity range shows the relationship between and (H2) and position in the plot. The linear correlation coefficient is 0.74 at a significance level of 1.4 10-7 (i.e. probability that and are related is significant). However, the correlation is diminished at /(H2) 200 L⊙/M⊙, where ranges between 0.5 and 1.72 (Yao et al., 2003). The molecular gas mass in the SLUGS sample is derived from CO luminosities by applying the conversion factor = 2.7 1019 cm-2 [K km s-1]-1 estimated using an large velocity gradient (LVG) analysis (Yao et al., 2003), which is about 4-10 times lower than the conventional value derived from the Galaxy (Kenney & Young, 1989). Hence, the result is (H2) = 1.1 103 /(1+) M⊙, where is the luminosity distance of a galaxy in Mpc, and is the 12CO(1-0) flux in Jy km s-1 measured within a 15′′ beam. According to Yao et al. (2003), both and /(H2) ratios are found to be independent of the galaxy distance (or the projected beam size on galaxy), and in turn the H2 gas mass. There are also no significant correlations found between and star formation rate (or ), dust temperature and mass, the color indices, or the luminosity of the IR or radio continuum. Yao et al. (2003) suggested that the observed correlation between and /(H2) and the lack of correlation of with properties related to total star formation imply a dependence only on localized conditions within the molecular clouds. According to this picture, the dependence of on the /(H2) ratio reflects a higher degree of CO excitation that is associated with a higher spatial concentration and efficiency of star forming activity. Such conditions would arise in an intense starburst where the surface density of such activity is high. The saturation effect (approaching unity) of seen at /(H2) 200 L⊙/M⊙ reflects a limit imposed on this ratio at the highest excitation where the excitation temperatures for 12CO(3-2) and (1-0) (both assumed optically thick) are equivalent.
Starbursts remain a viable explanation for the dominant energy source in luminous infrared galaxies at the local universe. An instantaneous starburst model is therefore assumed here for the studies of the SLUGS galaxies, the same as our previous studies of nearby starburst galaxy M 82 (Paper II). The instantaneous burst scenario may not be physically realistic for SLUGS galaxies, but it is an acceptable representation of the molecular CO line SED if the duration of the star-forming event in their centers is shorter than the starburst age (Paper II). The set of our starburst models is divided into two phases defined in Paper II, the Winds phase comprises younger and denser shells than in the post-SN phase. These two phases are treated independently, and can be viewed as simply alternative scenarios.
As mentioned earlier the /(H2) ratio is traditionally used as an indicator of star formation efficiency. In our model, this ratio and its variation with time are simple and direct consequences of the evolution in stellar luminosity (represented by ) and swept-up gas mass within a single starburst. Fig. 1 also shows the model ratio versus the /(H2) ratio, where the total cluster luminosity is the sum of individual SC stellar luminosities in our model shell ensemble (see Table 1 in Paper II). The has been used in place of the observed FIR luminosity . This assumes that the FIR luminosity produced in a recent starburst is the dominant component of the FIR luminosity. The (H2) for the model is derived from , thus using the same method as employed for the SLUGS sample except with a fixed = 3.25 Mpc used in our M 82 model computations (Paper II). Thus, and (H2) are both functions of time and the size of the shells. The model curve clearly shows a trend similar to that observed ratio increases with increasing /(H2) ratio, and then saturates at high /(H2) ( 200 L⊙/M⊙). The model ratios vary between 0.7 and 1.3 for the Winds phase, and between 0.4 and 2.0 for the post-SN phase. The key point associated with our model results shown in Fig. 1 is that the relationship between and is governed by the age or phase of the starburst. At earlier stages the cluster luminosity is high and the mass of swept-up gas is small. Since the shells are comparatively small and expanding rapidly, they are also more effectively heated and compressed than at later stages. Thus, at earlier phases, both and /(H2) are higher than in the later phases of the expansion. Since the parent GMCs contribute more to the 12CO(1-0) line than the (3-2) line, the ratio is lower for the Winds phase, although the is higher than that from the post-SN phase. An important point associated with this interpretation is that the degree of molecular gas excitation is a consequence of star-forming activity, rather than a reflection of initial conditions prior to the starburst, as often assumed. The physical and chemical properties, as well as the structure of the ISM, which are often traced by different molecular species in a starburst regions, have been modified significantly throughout the evolution of the starburst. Hence, higher degree of molecular gas excitation does not necessary reflect, for example, higher star formation efficiency.
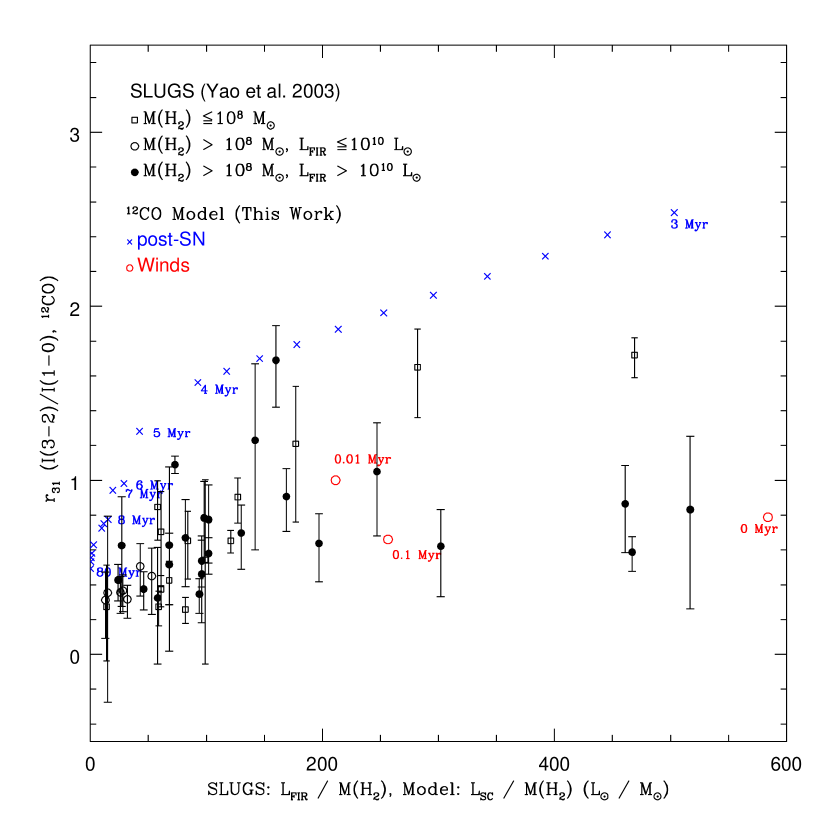
As described above, our model yields a result similar to the observations (i.e. possibly an upper limit of the observed data) and suggests that the observed behavior results from recent starbursts in these infrared luminous galaxies. The ratios predicted by our model are higher than the observed SLUGS data, because (1) we use a smaller region (possibly with more highly excited gas) in the model, (2) the model CO(1-0) line flux may be underestimated due to the limitations of the model (e.g. neglecting the emission from the low-density ambient ISM) discussed in Paper II, and (3) we use the total stellar luminosity for the total FIR luminosity in the model, although the total stellar luminosity derived from our model may be underestimated also discussed in Paper II. This result furthermore implies that the relationship between the degree of CO excitation () and the /(H2) ratio associated with star formation properties may be determined by the phase of the starburst rather than by the more traditional view of variation in the efficiency of star formation.
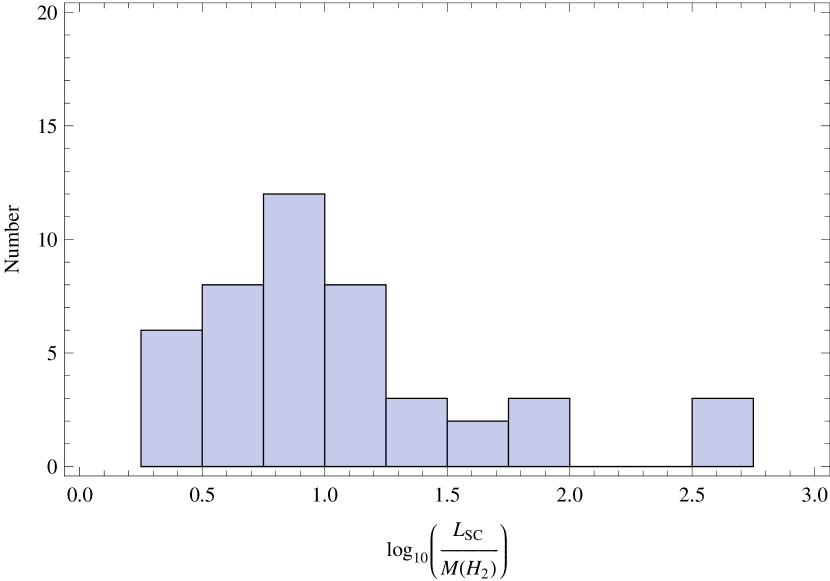
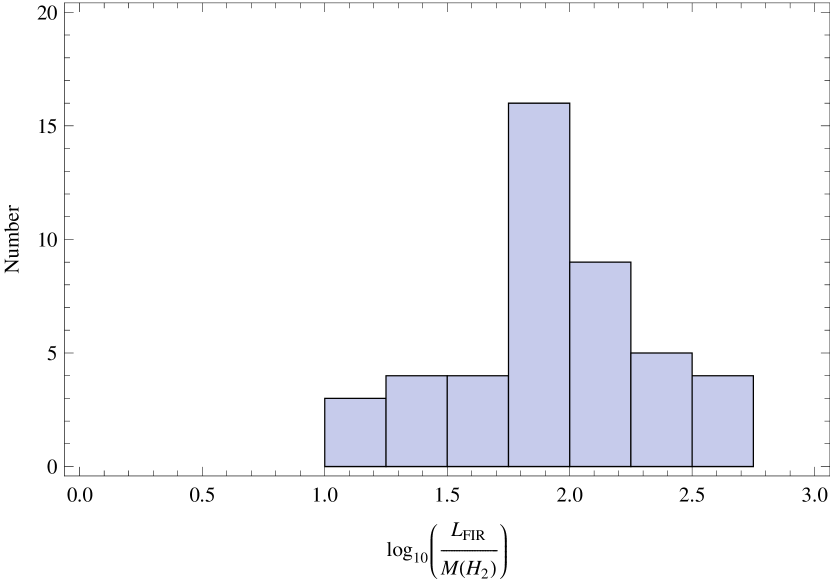
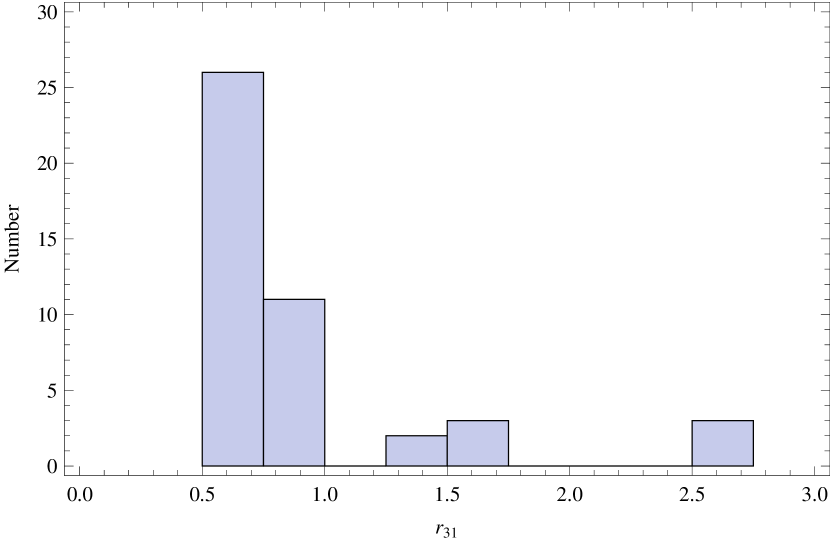
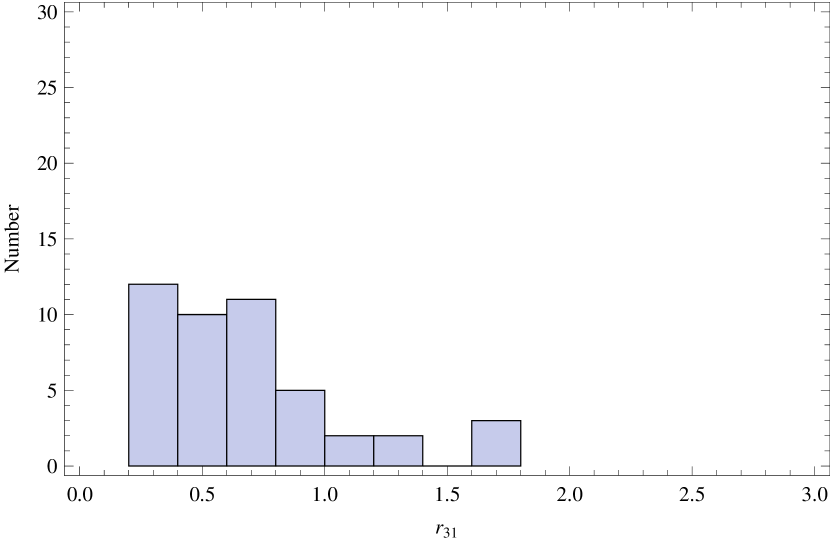
One of the interesting properties of Fig. 1 is that the observed data points tend to concentrate toward the origin. A similar effect is discernible in the theoretical plot if points are plotted at equal intervals in age. The concentration in the latter case occurs because the rate of change of the variables on both axes decreases with time as the age becomes large. This suggests a further test of the hypothesis that the observed behavior in Fig. 1 is the consequence of seeing starbursts in different stages of their evolution. Accordingly, we compare the distribution of the 45 SLUGS galaxies with respect to the observed /(H2) and ratios to that of 45 pseudo galaxies using the model /(H2) and ratios, as shown in Figs. 2 and 3. The starbursts in the pseudo galaxies were assigned ages drawn randomly from a uniform probability distribution between 3 Myr and 20 Myr, and the parameters and /(H2) then computed for these ages using our model. The model age range (3 - 20 Myr) reflects the range of validity of the model for the post-SN phase. The lower boundary corresponds to a plausible lower limit on the dynamical timescale for the starburst region and the upper boundary corresponds to the epoch beyond which the bubble shells escape the disk of the galaxy. The comparison shown in Figs. 3 and 4 reveals a similarity in the distributions between model and observation for both log10 (/(H2)) and , though the peak in the former distribution occurs at a lower value in the model (a point to be discussed further later in this session). The qualitative similarity between the two histograms thus supports the hypothesis that the quantities /(H2) and are related to starburst age. However, the evidence presented is not conclusive, merely suggestive.
We also tested our model result with different starburst age ranges (1 to 10 Myr and 1 to 80 Myr) for the 45 pseudo galaxies. These tests produced numerically different but qualitatively similar results.
As noted, the analysis encapsulated in Fig. 1 signifies that the evolution of gas excitation properties during the cause of a starburst. However, there are a number of considerations which need to be examined which may affect the credibility of this result, e.g., the selection effect on the observed frequency distributions. Fortunately, the SLUGS subsample investigated here is nearly complete with a limiting FIR flux density and a limiting distance, so that the selection effects are well understood. Virtually all members of the sample are detected at both CO transitions, but the flux limit imposes a minimum detectable luminosity which increases with . The dramatic decline in galaxy number density with distance confirms this selection and indicates that the sample comprises the high luminosity tail of the underlying galaxy population. The question then is: could the luminosity selection affect the distribution of /(H2), particularly in producing a deficiency of ratios below the peak of the observed distribution? There are two approaches to investigate this effect. First, we can examine the direct relations between /(H2) and galaxy distance, as well as and galaxy distance (see Figs. 3 and 5 in Yao et al. 2003). We find no significant correlation between these two quantities and distance. Second, we divide the sample of 45 SLUGS galaxies used in our frequency distribution tests (Figs. 3 and 4) into two parts, each with 23 objects, divided at = 45 Mpc. We find no significant difference between the frequency distributions of /(H2) in these two subgroups. Thus, there is no evidence that the selection effect in luminosity produces a corresponding selection in the ratio /(H2). We also conducted a similar analysis for the ratio , and there is also no evidence of selection effect on this ratio.
Other observational effects, such as, the random and systematic errors in the observed data, would contribute to the disagreement between the model and the observed histograms (i.e. Figs. 3 and 4), assuming that the theory were the correct explanation for the observation. It must also be recalled here that there is a deficiency of about an order of magnitude between model and observation in the total stellar luminosity for M 82. This deficiency in the model luminosity will contribute to, and possibly even account for, the systematic difference in location of the peak of the two distributions of /(H2) shown in Fig. 2.
The hypothesis presented here that the ratios and /(H2) are related to the starburst age can be further tested by direct measurements of the ages of the young stellar populations in the SLUGS subsample. Probably the best approach would be the fitting of population synthesis models to optical and IR spectroscopy of SLUGS objects, as discussed in Paper II.
3 The CO-to-H2 Conversion Factor
Our evolving starburst model allows us to investigate, purely from a theoretical standpoint, the relationship between the -factor and starburst phase, because the physical properties of molecular gas in an evolving starburst region changes with time. The -factor may be determined from the following equation (Yao et al., 2003),
| (1) |
where (H2) is the total H2 gas mass swept up by the shells at time in units of M⊙, is the luminosity distance, in this case to M 82 (used in our model computations) in unit of Mpc, is the 12CO(1-0) line flux in units of Jy km s-1, and value is in units of 1019 cm-2 [K km s-1]-1.
In the Winds phase, the value of mainly increases with time. Because the parent GMCs are the dominant sources of 12CO(1-0) line emission during the earlier Winds phase, and because the gas inside the parent clouds is highly excited due to high FUV radiation, this results in a progressive decrease in 12CO(1-0) line emission from the GMCs with decreasing GMC mass. On the other hand, the compressed dense gas inside the shells is also highly excited, but the 12CO(1-0) line emission increases with increasing swept-up mass of the shells. Overall the 12CO(1-0) line emission from the shell and GMC ensemble increases with time, and slightly decreases from 0.5 to 0.7 Myr, while the system H2 mass is fixed at 1.9 107 M⊙. In the post-SN phase, the -factor mainly increases with time, because the 12CO gas is highly excited at early stages of this phase. Although both the 12CO(1-0) line emission and swept-up shell mass (H2) increase with time, the increasing rate in (H2) is higher than that in the 12CO(1-0) luminosity between 5 and 80 Myr. However, the increasing rate in (H2) is lower than that in the 12CO(1-0) luminosity in a brief interval between 2 and 5 Myr, producing a brief decline in the value of shown in Fig. 4. The discontinuity between 0.7 and 1 Myr corresponds to the transition between Winds and post-SN phases.
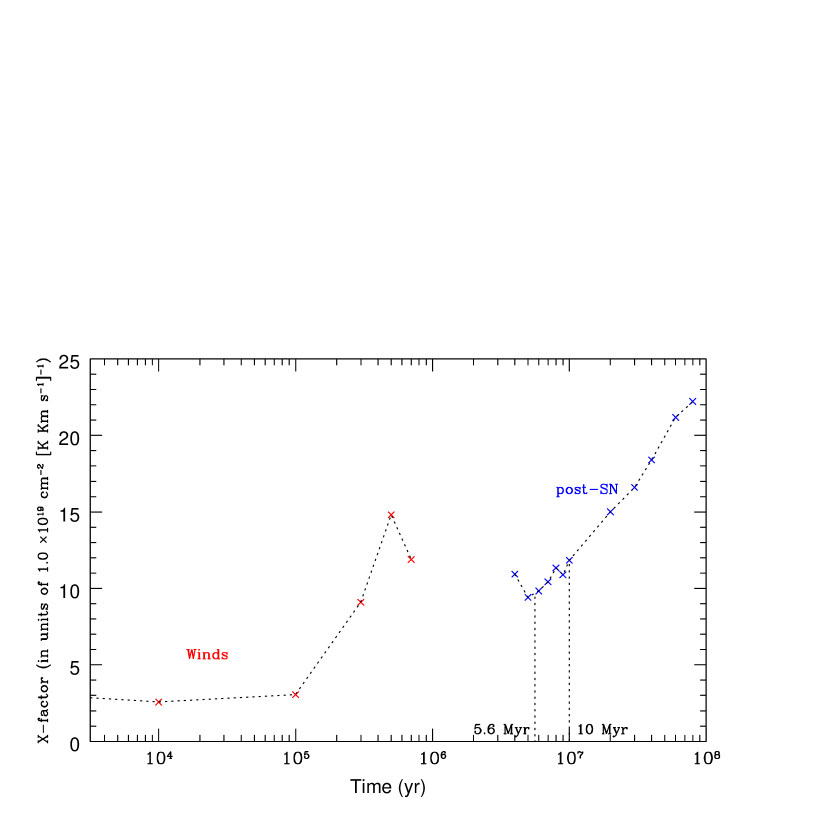
The values for the -factor derived from our models for the two best fit ages (5.6 and 10 Myr) for the central 1 kpc starburst regions of M 82 are 9.5 1019 and 1.1 1020 cm-2 [K km s-1]-1, respectively. These values are comparable to the empirical values found from the studies of starburst galaxies (Weiss et al. 2001, Downes & Solomon 1998). They also lie between those derived for the Galaxy and nearby LIRGs (Yao et al., 2003). Our model -factor shows a trend of increasing with time in the post-SN phase, i.e. lower values are associated with more highly excited gas. This is consistent with the observed results indicated in the above references, since starburst galaxies have lower values than those of the quiescent galaxies like our own Galaxy.
We also investigated the effect of reducing the upper mass limit on the GMC mass spectrum (i.e. from 107 M⊙ to 3 106 M⊙ and 106 M⊙) on our model -factor as was done for the 12CO model (Paper II). In Paper II we concluded that the model can provide acceptable fits to the data only if the dominant initiating starburst clusters are massive, at least 5 105 M⊙. Here we find that the value is also very sensitive to the assumed initial upper mass limit of the cluster spectrum (and corresponding GMC mass spectrum). For the first case with a slightly lower upper limit of GMC mass 3 106 M⊙ (corresponding to stellar mass of 7.5 105 M with SFE = 25%; Paper II), we found a solution similar to the result presented in Fig. 4. The value of is about 15% and less for the Winds phase, but it is about a factor of 1.4 higher at 5.6 Myr and 1.2 higher at 10 Myr for the post-SN phase. But for the second case with a ten times or more reduction in the upper cutoff of the GMC (and cluster) mass spectrum, the value of starts showing an opposite trend of decreasing with time, because in this case the increasing rate in 12CO(1-0) luminosity is faster than the increasing rate in (H2) mass swept up by the shells. The value of is about 45% less for the Winds phase, but it is about a factor of 5 higher at 5.6 Myr and 2.3 higher at 10 Myr for the post-SN phase. Hence, acceptable solutions for modeling the -factor in starburst galaxies are obtained only when our model system is dominated by initiating starburst clusters that are massive, at least 5 105 M⊙ (e.g. McCrady & Graham, 2007; Konstantopoulos et al., 2009).
The accuracy of the -factor predicted by our model is limited by several conditions. The CO flux for a given H2 mass depends upon a variety of factors which were discussed in Paper II (e.g. the dependence on the assumed turbulent velocity, the neglect of the CO emission from the ambient ISM). Equally important however is that the -factor will depend on the assumed mass spectrum for the star clusters (as shown above), and on the assumed relation governing the expansion of the bubble driven shells. The latter relation governs the amount of H2 mass swept up in a given period of time and the hence also the number of star clusters required to produce the total observable H2 mass, as discussed also in Paper II.
It is important to understand that a precise value for the -factor ultimately relies exclusively on the empirical determinations involving careful measurements of CO luminosity and H2 mass. What our results do show, however, is that these empirical values may be reasonably replicated by a starburst model of the type investigated in this study, and that considerable insight regarding the causes of the variation from galaxy to galaxy may be obtained from the temporal behavior in our model exhibited during the expansion of the starburst bubbles/shells.
4 Conclusions
As a preliminary approach, we have shown that:
1. By comparing our starburst model with our published 12CO observations of 45 nearby luminous IR galaxies, it yields some insight into the relevance of starburst evolution in a larger context. Both the model and the data show that the degree of CO excitation increases with the increasing ratio /(H2), and that the frequency distributions of these two parameters in both the model prediction and the data are similar. This suggests that the observed behavior possibly results from recent starbursts in these galaxies observed at different stages of their evolution rather than from a wide range of their intrinsic properties (e.g. greatly varying degrees of star forming efficiency). This result also suggests that the degree of molecular gas excitation is a consequence of star-forming activity, rather than a reflection of initial conditions prior to the starburst, as often assumed. The test of the above hypothesis ultimately lies in determining the ages of starbursts in many other luminous infrared galaxies, most probably by the method of stellar population synthesis.
2. The CO-to-H2 conversion factor may be strongly related to the starburst phase, because the physical properties of molecular gas in an evolving starburst region changes with time as summarized before. The model -factor shows a trend of increasing with time in the post-SN phase, i.e. lower values of are associated with more highly excited gas. This is consistent with the observed results that starburst galaxies have lower values of -factor than those of the non-starburst galaxies. The absolute numerical value for -factor derived from our model is sensitive to the assumed initial upper mass limit of star clusters spectrum and corresponding GMC mass spectrum. In addition, the value will be affected to some degree by those factors that affect the age prediction described in Paper II.
References
- Bloemen et al. (1986) Bloemen, J. B. G. M., et al. 1986, A&A, 154, 25
- Booth & Aalto (1998) Booth, R. S. & Aalto, S. 1998, in The Molecular Astrophysics of Stars and Galaxies, T. W. Hartquist & D. A. Williams (eds.), Oxford Science Publications, 437
- Boselli et al. (2002) Boselli, A., Lequeux, J., & Gavazzi, G. 2002, A&A, 384, 33
- Downes & Solomon (1998) Downes, D. & Solomon, P. M. 1998, ApJ, 507, 615
- Dumke et al. (2001) Dumke, M., Nieten, Ch., Thuma, G., Wielebinski, R., & Walsh, W. 2001, A&A, 373, 853
- Dunne et al. (2000) Dunne, L., Eales, S., et al. 2000, MNRAS, 315, 115D
- Efstathiou et al. (2000) Efstathiou, A., Rowan-Robinson, M., & Siebenmorgen, R. 2000, MNRAS, 313, 734
- Förster-Schreiber et al. (2003) Förster-Schreiber, N. M., Genzel, R., Lutz, D., & Sternberg, A. 2003, ApJ, 599, 193
- Gao & Solomon (2004b) Gao, Y., & Solomon, P. M. 2004, ApJS, 152, 63
- Gao & Solomon (2004a) Gao, Y., & Solomon, P. M. 2004, ApJ, 606, 271
- Holland et al. (1999) Holland, W. S., et al. 1999, MNRAS, 303, 659
- Kenney & Young (1989) Kenney, J. D. P. & Young, J. S. 1989, ApJ, 344, 17
- Kennicutt (1998a) Kennicutt, R. C., Jr. 1998, ARA&A, 36, 189
- Keto et al. (2005) Keto, E., Ho, L. C., Lo, K.-Y. 2005, ApJ, 635, 1062
- Konstantopoulos et al. (2009) Konstantopoulos, I. S., et al. 2009, ApJ, 701, 1015
- Lord et al. (1996) Lord, S. N., et al. 1996, ApJ, 465, 703
- Mao et al. (2000) Mao, R. Q., et al. 2000, A&A, 358, 433
- Mauersberger (1996) Mauersberger, R. 1996, A&A, 305, 421
- Mauersberger et al. (1999) Mauersberger, R., Henkel, C., Walsh, W., & Schulz, A. 1999, A&A, 341, 256
- McCrady & Graham (2007) McCrady, N., & Graham, J. R. 2007, ApJ, 663, 844
- Melo et al. (2005) Melo, V. P., Muñoz-Tuñón, C., Maíz-Apellániz, J., & Tenorio-Tagle, G. 2005, ApJ, 619, 270
- Robert (1998) Robert, C. 1998, ASPC, 147, 210
- Sanders et al. (1993) Sanders, D. B., et al. 1993, in Back to the Galaxy, ed. F. Verter (Dordrecht: Kluwer)
- Sanders (1999) Sanders, D. B. 1999, Ap&SS, 269, 381
- Solomon et al. (1997) Solomon, P. M., Downes, D., Radford, S. J. E., & Barrett, J. W. 1997, ApJ, 478, 144
- Strong et al. (1988) Strong, A. W. et al. 1988, A&A, 207, 1
- Thomas et al. (2002) Thomas, H. C. et al. 2002, MNRAS, 329, 747
- Veilleux et al. (2009) Veilleux, S., Rupke, D. S. N., & Swaters, R. 2009, ApJ, 700, 149
- Walter et al. (2002) Walter, F., Weiss, A., & Scoville, N. 2002, ApJ, 580, 21
- Weiss et al. (2005) Weiss, A., Walter, F., & Scoville, N. Z. 2005, A&A, 438, 533
- Wilson et al. (2008) Wilson, C. D., et al. 2008, ApJS, 178, 189
- Yao et al. (2003) Yao, Lihong, Seaquist, E. R., Kuno, N., & Dunne, L. 2003, ApJ, 588, 771
- Yao et al. (2006) Yao, Lihong, Bell, T., Viti, S., Yates, J. A., & Seaquist, E. R. 2006, ApJ, 636, 881 (Paper I)
- Yao (2009a) Yao, Lihong 2009, ApJ, 705, 766 (Paper II)
- Yao (2009b) Yao, Lihong 2009, Ph.D. Thesis, University of Toronto, Canada (Yao Thesis)
- Zhu et al. (2009) Zhu, M., et al. 2009, ApJ, 706, 941