Radiatively heated, protoplanetary discs with dead zones. I. Dust settling and thermal structure of discs around M stars
Abstract
The irradiation of protoplanetary discs by central stars is the main heating mechanism for discs, resulting in their flared geometric structure. In a series of papers, we investigate the deep links between 2D self-consistent disc structure and planetary migration in irradiated discs, focusing particularly on those around M stars. In this first paper, we analyse the thermal structure of discs that are irradiated by an M star by solving the radiative transfer equation by means of a Monte Carlo code. Our simulations of irradiated hydrostatic discs are realistic and self-consistent in that they include dust settling with multiple grain sizes (N=15), the gravitational force of an embedded planet on the disc, and the presence of a dead zone (a region with very low levels of turbulence) within it. We show that dust settling drives the temperature of the mid-plane from an distribution (well mixed dust models) toward an . The dead zone, meanwhile, leaves a dusty wall at its outer edge because dust settling in this region is enhanced compared to the active turbulent disc at larger disc radii. The disc heating produced by this irradiated wall provides a positive gradient region of the temperature in the dead zone in front of the wall. This is crucially important for slowing planetary migration because Lindblad torques are inversely proportional to the disc temperature. Furthermore, we show that low turbulence of the dead zone is self-consistently induced by dust settling, resulting in the Kelvin-Helmholtz instability (KHI). We show that the strength of turbulence arising from the KHI in the dead zone is .
keywords:
accretion, accretion discs – radiative transfer– turbulence – methods:numerical – planetary systems:protoplanetary discs1 Introduction
The discovery of a gas giant planet with a small orbital radius around 51 Peg (Mayor & Queloz, 1995) motivated the proposal that such planets must form far from their central star, and then migrate (Goldreich & Tremaine, 1979, 1980) inward to their observed orbits. The total number of detected exoplanets has increased to more than 300,111See the website http://exoplanet.eu/ providing abundant supportive evidence for this idea. In addition to Hot Jupiters, massive Earth-like planets (1-10 ) called Super-Earths, have recently been discovered around M stars (Beaulieu et al., 2006). The detected number of such low mass exoplanets has also been increasing. These very different planetary populations both require migration as an explanation of their observed mass - period relation (Udry & Santos, 2007).
It is well established that the thermal structure of protoplanetary discs plays a central role in determining planetary migration. This is because Lindblad resonances which control the strength of the disc-planet interaction are strongly influenced by the thermal gas pressure (Artymowicz, 1993; Ward, 1997). The dominant heat source for discs is stellar irradiation, although viscous heating dominates within the central 1 au for classical T Tauri star (CTTS) systems (Chiang & Goldreich 1997, hereafter CG97; D’Alessio et al. 1998). The irradiation of the disc under the assumption of vertical hydrostatic equilibrium results in a flared disc shape (Kenyon & Hartmann, 1987) that reproduces the observed infrared excess in the spectral energy distributions (SEDs).
Dust in protoplanetary discs is the main absorber of stellar radiation (e.g., Dullemond et al., 2009). An important ingredient in how discs are heated is the grain size distribution. Mathis et al. (1977) found that the size distribution of dust in the interstellar medium (ISM) is well represented by a power-law, the so-called MRN distribution. A related, but somewhat shallower power-law is likely to be applicable to dust in discs (e.g., D’Alessio et al., 2001, hereafter DCH01) due to grain growth, as discussed below. The composition of dust in discs is different from that in the ISM mainly with respect to the contribution of carbon (Draine & Lee, 1984; Pollack et al., 1994, hereafter P94). For discs, carbon is included as organics while they are graphite in the ISM. Recently, polycyclic aromatic hydrocarbons (PAHs) have received a lot of attention, and found that they play an important role in the SEDs (e.g., Draine & Li, 2007) although their formation mechanisms remain to be investigated.
Another important aspect of dust in discs is its time evolution, that is, grain growth and dust settling. The sizes of dust grains grow with time, resulting in ever increasing dust settling (Dubrulle et al. 1995, hereafter DMS95; Schräpler & Henning 2004; Fromang & Papaloizou 2006). More millimeter and less far-infrared emission in the observed SEDs are a good indication of grain growth and the resultant dust settling. The data have been recently confronted by comparisons with theoretical models (Chiang et al., 2001; Dullemond & Dominik, 2004a; D’Alessio et al., 2006). Grain growth and dust settling are robust features of discs around various masses of stars from Herbig Ae/Be (Acke et al., 2004), CTTSs (Furlan et al., 2005) to brown dwarfs (e.g., Apai et al., 2005; Scholz et al., 2007, hereafter S07). Grain growth is also thought to be the trigger of planetary formation in discs (Youdin & Goodman, 2005; Johansen et al., 2007).
The structure of protoplanetary discs is far more interesting than just pure power-law behaviour, however. A robust feature in discs is the presence of regions of very low amplitude turbulent regions, called dead zones (Gammie, 1996). Turbulence is most likely the outcome of the magnetorotational instability (MRI) (Balbus & Hawley, 1991a, b). The MRI requires good coupling between magnetic fields and the weakly conducting ionized molecules produced by the X-rays from the central star and cosmic-rays. The high density mid-plane region within 0.01 - 10 au of a star has difficulty in being ionized, resulting in a dead zone. Extensive studies so far have shown that dead zones are initially extended over roughly 10 au from the central star (Sano et al., 2000; Inutsuka & Sano, 2005; Matsumura & Pudritz, 2003, 2006). They subsequently shrink in time due to viscous evolution (Matsumura et al., 2009).
Dead zones play a significant role in dust settling and the thermal structure of discs. This is because dust settling is determined by the balance between the gravity and turbulence (e.g., DMS95). Dust settling is enhanced in dead zones because turbulence is significantly reduced there. As we show below, this leaves a dusty wall at the boundary between active and dead regions for turbulence. We will show that the direct irradiation of this high scale height of dust in the active region in turn creates a positive gradient of the disc temperature. We also demonstrate that dust settling in the dead zone drives a low level of turbulence by the Kelvin-Helmholtz instability with a turbulent amplitude of .
The presence of planets also distorts the distribution of gas and dust in discs. Jang-Condell & Sasselov (2003, 2004, hereafter JS03, JS04, respectively) investigated the effect of the gravitational force of a planet on the thermal structure of discs by using models of Calvet et al. (1991). They assumed that stellar irradiation and viscous heating were the main heat sources where dust was assumed to be well-mixed with the gas. They found that the gravity of the planet produces a self-shadowing (on dayside of planet) and a resulting illumination region (on nightside of planet) around the planet. This causes temperature variations compared with the unperturbed case. The maximum variation is about 30 per cent for planets which have the threshold masses to open up a gap. Recently, Jang-Condell (2008, hereafter J08) improved the calculations of JS03, JS04 by considering the full 3D discs and including self-consistent treatments for the density and temperature structures, and found that the self-consistency is very important to determine the temperature structure accurately. This is because the temperature is very sensitive to the density distribution of dust.
Thus, the dust distribution is crucial for the thermal structure of discs. A major consequence is its role in controlling planetary migration. Analytical and numerical simulations of this process so far assume discs to have isothermal or a simple power-law temperature profile (Tanaka et al., 2002; Nelson et al., 2000; D’Angelo et al., 2003). More recently, non-isothermal discs have been treated in numerical simulations although they cannot include stellar radiation (D’Angelo et al., 2003; Klahr & Kley, 2006; Paardekooper & Mellema, 2006). Analytically, Menou & Goodman (2004) have taken into account the radiation of stars, and Jang-Condell & Sasselov (2005) have also included viscous heating and the gravity of planets as well as stellar radiation although their disc models assume dust to be well-mixed with the gas, which is still far from realistic disc models. We have recently shown that dust settling has a very important effect on planetary migration in a companion paper (Hasegawa & Pudritz, 2009, submitted).
In this paper, we present detailed radiative transfer calculations of the effects of dust settling and dead zones on the thermal structure of discs. We performed numerical simulations, solving the radiative transfer equation by means of a Monte Carlo method (Dullemond & Dominik, 2004b). We included dust settling with multiple grains sizes, a planet, and a dead zone in our 2D disc models. We especially focus on discs around M stars whose properties are similar to discs observed around brown dwarfs (S07). This is physically interesting because the recent primary target for observations is low mass planets like Super-Earths and the detection probability is the highest around low mass stars and also because viscous heating can be safely ignored. Also, the computational time for the Monte Carlo method increases for massive discs. Low mass discs around M dwarfs are therefore an ideal target. We show that the presence of dead zones can have a very significant impact on the thermal structure of protoplanetary discs.
Our plan of this paper is the following. In 2, we describe our numerical methods, disc models, and dust properties. In 3, we present our results and describe how each of component (dust settling, a planet, and a dead zone) and the combination of them affect the density and thermal structure of discs. In 4, we verify our findings by performing a parameter study for disc properties and discuss other effects on the temperature, such as viscous heating and planetary accretion heating that are ignored in our calculations. In 5, we discuss the Kelvin-Helmholtz instability that can be active in the dead zone. Finally, we present our conclusions in 6.
2 Numerical methods and disc models
2.1 Numerical methods
We performed numerical simulations by using a 2D radiative transfer code, called RADMC222See the website: http://www.mpia-hd.mpg.de/homes/dullemon/radmc/index.html (Dullemond & Dominik, 2004b). RADMC is a versatile and highly reliable code based on the Monte Carlo technique in which the full radiative transfer equation is solved (Pascucci et al., 2004). The basic principle of the Monte Carlo method is very simple, and is well discussed in the literature (e.g., Whitney & Wolff, 2002, references herein). The Monte Carlo method traces photons as they scatter and perform random walks through discs. The implementation of absorption processes is crucial for determining the thermal structure of discs. In this code, an improved version of Bjorkman & Wood (2001) is adopted. Their method assumes discs to be in the local thermodynamic equilibrium, so that photons absorbed by the dust grains are forced to re-emit immediately. Furthermore, the re-emission of photons is adjusted so that they have the corrected temperature distribution. This makes it possible to avoid time-consuming iterative calculations.
RADMC uses spherical coordinate systems in order to increase the efficiency of following random walks of photons (Dullemond & Turolla, 2000). However, cylindrical coordinate systems are generally used in analytical theories of planetary migration (e.g., Ward, 1997). In order to estimate the migration time accurately, we performed a coordinate transformation from spherical to cylindrical ones (see Appendix A). This is non-trivial because the path of photons projected into 2D planes are curved due to this projection effect, and because it depends on projected coordinate systems (van Noort et al., 2002). Our implementation of this coordinate transform was tested against a standard benchmark (Pascucci et al., 2004), and proves successful (Hasegawa, 2008).
2.2 Stellar & disc models
We adopt a disc model that can reproduce the observed SEDs for M stars (S07). These models assume that the density distribution of discs (gas + dust) can be represented by
| (2.1) |
with and (see Table 1 for the meaning of symbols). By adjusting and with the fixed total disc mass and size, they reproduce the SEDs of very low mass stars such as M and brown dwarfs observed by Spitzer. Although they also took into account the effect of dust settling by considering two kind scale heights for two kinds of grain size distributions: one of which has large for a ISM-like grain size distribution (identical to that of gas), the other of which has small for a size distribution extending to larger grain sizes, we use only large since we use much more detailed dust settling models, as discussed below. This large scale height is employed for gas and all sizes of dust when dust is assumed to be well-mixed with the gas, while it is used for gas and only the smallest dust grain when dust settling is included in disc models. For the star, we assume that it is described by blackbody radiation with the characteristic temperature .
Table 1 summarises the stellar and disc parameters we use (S07). Note that we increase the total disc mass by a factor of 10 relative to that of S07 following the literature (Kokubo & Ida, 1998; Alibert et al., 2005). This increment allows discs to form gas giants which have been mainly observed around many intermediate massive stars like our Sun (Udry et al., 2009). We run simulations only of the inner region of the discs, which is typically half the standard size, in order to shorten computational time. This requires the disc mass to be adjusted, so that the surface density is kept 10 times more massive compared with that of S07. We call this configuration our fiducial disc model. In 4, we perform parameter studies showing that our findings are model-independent.
| Symbol | Meaning | Value |
|---|---|---|
| Stellar mass | 0.1 M⊙ | |
| Stellar radius | 0.4R⊙ | |
| Stellar effective temperature | K | |
| Outer disc radius | au | |
| Inner disc radius | ||
| Characteristic disc radius | ||
| Characteristic disc height | 0.02 | |
| The exponent of disc height | 1.1 | |
| The surface density of (gas + dust) | ||
| The total disc mass (gas + dust) | M⊙ | |
| gas-to-dust ratio | 100 | |
| Parameter for turbulence (active/dead) |
M⊙ is solar mass, and R⊙ is solar radius. 1 is increased by a factor of 10 relative to S07.
2.3 Heat sources
We assume the main heat source for discs to be stellar irradiation and neglect any other possible heat sources such as viscous heating.
Viscous heating arises from the accretion processes of discs by stars. The temperature due to viscous heating under the assumption of gray atmosphere is
| (2.2) |
where is the Stefan-Boltzmann constant, is the optical depth of the thermal emission of dust, the viscous flux is
| (2.3) |
and is the accretion rate of discs by the star (Pringle, 1981, also see Table 1). For discs around the CTTSs, viscous heating dominates the heating by the star within about 1 au (e.g., JS04). This is because the temperature due to stellar irradiation is roughly since the inverse square law while the temperature due to viscous heating is about (see equation (2.2) and (2.3)). Thus, the viscous temperature decreases rapidly.
For discs around M stars, however, the turnover point is at a much smaller disc radius than the case of CTTSs because the accretion rate of M stars is a few orders of magnitude smaller than that of CTTSs. We adopt M⊙ yr-1 for M stars (Mohanty et al., 2005). Under the Eddington approximation, or higher corresponds to the optically thick regions. Thus, we consider as the optically thick region although this choice does not change very much since (see equation (2.2)). Our preliminary simulations showed that viscous heating is dominant only within 0.1 au for discs around M stars. Thus, our neglect of viscous heating for low mass systems is valid, especially for M star systems.
2.4 Dust properties
The thermal structure of discs is controlled by two main properties of dust, its composition and
size distribution. For the composition of dust, we adopt the model of P94 in which real and imaginary
refractive indices of dust are derived from available laboratory and astronomical data, theory, and
the chemical composition of the primitive bodies in the solar system.
333See the website : http://www.mpia.de/homes/henning/
Dust_opacities/Opacities/opacities.html
Table 2 summarises the composition, abundance, and density of dust. The opacity of dust is
calculated based on the Mie theory using these refractive indices.
For the composition, we assume that water ice exists over the entire extent of discs. This is because DCH01 found that mass absorption coefficients with and without the water ice are very similar (see their fig. 1), and because JS04 found that the resultant density structures are also similar (see their fig. 3). Thus, our assumption is appropriate. Note that the so-called ice line that defines the region in which water ice can exist is important for planet formation. Ida & Lin (2008) found that planet formation is accelerated at disc radii beyond the ice line, due to the formation of water ice and its retention arising from the pressure maximum (Kretke & Lin, 2007). This retention is likely to arise at the inner edge of the dead zones because the pressure maxima require a positive surface density gradient while we focus on the outer edge of the dead zones in this paper.
For the size distribution of dust, we adopt discretised version of a power-law similar to the MRN distribution (Mathis et al., 1977) because dust settling causes different sizes of dust to have different scale heights. Furthermore, as shown by Wolf (2003), the treatment of a real size distribution is important for calculating the dust temperature accurately compared with the approximate treatment in which the mean opacity for the ensemble size distribution is adopted. In contrast, we adopt the mean opacity for the composition. Thus the size distribution function is generally written as
| (2.4) |
where is a constant independent of grain size , is the Dirac’s delta function, is the grain size we pick up, is the minimum size of dust, and is the maximum size of dust. We set m and m (Chiang et al., 2001). The total dust mass over the size distribution above becomes
| (2.5) |
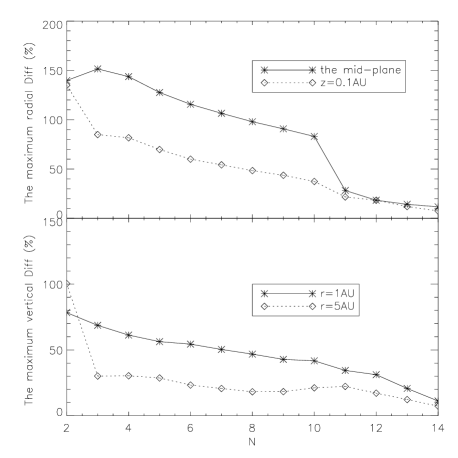
where dust is assumed to be spherical and is the mean density for the ensemble of dust in the composition. In order for to be an increasing function of , we set . This shallower slope does not affect mass absorption coefficients very much and is likely to be preferred in discs in order to take into account grain growth (DCH01). The intermediate sizes of dust are logarithmically assigned between and . Fig. 1 depicts the maximum difference defined as
| (2.6) |
where is the disc temperature, is the fixed position, is the total number of sampled grain sizes. We define the disc temperature as below
| (2.7) |
where is the dust temperature for size . The temperature at is used as the reference value. The top panel shows the radial differences at the mid-plane and au () by the solid and dotted lines, respectively, and the bottom panel shows that the vertical differences at and 5 au () by the solid and dotted lines, respectively. Both panels show the sign of convergence as more sizes of dust are included and that the maximum differences decrease to about or less 10 per cent. Our numerical convergence studies show that 15 sizes of dust are sufficient and we adopt this in all models shown the paper. We emphasise that our calculations using a real size distribution enables one to provide more accurate dust temperatures than using the mean opacity for the ensemble of many dust grains done by S07.
| Composition | Abundance | Density [g cm-3] |
|---|---|---|
| Olivine | 2.6 | 3.49 |
| Orthopyroxene | 0.8 | 3.4 |
| Iron | 0.1 | 7.87 |
| Troilite | 0.8 | 4.83 |
| Organics | 4.1 | 1.5 |
| Water ice | 5.6 | 0.92 |
2.5 Dust settling
The motion of dust is different from that of gas. This is because dust is in Keplerian motion while gas is in slightly sub-Keplerian since it is affected by its thermal pressure. This difference implies collisions or friction between them (Weidenschilling, 1977), resulting in an identical density distribution for them when the friction is efficient. Dust in protoplanetary discs is generally in the so-called Epstein regime wherein , where the friction timescale is
| (2.8) |
is the material bulk density of dust, is the gas density, is the radius of dust grains, and is the sound speed. In this regime, the collisional efficiency () is mainly dependent on . Thus, larger dust grains feel the friction from the gas less than smaller ones, resulting in decoupling from the gas. For laminar flows, the dust subsequently sinks into the mid-plane. Consequently, different sizes of dust have different scale heights, all of which are less than that of gas. This settling motion is prevented in turbulent flows - such as the MRI-active outer regions of discs. Dust settling is diffusive in a turbulent environment. Thus, dust settling is controlled by the balance between the gravitational force of the star and the amplitude of the turbulence in the discs for a given size of dust.
We adopt the analytical model of DMS95 for dust settling in which turbulence in discs is described by -prescription (Shakura & Sunyaev, 1973). Also, its energy spectrum is assumed to be represented by the Kolmogorov type, that is, , where is the wavenumber, and is dependent on the nature of the turbulence. Since generally has the value between 5/3 and 3 (DMS95), we set . This choice is not significant for our results (see equation (2.10)). The reduced scale height of dust due to the dust settling for its size is
| (2.9) |
where
| (2.10) |
and is the scale height of gas. Equation (2.10) was derived from the advection diffusion equation with the diffusion coefficient calculated from the properties of the turbulence, and confirmed by their numerical calculations. This approach has been recently verified by magnetohydrodynamical simulations (Fromang & Papaloizou, 2006).
Thus, the density distribution of the size of dust with settling is described by equation (2.1) with the replacement of with .
2.6 The gravity of planets
The gravitational force of a planet distorts the distribution of gas in the disc (JS03; JS04). This distortion is taken into account by extending the original vertical hydrostatic balance equation to one that includes the gravitational field of the planet as well as the central star. Consequently, the density distribution of gas becomes
| (2.11) |
where , is the planetary mass, is the location of the planet from the host star, and the normalization constant is chosen so that the density at corresponds to the unperturbed density (following JS03). Note that the hydrostatic assumption breaks down within the Hill radius , so that we interpolate the density in this region (Jang-Condell & Sasselov, 2005).
Thus, for a disc model without dust settling, but with a planet, the density distribution of dust for any size is identical to that of gas (equation (2.11)) while the distribution of the size of dust for the case of dust settling is represented by the same equation above with the replacement of with that is calculated by equation (2.9). Note that the density distribution of gas with dust settling as well as a planet is still represented by equation (2.11).
2.7 Dead zones with dust settling
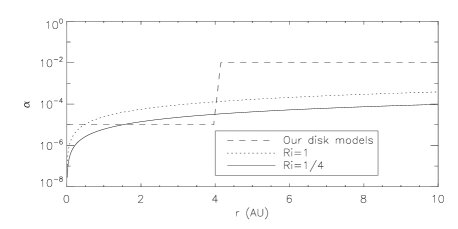
Our disc models include dead zones. In this paper, we assume a characteristic radius for the dead zone to be 4 au in our fiducial disc model. Many studies have shown that it is roughly 10 au in the early phases of disc evolution. Matsumura et al. (2009) have recently shown that dead zones evolve with time. The outer edge of the dead zone moves inward following the accretion of disc material onto the star. In order to take time-evolution into account, we perform parameter studies in 4, confirming the same results. We adopt the -prescription for turbulence, so that whether discs are active or ”dead”, they have a characteristic value of . For dead zones ( au), while for active regions ( au). We show later in the paper that in dead zones is self-consistent.
Dead zones have higher degrees of dust settling than active regions. Since in equation (2.10) takes two different values, depending on either active or dead zones, the density distribution of dust for this case is described by equation (2.1) with the replacement of with and two values of . If a planet is present, it is represented by equation (2.11) with the replacement of with and two values of . The distribution of gas is denoted by equation (2.1) and (2.11) with no and a planet, respectively.
2.8 Self-consistency & the disc temperature
Self-consistency is important for the disc temperature as J08 discussed. In order to achieve it, iterative calculations are essential. Our Monte Carlo calculations are time-consuming. About a week is needed to run a single disc model. This is because the mid-plane region in a disc, which is important for torque calculations, is optically thick so that a large number of photons () is required to avoid the random noise. Therefore, we perform an iteration for each disc model above. The temperature of each size of dust is first calculated for an initial distribution of dust. The distribution of gas is not important for the temperature calculations since its heat capacity is much less than that of dust. Assuming the temperature of gas to be equal to the mass-averaged dust temperature (see equation (2.7)), the new scale height of gas is calculated, allowing us to calculate the new scale height of dust. Consequently, the new density distributions of gas and dust are obtained.
3 Results
3.1 Dust settling
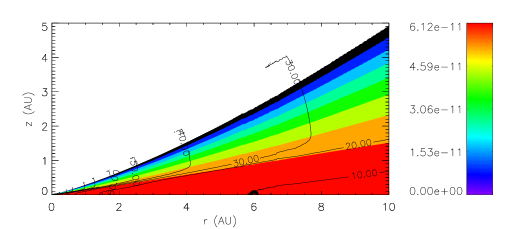
In this subsection, we focus on the effect of dust settling on the density and thermal structures of discs. Fig. 2 shows the results of our simulations of the thermal and density structures of each dust grain without and with of dust settling (the left and right columns, respectively). Grain size increases from 0.01 m, 3.16 m to 1 mm on the top to bottom panels. They show that the temperature of a dust grain decreases as its size grows and that dust settling provides a lower temperature in the mid-plane region. Also, larger grains settle into much flatter layers because of their lower friction with the turbulent gas.
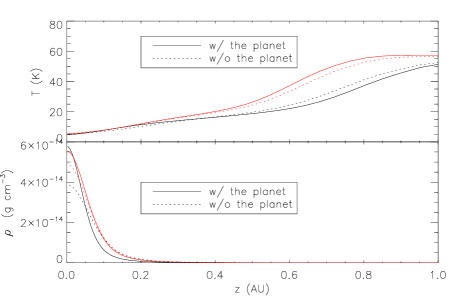
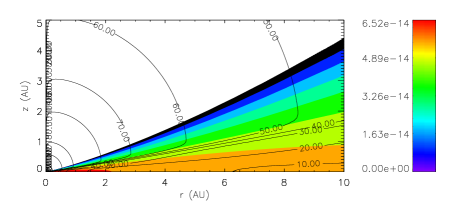
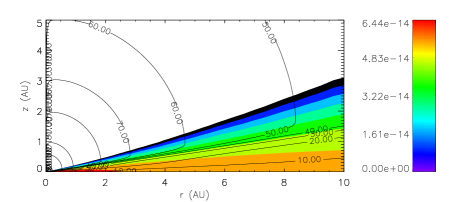
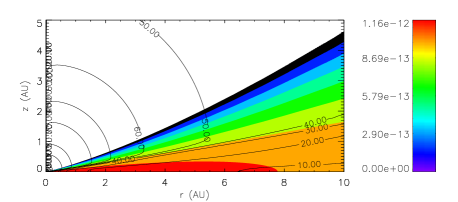
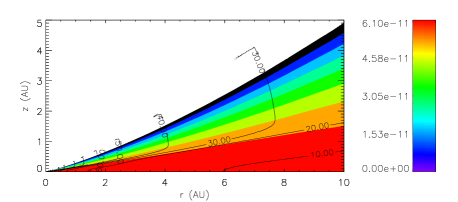
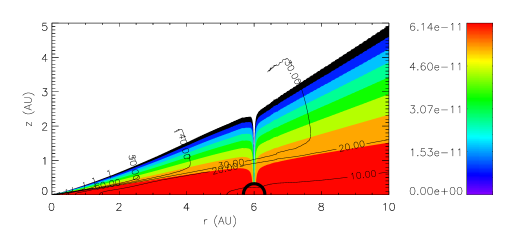
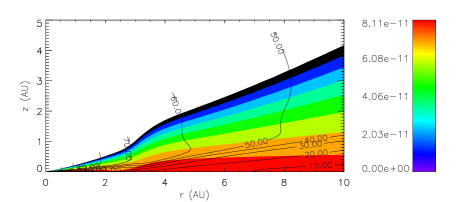
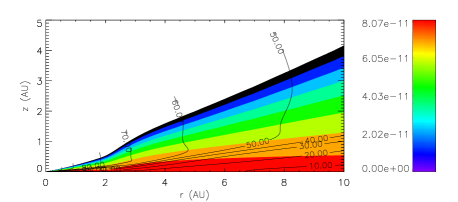
Fig. 3 shows the results of our simulations of the disc’s temperature and density structure of the dust component for disc models with and without of dust settling (the bottom and top panels, respectively). The figures present the mass-averaged disc temperature given by equation (2.7). The common feature of both cases is that the surface layer has a higher temperature than the disc mid-plane. This is because the surface layer is directly heated by the central star while the mid-plane is heated mainly by the thermal emission of dust as first noted by Kenyon & Hartmann (1987, also see CG97). This is confirmed by the structure of the temperature contours. For the optically thin surface layer, the contours have spherical shapes, meaning that the stellar radiation dominates the thermal emission of dust. For the mid-plane region, the contours show straight lines that are parallel to the density structure of the dust denoted by colors. In this regime, dust emission dominates stellar radiation. The physical picture that the mid-plane region is enclosed by the superheated layers is consistent with the analytical models proposed by CG97 although their disc models have only two characteristic temperatures, one of which is for the superheated layer, the other of which characterizes the mid-plane. The transition region between these two regimes is characterised by a steep vertical temperature gradient.
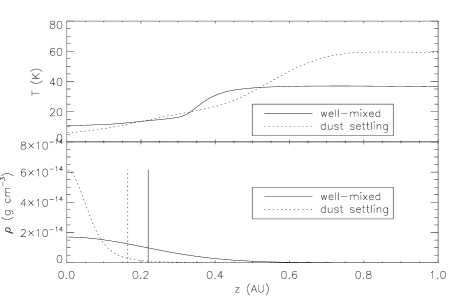
Dust settling changes the temperature structure as well as the density structure of dust as is expected by equation (2.9) (see Fig. 3 and 5). The main effect of dust settling is that the surface region has a higher temperature while the mid-plane region has a lower temperature. This behaviour is explained by the fact that different sizes of dust have different scale heights. In the surface layer, larger dust grains are depleted, but smaller grains still exist. These are more important for absorbing stellar radiation. Thus, photons emitted by the star can be efficiently absorbed by the surface layer. On the other hand, the mid-plane region has many sizes of dust due to settling, resulting in a higher density compared with the case of well-mixed case. Thus, the optical depth is increased and photons emitted from the star have more difficulty in passing through the region. Eventually, the energy absorbed in the region becomes smaller, and the temperature is decreased. This difference of the temperature, in turn, affects the density distribution of the gas by reducing its scale height (the vertical lines in Fig. 5). Thus, dust settling drives the structure of discs from flared to flatter shapes (see Fig. 3). This is consistent with the results of time-dependent dust settling models (Dullemond & Dominik, 2004a) while we assumed dust settling to be in the steady state.
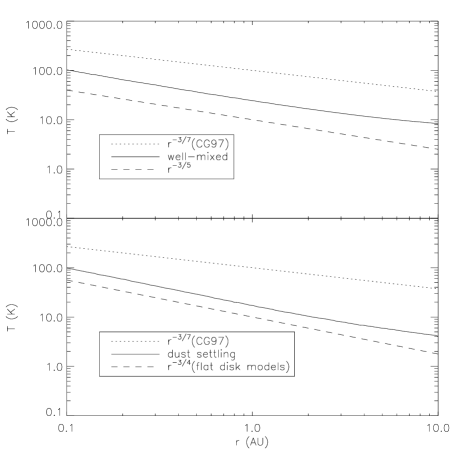
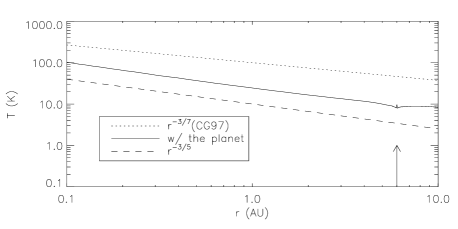
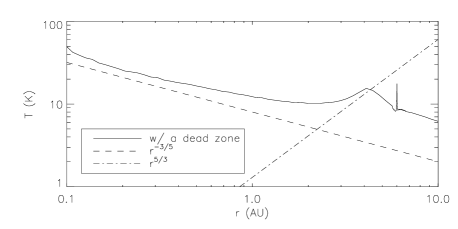
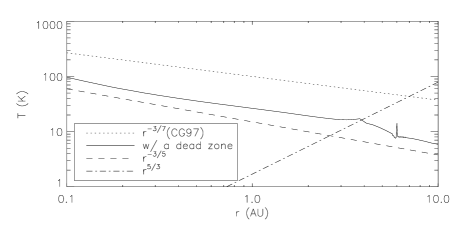
Fig. 5 shows the temperature at the mid-plane as a function of disc radius. The top panel shows the well-mixed model in which the temperature profile is well represented by . Thus, our resultant discs are less flared relative to CG97 because of the increase of disc masses. The bottom panel shows the case of dust settling in which the temperature profile is well represented by . Interestingly, this power-law can be derived from flat disc models (CG97). This is another indicator of flatter disc shapes.

3.2 The effects of planets
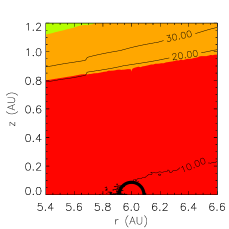
In this subsection, we focus on the effect of the gravitational force of planets with various masses. The fiducial location of a planet is fixed as 6 au. Fig. 6 shows the results of our simulations of the thermal structure of discs and the density structure of dust with planets. The masses of the planets are 0.1, 1, 5, and 10 on the top to bottom panels, respectively. The main difference in the density structure of dust is the decrement of the density above the planet which is expected by equation (2.11). This effect increases as the masses of planet increase. Another difference is the decrement of the temperature of the mid-plane region on the dayside of the planet as shown by the contour of 10 K. This effect is also enhanced with planetary masses since it arises from the gravitational force of the planet to compress the material above them, resulting in the increase of the density of dust in the mid-plane region (also see Fig. 19). This makes it more difficult for photons to penetrate and heat the region. The lower temperature was not found by JS03, JS04, and J08 because they included viscous heating although it is dominant only within a few au.
Fig. 7 shows the temperature at the mid-plane for the case of 10 . As discussed above, the temperature on the dayside of the planet becomes lower than that of the unperturbed case (also see Fig. 5). Furthermore, the temperature on the nightside of the planet also decreases for the same reason. Interestingly, the temperature at the location of the planet has a sharp peak. This arises from the compression of material above the planet, so that mean free paths of photons become longer. Consequently, more photons with higher energy can reach to the mid-plane regions. Further detailed analyses and discussion are tossed into Appendix B.
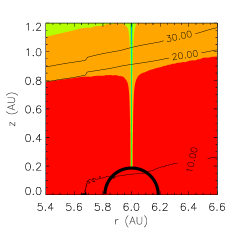
We now focus on the combined effect of dust settling and planets. Fig. 8 shows the results of our simulations of the thermal structure of discs and the density structure of dust with dust settling and planets. Planetary masses are changed from 0.1, 1, 5, to 10 on the top to bottom panels, respectively. The important consequence of the combination is a dip of the temperature contours at the location of the planets, which is clearly seen by the contour of 10 K for the case of the planet with 0.1 . The existence of this higher temperature region above the planets is explained by the same reason of the effect of dust settling. In other words, the lower density of dust produced by the combination of the planet and dust settling increases the mean free paths of photons. This allows more photons penetrate deeper into the mid-plane region. Consequently, the region above the planets has a higher temperature.
Fig. 9 shows the temperature distribution with 10 planet at the mid-plane. A temperature peak at the co-orbital radii of the planet is enhanced due to the combined effect of the planet and dust settling, as discussed above. It is likely that this effect may drastically change the formation of gas giants. This is because accretion of gas envelops surrounding planets is sensitive to the gas temperature. Further detailed analyses and discussion of the dust distribution around a planet are presented in Appendix B.


3.3 Dead zones in models with and without planets
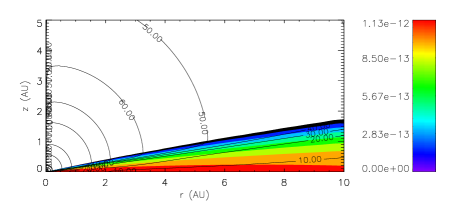
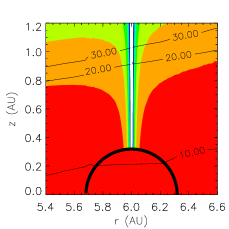
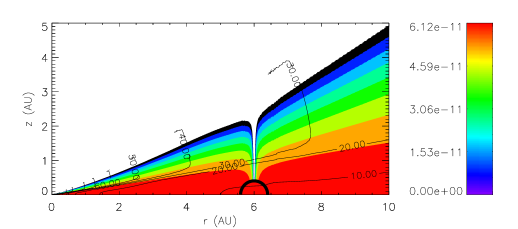
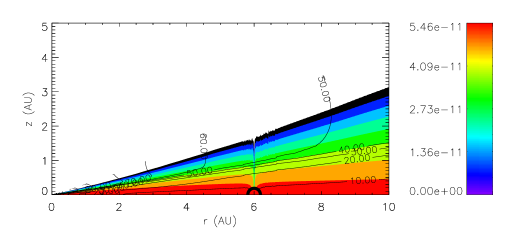
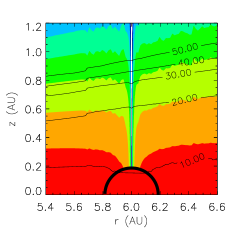
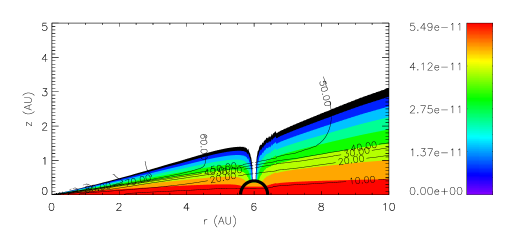
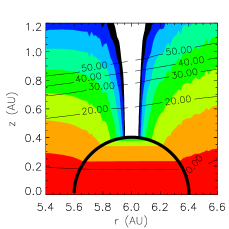
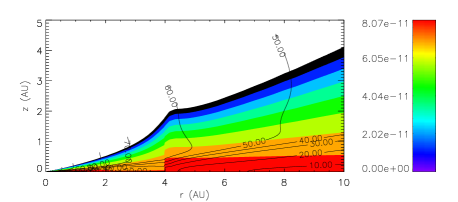
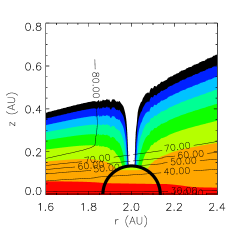
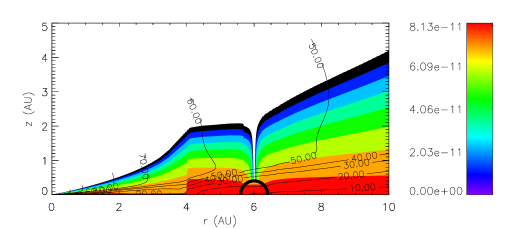
The major effect on the thermal structure of a disc arises from a dead zone (which is 4 au in size in our model). Fig. 10 shows the results of our simulations of the thermal structure of discs and the density structure of dust with dead zones and dust settling. The dead zone drastically changes the density distribution of dust because dust settling is enhanced due to the low turbulence there (also see equation 2.9). Thus, larger dust grains accumulate at the mid-plane since the scale heights of such dust become much smaller. The accumulation of dust into the mid-plane is prevented in the active zone due to the stronger turbulence. Consequently, a distinct step in the scale height of dust - or ”wall” - is left at the boundary between the active and dead zones. This dusty wall plays a significant role in the thermal structure of discs since dust is the main absorber of stellar irradiation.
The temperature structure of discs is also substantially changed by the dead zone although the basic physics occurring within the dead zone is the same as that of dust settling. Thus, the surface layer has a higher temperature and the mid-plane region has a lower temperature. Also, these two regions are separated by a transition region that features a tight collection of the temperature contours. The transition region is more declined toward the mid-plane in the dead zone. This arises from the enhancement of dust settling within the dead zone. Thus, in the dead zone, the superheated layer expands and the mid-plane region shrinks. In contrast, the turbulence in the active region keeps dust aloft although dust settling is inevitable because of grain growth due to agglomeration. The dust wall formed at the outer edge of the dead zone is thus directly exposed to the stellar radiation. This is one of the most important findings in our study. Consequently, the strange shapes of temperature contours sandwiched by the spherical shapes (the optically thin, surface regions) and straight lines (the optically thick, mid-plane regions) are produced.
We found another important effect of the dusty wall. Fig. 11 shows the temperature of the mid-plane. Importantly, the temperature in the vicinity of the dead zone increases toward the dusty wall. This unusual temperature behaviour is also explained by the direct exposure of the wall to stellar radiation. The direct heating provides the wall with higher energy, resulting in a higher temperature (otherwise the region is heated only by the thermal emission of dust, which provides much lower energy). Since the region is optically thick, the energy absorbed by the wall is transferred by diffusion processes (Hasegawa & Pudritz, 2009). Thus, the presence of the hot dusty wall provides a positive temperature gradient. It is well-represented by an temperature distribution which can be also derived from analytical calculations. This temperature behaviour provides striking effects on planetary migration, which are addressed in a companion paper (Hasegawa & Pudritz, 2009).
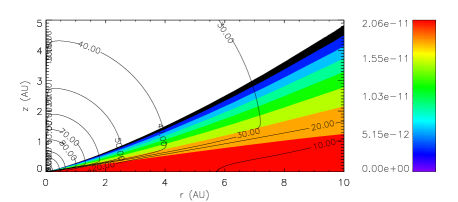
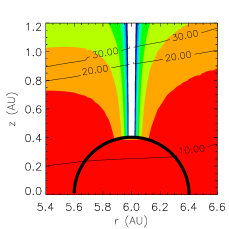
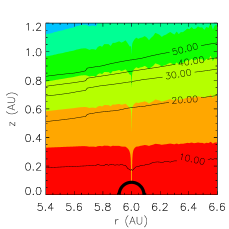
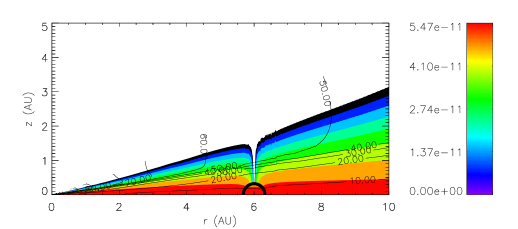
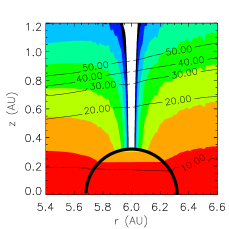
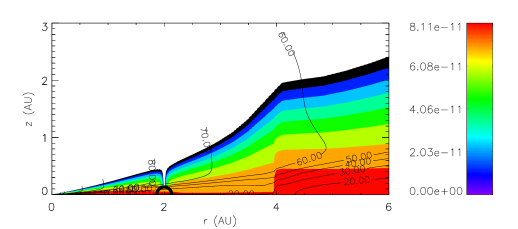
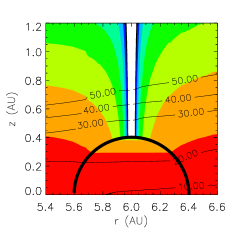
We now focus on the combined effects of the dead zone with dust settling and planets with 10 . We examine two extreme cases; one of which is that of a planet that is located outside the dead zone ( au), and the other in which it is located at au inside the dead zone. Fig. 12 shows our results for the temperature structure of discs and the density structure of dust. The common feature of the density structure is the compression of the density above the planet although the overall density structure is similar to the case only with the dead zone. The main difference between these cases is the effect of the planet on the mid-plane region of discs. For the planet outside the dead zone, the density is further distorted by the gravitational force of the planet while, for the inside case, the distortion by the planet is not clear. This is explained by the enhancement of dust settling in the dead zone. As discussed above, dust settles much more compactly into the mid-plane in the dead zone. The planet also compresses dust into the mid-plane. Thus, both the dead zone and the planet affect the density distribution in a similar way, although the former is global and the latter is local. Thus, the global effect of the dead zone dominates the local effect of the planet. The active zone, however, allows the perturbation of the planet to be shown clearly due to the stronger turbulence. Thus, the combination of the dead zone and the planet still allows dust to settle into the mid-plane further although the dead zone surpasses the effect of the planet. Furthermore, the formation of the dusty wall is never affected by the inclusion of a planet, provided that the planets is not placed in the immediate vicinity of the dead zone.
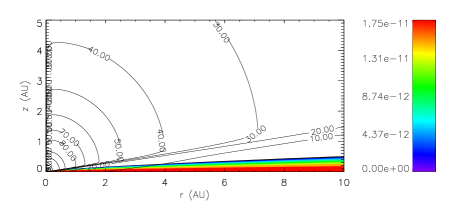
The temperature structure is also changed by the combination of the two although it is roughly similar to the case with only the dead zone. The main difference arises when the planet is placed outside the dead zone. The compression of dust produces the self-shadowing region shown by the contours of 10 and 20 K of Fig. 12 (also see Fig. 10). There is no clear difference for the case of the planet inside the dead zone. This is explained by the fact that the dust distribution with the planet is almost identical to that without the planet since the effect of the dead zone is too strong relative to the gravitational force of the planet. Thus, the physical picture that the dusty wall becomes thermally hot due to the direct heating of the star is true even if the perturbation of the planets is included. This is also confirmed by Fig. 13 which shows the temperature at the mid-plane.


4 The effects of disc mass and viscous heating
We have demonstrated a novel thermal effect due to the presence of the dead zone, namely, the appearance of the dusty wall at the inner edge of the active zone and the resultant positive temperature gradient. In this section, we undertake parameter studies to confirm this finding for various disc parameters. Also, we discuss the effects of other heat sources that have been neglected so far.
4.1 Parameter study
We have used disc models and parameters that reproduce the observed SEDs around M stars (S07) in which . On the other hand, there is another famous disc model, so-called minimum mass solar nebula (MMSN) model in which (Hayashi, 1981). MMSN models also succeed in reproducing the observed SEDs (e.g., CG97). Thus, protoplanetary discs are likely to have the range for the surface density from to . Thus, it is important to check our findings for MMSN models as well. Also, we have increased the disc mass by a factor of 10 which is favoured if massive planets are to be formed (Kokubo & Ida, 1998; Alibert et al., 2005).
With this motivation, we performed a parameter study involving the slope of surface density and the disc mass. Table 3 summarises our runs (also see Table 1). In the simulations, we include a 5 planet at 6 au to verify the effect of the gravitational force of the planet. Fig. 14 shows the temperature of the mid-plane for the runs. Every case shows the positive temperature gradient although MMSN-4 provides a shallower slope. This shallower slope is explained by a higher temperature of the mid-plane for lower mass discs, resulting in positive temperature gradients that are somewhat diminished by the original temperature of the mid-plane. Thus, the formation of the positive temperature gradient depends on the mass of discs, not the slope of the surface density. Furthermore, sharp peaks produced by the presence of the planet are also sustained. Thus, our findings of the dusty wall and the positive temperature gradient are robust although the slope of the temperature may be changed by the mass of discs.
We now investigate the effect of the size of the dead zones. We have fixed the size of the dead zone as 4 au so far. Many previous studies, however, showed that the size depends on parameters they used although there is the agreement with each other that its size is roughly 10 au. Furthermore, Matsumura et al. (2009) found that dead zones evolve with time and shrink following the accretion of gas onto the star. Thus, the size of the dead zones also has some uncertainties. In order to compare our findings for various sizes of the dead zones, we performed simulations with 1 and 8 au size of the dead zones with dust settling. In the simulations, we use the parameters of Table 1 and do not include the planet since we have shown that the resultant effects of the dead zone and the planet are robust. Fig. 15 shows the temperature at the mid-plane. Both cases show the positive temperature gradient at the outer edge of the dead zones. Furthermore, the temperature behaviours are also well-represented by , meaning that the energy absorbed in the dusty wall due to the direct heating from the star is transferred by the diffusion processes. Thus, our findings are independent of the size of dead zones.
We next turn to examining dead zones with a finite radial transition region between the dead and active zones. Although we have assumed so far that the active region suddenly appears at various disc radii from the central star, the transition region will in general be diffused since the presence of the dead zones activates various instabilities as discussed below. Dead zones with a finite transition region can be generally written as
| (4.1) |
where au is the fiducial size of the dead zone and is the thickness of the transition region. Fig. 16 shows our results - the thermal and density structures of dust and the temperature of the mid-plane as a function of disc radius from the star (the left and right columns, respectively). The parameter is changed from 1, 3, 5, and 10 , where is the scale height of gas, on the top to bottom panels, respectively. The positive temperature gradient appears in every case. Interestingly, the slope of the positive temperature gradient is more or less represented by although it becomes shallower as increases. The difference of the slope is explained by the shape of the dusty wall. A gradual transition of the value of for a finite value of provides smoother density distribution of dust, resulting in a gentle temperature gradient. Furthermore, the location of the positive temperature gradient is changed for these cases. The positive temperature gradient appears at the mid-plane region closer to the star, as increases. This is also understood by the structure of the dusty wall. For the dead zone with a thicker transition region, the dusty wall presents at smaller disc radii from the host star.
| Run | ||
|---|---|---|
| MMSN-3 | 4.5 | |
| MMSN-4 | 4.5 | |
| S07-4 | 4.5 |


4.2 The addition of viscous heating
In our simulations, we have considered stellar irradiation as the main heat source for discs, so that other potential heat sources such as viscous heating and the accretion luminosity of planets have been neglected. This is because we have assumed discs to be passive following CG97. This assumption is likely to be appropriate since viscous heating is dominant only within 0.1 au for M star systems. Furthermore, the resultant SEDs of passive discs agree with the observed ones very well (CG97; Chiang & Goldreich, 1999; Chiang et al., 2001). On the other hand, the SEDs produced from the models including viscous heating as well as stellar irradiation are also able to reproduce the observations (D’Alessio et al., 1998, 1999). Thus, it is worth analysing the effects of viscous heating on the dusty wall and the resultant temperature structures since the constraints arising from SEDs are necessary, but not sufficient conditions.
The positive temperature gradient formed in front of the dust wall is maintained even if viscous heating is included. This is because the temperature around the dust wall determined by the direct exposure of stellar irradiation is much higher. Viscous heating cannot wash out this effect since the temperature due to viscous heating is dominant only within 0.1 au.
Furthermore, the low turbulence within the dead zones implies that viscous heating is strongly reduced. Weaker viscous heating strongly supports our assumption of passive discs. Therefore, our assumption is valid throughout the disc beyond 0.1 au and our findings are robust features of the dead zone even if viscous heating is included.
In addition to viscous heating, the presence of planets provides another heat source due to accretion processes. During planet formation, protoplanets accrete gas, dust and planetesimals, resulting in the radiation of the extra gravitational energy. The temperature structure produced by the accretion luminosity of the planet is represented by due to the inverse square law. Thus, the temperature peak produced by the gravitational force of the planet becomes wider due to the accretion effect. Thus, although the accretion luminosity provides slight modification, the basic picture of our results is still valid. Planetary migration, however, may be affected by the accretion luminosity since it is determined by the quantities in the vicinity of planets. We leave this study in the future publication.
5 Inducing dead zone turbulence by dust settling
The presence of a dead zone is known to activate various instabilities in protoplanetary discs. In this section, we focus on the Kelvin-Helmholtz instability (KHI) that may arise.
The KHI is triggered by dust settling because the vertical shear is induced by the vertical difference of dust density (Sekiya, 1998; Johansen et al., 2006). The increase of the density of dust in the mid-plane causes the gas to be in Keplerian motion since the collisional interactions with dust become more efficient while the gas above the mid-plane is still in sub-Keplerian due to lower density of dust. This vertical difference in the gas velocity induces a vertical shear flow, resulting in the KHI. Such regions can therefore become turbulent.
This dust-induced turbulence is local and well-represented by the so-called Richardson number ,
| (5.1) |
where is the vertical gravitational force, is the gas density, is the dust density and is the vertical component of the gas velocity. The classical theory finds that 1/4 is the unstable condition (Chandrasekhar, 1961) although it is the necessary, but not sufficient condition. Recent numerical simulations have shown that the critical value is 1 (Johansen et al., 2006). Furthermore, the critical allows one to estimate the critical scale height of dust ,
| (5.2) |
where and is the adiabatic index of gas (Sekiya, 1998).
As discussed in 2, dust settling is compensated by the turbulence of discs. In our disc models, the strength of turbulence is controlled by which is a useful prescription for any global turbulence. Thus, we have treated the active and dead zones by adjusting . In the active well coupled zone, the origin of the turbulence is obvious, that is, the MRI. The origin of the turbulence in the dead zone, however, is ambiguous since the MRI cannot be active due to the low ionization. Thus, we examine whether or not our assumption for the dead zones is consistent with the KHI.
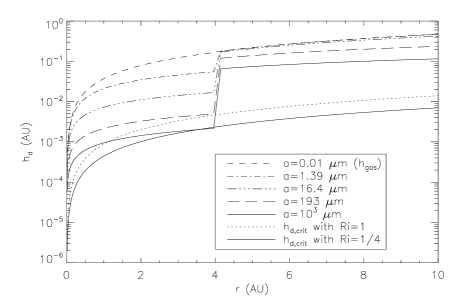
Fig. 17 shows the scale height of dust as a function of the distance from the star with a 4 au sized dead zone. Since the scale height of dust depends on the strength of turbulence as well as its size in our disc models (see equation (2.9)), it drastically changes at the boundary of the active and dead zones. Also, the critical scale heights of dust with and are plotted. In the active zone, both of the critical scale heights of dust are much smaller than those of our scale heights of dust. This indicates that the MRI turbulence is so strong that the KHI cannot be active and is not therefore the primary driver of disc turbulence.
The situation in the dead zone is significantly different. The critical scale height of dust with occurs for dust grains with 1mm size. For the case of , the critical case is that for dust with 193 m size. For these grains, the KHI becomes active. This implies that the origin of turbulence in the dead zones may be due to the KHI. Thus, it is worth estimating the value of arising from the KHI following Johansen et al. (2006). From equation (2.9), the ratio of the scale height of dust to that of gas becomes
| (5.3) |
since . In addition, the scale height of dust estimated from the KHI is given by equation (5.2). Equating these two equations, the arising from the KHI is
| (5.4) |
Fig. 18 shows the value of as a function of disc radius. As discussed above, the in the active zone is about two orders of magnitude smaller than that of the MRI. Within the dead zone, the lies in the range between and . This supports the value of in the dead zone used in the literature (e.g., Inutsuka & Sano, 2005; Matsumura & Pudritz, 2006). The origin of turbulence in the dead zone is probably governed by the KHI, although the derived is a kind of the maximum value because the recent study including the radial Keplerian shear has shown that the KHI can be active only when a mode of the instability grows faster than it is sheared out (Ishitsu & Sekiya, 2003). Furthermore, Ishitsu & Sekiya (2003) have shown that although the equilibrium state of the dust distribution can be established, the critical conditions are different from the Richardson number because it does not include the effect of the Keplerian shear. Further study such as global simulations is needed.
6 Conclusions
In this paper, we have investigated the detailed thermal structure of protoplanetary discs around M stars by solving the radiative transfer equation in 2D discs by means of the Monte Carlo method. In our simulations, stellar irradiation is absorbed by dust in discs and is their main heat source. Thus, the properties of dust such as its composition, size and density distributions are crucial in this study. For the composition, we have adopted the models that are derived from the solar abundance. For the size distribution, we have adopted the power-law distribution in which the size of dust is from 0.1 m to 1 mm. Since we have used elaborated models for the dust distribution, we had to sample the size of dust within this range. Our convergence study has shown that 15 sizes of dust chosen from this range are sufficient to describe the temperature of discs to an accuracy of better than 10 per cent. Our results of the dust temperatures are more accurate than those derived from the mean opacity for the ensemble of larger dust grains (e.g., S07). Furthermore, we have included dust settling, the gravitational force of the planet and the presence of dead zone.
The most important findings of this study are the followings;
-
1.
The temperature of the mid-plane is well-represented by when dust settling is included. This power-law was derived by CG97 by assuming discs to be flat. Well mixed dust models result in an temperature distribution. We have confirmed that dust settling makes discs geometrically flatter.
-
2.
The presence of the dead zone in discs implies the presence of a dust wall at the boundary of the active and dead zones. This wall will be directly exposed to stellar irradiation. Consequently, a positive temperature gradient is formed in the temperature profile of the mid-plane. This is explained by the higher energy at the wall that is propagated by radiative diffusion since the mid-plane is optically thick. We have found that even if the planets are present in front of the wall, this thermally hot dusty wall and the positive temperature gradient are maintained.
-
3.
The dead zones excite the Kelvin-Helmholtz instability because of enhanced dust settling within them. Consequently, we have demonstrated that a self-consistent value of in dead zones is expected. This result backs up the assumptions of many previous models for dead zones.
Furthermore, we have confirmed earlier results in the literature that the surface layer has a higher temperature than the mid-plane region in any disc model. The surface layer is directly heated by the central star while the mid-plane region is only heated by the thermal emission of dust. Our simulations with dust settling have shown that this process leaves the surface layer hotter and the mid-plane region cooler. This arises from the deficit of larger dust grains in the surface layer and the increment of them in the mid-plane region. This can be also understood by the mean free paths of photons that are determined by the density of dust. Therefore, dust settling makes the mean free paths in the surface layer longer and those in the mid-plane region shorter. Also, we have shown that the inclusion of the planets triggers the compression of the material above them, resulting in longer mean free paths of photons. The region above the planets has a higher temperature.
We have also performed a parameter study for our disc models by varying the total disc masses and the surface density distributions. It is generally thought that the disc masses are about ten times more massive than the observed ones in order for gas giants to be formed. Also the observations have indicated that the surface density has some range from to . We have confirmed that our findings are basically unaffected for such parameter spaces, although the lower disc masses result in a higher temperature at the mid-plane, causing the positive temperature gradient to be somewhat diminished. In addition, the formation of the positive temperature gradient is independent of the size of dead zones since the dusty wall is present for any size of the dead zone. Furthermore, the positive temperature gradient is sustained for dead zones with a finite transition for .
We have also examined other heat sources for discs such as viscous heating and the accretion luminosity of the planets. We have estimated viscous heating is only important within about 0.1 au for M stars although it is known to be dominant within about 1 au for the classical T Tauri stars. Thus, we have investigated the detailed effects of dust settling, dead zones, and planets on the thermal structure of irradiated discs.
In subsequent papers, we will discuss the effect of our results on planetary migration because Lindblad torques, the main driving force of type I migration, are affected by the gas pressure. In addition, we will address the effects of the dead zones on the spectral energy distributions (SEDs) and images. It is well known that the presence of embedded planets in discs provide some interesting observational signatures on the SEDs and/or images by forming a gap for massive ones (Varnière et al., 2006) and by distorting the density distribution for low mass ones (Jang-Condell, 2009). We anticipate that the presence of the dead zones will also have an interesting contribution to the SEDs arising from the dusty wall and resultant positive temperature gradient.
Acknowledgments
The authors are indebted to Kees Dullemond for the use of his excellent radiative transfer code and for several very useful discussions during a sabbatical stay at the Institute for Theoretical Astrophysics in Heidelberg. We also thank Thomas Henning, Hubert Klahr, Kristen Menou, Soko Matsumura and Richard Nelson for stimulating discussions and an anonymous referee for useful comments on our manuscript. Our simulations were carried out on computer clusters of the SHARCNET HPC Consortium at McMaster University. YH is supported by SHARCNET Graduate Fellowship as well as McMaster University and REP by a Discovery Grant from the Natural Sciences and Engineering Research Council (NSERC) of Canada.
References
- Acke et al. (2004) Acke B., van den Ancker M. E., Dullemond C. P., van Boekel R., Waters L. B. F. M., 2004, A&A, 422, 621
- Alibert et al. (2005) Alibert Y., Mordasini C., Benz W., Winisdoerffer C., 2005, A&A, 434, 343
- Apai et al. (2005) Apai D., Pascucci I., Bouwman J., Natta A., Henning T., Dullemond C. P., 2005, Sci, 310, 834
- Artymowicz (1993) Artymowicz P., 1993, ApJ, 419, 155
- Balbus & Hawley (1991a) Balbus S. A., Hawley J. F., 1991a, ApJ, 376, 214
- Balbus & Hawley (1991b) Balbus S. A., Hawley J. F., 1991b, ApJ, 376, 223
- Beaulieu et al. (2006) Beaulieu J.-P., et al., 2006, Nat, 439, 437
- Bjorkman & Wood (2001) Bjorkman J. E., Wood K., 2001, ApJ, 554, 615
- Calvet et al. (1991) Calvet N., Patiño A., Magris G. C., D’Alessio P., 1991, ApJ, 380, 617
- Chandrasekhar (1961) Chandrasekhar S., 1961, Hydrodynamic and Hydromagnetic Stability. Oxford Univ. Press, Oxford
- Chiang & Goldreich (1997) Chiang E. I., Goldreich P., 1997, ApJ, 490, 368
- Chiang & Goldreich (1999) Chiang E. I., Goldreich P., 1999, ApJ, 519, 279
- Chiang et al. (2001) Chiang E. I., Joung M. K., Creech-Eakman M. J., QI C., Kessler J. E., Blake G. A., van Dishoeck E. F., 2001, ApJ, 547, 1077
- D’Alessio et al. (2001) D’Alessio P., Calvet N., Hartmann L., 2001, ApJ, 553, 321
- D’Alessio et al. (2006) D’Alessio P., Calvet N., Hartmann L., Franco-Hernández R., Serín H., 2006, ApJ, 638, 314
- D’Alessio et al. (1999) D’Alessio P., Calvet N., Hartmann L., Lizano S., Cantó J., 1999, ApJ, 527, 893
- D’Alessio et al. (1998) D’Alessio P., Cantó J., Calvet N., Lizano S., 1998, ApJ, 500, 411
- D’Angelo et al. (2003) D’Angelo G., Henning T., Kley W., 2003, ApJ, 599, 548
- D’Angelo et al. (2003) D’Angelo G., Kley W., Henning T., 2003, ApJ, 586, 540
- Draine & Lee (1984) Draine B. T., Lee H. M., 1984, ApJ, 285, 89
- Draine & Li (2007) Draine B. T., Li A., 2007, ApJ, 657, 810
- Dubrulle et al. (1995) Dubrulle B., Morfill G., Sterzik M., 1995, Icarus, 114, 237
- Dullemond & Dominik (2004a) Dullemond C. P., Dominik C., 2004a, A&A, 421, 1075
- Dullemond & Dominik (2004b) Dullemond C. P., Dominik C., 2004b, A&A, 417, 159
- Dullemond et al. (2009) Dullemond C. P., Hollenbach D., Kamp I., D’Alessio P., 2009, Protostars and Planets V. Univ. Arizona Press, Tucson
- Dullemond & Turolla (2000) Dullemond C. P., Turolla R., 2000, A&A, 360, 1187
- Fromang & Papaloizou (2006) Fromang S., Papaloizou J., 2006, A&A, 452, 751
- Furlan et al. (2005) Furlan E., Calvet N., D’Alessio P., Hartmann L., Forrest W. J., Watson D. M., Uchida K. I., Sargent B., Green J. D., Herter T. L., 2005, ApJ, 628, L65
- Gammie (1996) Gammie C. F., 1996, ApJ, 457, 355
- Goldreich & Tremaine (1979) Goldreich P., Tremaine S., 1979, ApJ, 233, 857
- Goldreich & Tremaine (1980) Goldreich P., Tremaine S., 1980, ApJ, 241, 425
- Hasegawa (2008) Hasegawa Y., 2008, Master’s thesis, McMaster University
- Hasegawa & Pudritz (2009) Hasegawa Y., Pudritz R. E., 2009, submitted
- Hayashi (1981) Hayashi C., 1981, Prog. Theor. Phys. Suppl., 70, 35
- Ida & Lin (2008) Ida S., Lin D. N. C., 2008, ApJ, 685, 584
- Inutsuka & Sano (2005) Inutsuka S., Sano T., 2005, ApJ, 628, L155
- Ishitsu & Sekiya (2003) Ishitsu N., Sekiya M., 2003, Icarus, 165, 181
- Jang-Condell (2008) Jang-Condell H., 2008, ApJ, 679, 797
- Jang-Condell (2009) Jang-Condell H., 2009, preprint (astro-ph/arXiv:0906.1375v1)
- Jang-Condell & Sasselov (2003) Jang-Condell H., Sasselov D. D., 2003, ApJ, 593, 1116
- Jang-Condell & Sasselov (2004) Jang-Condell H., Sasselov D. D., 2004, ApJ, 608, 497
- Jang-Condell & Sasselov (2005) Jang-Condell H., Sasselov D. D., 2005, ApJ, 619, 1123
- Johansen et al. (2006) Johansen A., Henning T., Klahr H., 2006, ApJ, 643, 1219
- Johansen et al. (2007) Johansen A., Oishi J. S., Mac Low M.-M., Klahr H., Henning T., Youdin A., 2007, Nat, 448, 1022
- Kenyon & Hartmann (1987) Kenyon S. J., Hartmann L., 1987, ApJ, 323, 714
- Klahr & Kley (2006) Klahr H., Kley W., 2006, A&A, 445, 747
- Kokubo & Ida (1998) Kokubo E., Ida S., 1998, Icarus, 131, 171
- Kretke & Lin (2007) Kretke K. A., Lin D. N. C., 2007, ApJ, 664, L55
- Liu et al. (2006) Liu L. H., Zhang L., Tan H. P., 2006, J. Quant. Spectrosc. Radiat. Transfer, 97, 446
- Mathis et al. (1977) Mathis J. S., Rumpl W., Nordsieck K. H., 1977, ApJ, 217, 425
- Matsumura & Pudritz (2003) Matsumura S., Pudritz R. E., 2003, ApJ, 598, 645
- Matsumura & Pudritz (2006) Matsumura S., Pudritz R. E., 2006, MNRAS, 365, 572
- Matsumura et al. (2009) Matsumura S., Pudritz R. E., Thommes E. W., 2009, ApJ, 691, 1764
- Mayor & Queloz (1995) Mayor M., Queloz D., 1995, Nat, 378, 355
- Menou & Goodman (2004) Menou K., Goodman J., 2004, ApJ, 606, 520
- Mohanty et al. (2005) Mohanty S., Jayawardhana R., Basri G., 2005, ApJ, 626, 498
- Nelson et al. (2000) Nelson R. P., Papaloizou J. C. B., Masset F., Kley W., 2000, MNRAS, 318, 18
- Paardekooper & Mellema (2006) Paardekooper S.-J., Mellema G., 2006, A&A, 459, L17
- Pascucci et al. (2004) Pascucci I., Wolf S., Steinacker J., Dullemond C. P., Henning T., Niccolini G., Woitke P., Lopez B., 2004, A&A, 417, 793
- Pollack et al. (1994) Pollack J. B., Hollenbach D., Beckwith S., Simonelli D. P., Roush T., Fong W., 1994, ApJ, 421, 615
- Pringle (1981) Pringle J. E., 1981, ARA&A, 19, 137
- Sano et al. (2000) Sano T., Miyama S., Umebayashi T., Nakano T., 2000, ApJ, 543, 486
- Scholz et al. (2007) Scholz A., Jayawardhana R., Wood K., Meeus G., Stelzer B., Walker C., O’Sullivan M., 2007, ApJ, 660, 1517
- Schräpler & Henning (2004) Schräpler R., Henning T., 2004, ApJ, 614, 960
- Sekiya (1998) Sekiya M., 1998, Icarus, 133, 298
- Shakura & Sunyaev (1973) Shakura N. I., Sunyaev R. A., 1973, A&A, 24, 337
- Tanaka et al. (2002) Tanaka H., Takeuchi T., Ward W. R., 2002, ApJ, 565, 1257
- Udry et al. (2009) Udry S., Fischer D., Queloz D., 2009, Protostars and Planets V. Univ. Arizona Press, Tucson
- Udry & Santos (2007) Udry S., Santos N. C., 2007, ARA&A, 45, 397
- van Noort et al. (2002) van Noort M., Hubeny I., Lanz T., 2002, ApJ, 568, 1066
- Varnière et al. (2006) Varnière P., Bjorkman J. E., Frank A., Quillen A. C., Carciofi A. C., Whitney B. A., Wood K., 2006, ApJ, 637, L125
- Ward (1997) Ward W. R., 1997, Icarus, 126, 261
- Weidenschilling (1977) Weidenschilling S. J., 1977, MNRAS, 180, 57
- Whitney & Wolff (2002) Whitney B. A., Wolff M. J., 2002, ApJ, 574, 205
- Wolf (2003) Wolf S., 2003, ApJ, 582, 859
- Youdin & Goodman (2005) Youdin A. N., Goodman J., 2005, ApJ, 620, 459
Appendix A The trajectory of photons projected into 2D planes in cylindrical coordinate systems
Here, we obtain solutions of the trajectory of photons projected into 2D planes in cylindrical coordinate systems. First of all, we setup a global cylindrical and local spherical coordinate system by following Dullemond & Turolla (2000). We assume discs to be axisymmetrical, so that any dependence on is dropped out. The north pole is aligned with the z-axis of the global system. Consequently, is measured from this axis toward the mid-plane and follows photons as they move upward or downward compared with the mid-plane. is measured from the local x-axis which is parallel to the global x-axis. The coordinate tracks photons as they move forward or backward compared with the local coordinate system.
The radiative transfer equation in the cylindrical system is
| (A.1) |
where is the specific intensity at frequency , is the displacement of the path of a photon, and (Liu et al., 2006). Thus, the variations of , , , and along the path of the photon are
| (A.2a) | |||||
| (A.2b) | |||||
| (A.2c) | |||||
| (A.2d) | |||||
A set of solutions we found are
| (A.3a) | |||||
| (A.3b) | |||||
| (A.3c) | |||||
| (A.3d) | |||||
where is the impact parameter of the ray with respect to the origin, is the height from the mid-plane of the closest point to the north pole of the global system.
We use the solutions to follow the path of photons. When a photon is located at and its new direction is determined as by a random number, the constants are
| (A.4a) | |||||
| (A.4b) | |||||
where , , , and represent the grid number at which the photon is placed since although the Monte Carlo method is a non grid-based code, all physical quantities such as the density and temperature are defined on the grid. Thus, the next point it will reach is determined by the intersection between grid points and the solutions.
Equations (A.3a) and (A.3b) give us two and one values for , respectively. Since possible grid points the photon can take are , , and (), and , , and ( ). Thus, the total number of possible values of is 9 and are given by
| (A.5a) | |||||
| (A.5b) | |||||
where , , , and . The actual path is determined so that the absolute value of is a minimum and not the same as which is the path evaluated at .
Appendix B Temperature and dust density distribution around a planet
Here, we carefully analyse and discuss the thermal and dust density structures of discs with a planet for the well mixed and dust settling cases.
B.1 The well-mixed case
Fig. 19 shows the vertical temperature and density of dust, in a model with well mixed dust, in the vicinity of the 10 planet (Solid lines). For comparison, the unperturbed case is denoted by the dotted lines. Quantities at are denoted in red while those at are in black. The presence of a planet increases the density at the mid-plane region due to the gravitational force of the planet. This results in the compression of dust (and gas) at (compare solid lines with dotted lines). For the temperature structure, the inclusion of the planets causes the surface layer to be hotter at than the case without the planet (see two red lines). This is explained by similar effects of dust settling. The compression of material reduces the optical depth, resulting in a higher temperature. On the other hand, the surface layer at becomes slightly cooler by the planets (see two black lines). In other words, there is no self-illumination region in our simulations. For the mid-plane region, the temperature becomes cooler due to the gravitational force of the planets at (compare solid lines with dotted lines). This is a self-shadowing effect, as found by JS03, JS04, J08.
Thus, we could not find the self-illumination regions clearly, differing from the findings of JS03, JS04 and J08. We did find the self-shadowing regions, however, although its effects are relatively small. This is because of the increment of disc masses and the resultant relatively less flaring disc structure. JS04 found that the temperature variation due to the planets becomes smaller when the slope of the surface density is steeper because higher density prevents photons from penetrating it deeply. Also, J08 found that the self-shadowing and illumination regions are very sensitive to the incident angle of stellar radiation. The increase of mass allowing massive planets to be formed results in a relatively flatter disc structure (see Fig. 5). This prevents the regions perturbed by the planet from being exposed to stellar radiation. Thus, the results of our simulations are not precisely the same, although consistent with those of JS03, JS04 and J08 due to the increase of the disc mass.
B.2 The dust settling case
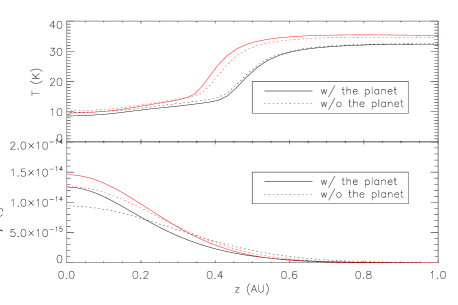
Fig. 20 shows the vertical temperature and density of dust, in a model with dust settling, in the vicinity of the planet with 10 . The main trend is the same as the case including the planets only. Higher density in the mid-plane regions results in much smaller temperature difference between . For the surface region, the temperature at becomes higher while the one at is lower when the planets are included.