Gravitational Collapse and Filament Formation: Comparison with the Pipe Nebula
Abstract
Recent models of molecular cloud formation and evolution suggest that such clouds are dynamic and generally exhibit gravitational collapse. We present a simple analytic model of global collapse onto a filament and compare this with our numerical simulations of the flow-driven formation of an isolated molecular cloud to illustrate the supersonic motions and infall ram pressures expected in models of gravity-driven cloud evolution. We apply our results to observations of the Pipe Nebula, an especially suitable object for our purposes as its low star formation activity implies insignifcant perturbations from stellar feedback. We show that our collapsing cloud model can explain the magnitude of the velocity dispersions seen in the 13CO filamentary structure by Onishi et al. and the ram pressures required by Lada et al. to confine the lower-mass cores in the Pipe nebula. We further conjecture that higher-resolution simulations will show small velocity dispersions in the densest core gas, as observed, but which are infall motions and not supporting turbulence. Our results point out the inevitability of ram pressures as boundary conditions for molecular cloud filaments, and the possibility that especially lower-mass cores still can be accreting mass at significant rates, as suggested by observations.
Subject headings:
turbulence — methods:numerical — ISM:clouds — ISM:kinematics and dynamics— stars:formation1. Introduction
The supersonic, “turbulent” motions observed in molecular clouds must play an important role in star formation. Early numerical models of molecular clouds often imposed supersonic velocities as either a continuous forcing term (Mac Low et al., 1998; Stone et al., 1998; Padoan & Nordlund, 1999) and/or as initial conditions (Bate et al., 2002, 2003). Yet without an understanding of how supersonic turbulence originates, it is difficult to develop a predictive theory of the processes leading to the formation of stars.
The recognition that molecular clouds might often if not generally result from accumulation of gas by large scale flows (Ballesteros-Paredes et al., 1999a, b; Hartmann et al., 2001) and in particular from atomic flows (Koyama & Inutsuka, 2002; Audit & Hennebelle, 2005; Heitsch et al., 2006b) has made it plausible that the turbulence is arising as a consequence of the cloud’s formation. Vázquez-Semadeni et al. (2007) showed that turbulence could develop in clouds formed by variable-velocity flows. By imposing a fixed spatial variation in the supersonic inflow velocities, they in effect identified the driving mechanism as variations in the inflow speeds (also Hennebelle et al., 2008). In contrast, Heitsch et al. (2006b, 2008b) showed that even uniform inflows can produce turbulent substructure if the shock interface is not planar and/or precisely perpendicular to the flows.
It is clear from the studies described in the previous paragraph that molecular clouds swept up by supersonic flows in the interstellar medium will begin their existence as both structured and turbulent. However, this sweep-up by itself only results in cold clouds that are at most mildly supersonic if not subsonic (Koyama & Inutsuka, 2002; Audit & Hennebelle, 2005; Heitsch et al., 2006b, 2008b). The dominant mechanism for producing supersonic ”turbulent” motions in molecular clouds – especially at column densities typical of star-forming clouds – is gravity (Vázquez-Semadeni et al., 2007, 2008, 2009; Heitsch et al., 2008b; Heitsch & Hartmann, 2008). This was already seen by Burkert & Hartmann (2004), who pointed out that clouds with many Jeans masses and non-spherical geometry are generically susceptible to generating large, spatially-variable gravitationally-driven flows, as commonly seen in simulations with non-periodic gravity allowing global collapse (Bate et al., 2002, 2003; Heitsch et al., 2008b; Vázquez-Semadeni et al., 2007, 2009). Hartmann & Burkert (2007) went further to argue that large-scale gravitational collapse is a feature of at least the Orion A molecular cloud (see also Tobin et al., 2009).
Relatively quiescent regions, undisturbed by energy input from young stars, can provide good tests of the gravity-driven picture of cloud evolution. The Pipe Nebula is a prominent and well-studied example of a cloud of significant molecular gas mass with little perturbing star formation (Lombardi et al., 2006; Forbrich et al., 2009). The densest regions of the Pipe generally lie along a well-defined filamentary structure (Alves et al., 2007; Rathborne et al., 2007; Muench et al., 2007; Lada et al., 2008; Rathborne et al., 2009) – a common feature of star-forming clouds (e.g., Schneider & Elmegreen, 1979). While much attention has been paid by the above authors to the mass function of the dense cloud cores found along the filaments, our interest is in the dynamical environment and evolution of these cores.
Lada et al. (2008) concluded that significant external pressures were needed to confine many of Pipe cores, and attributed these pressures to ”the weight of the surrounding molecular cloud”. As the surrounding cloud is highly unlikely to be in hydrostatic equilibrium, this ”weight” is most likely to be a dynamic pressure. In particular, as the filament and cores represent a significant mass concentration, gravitational acceleration of external material should provide a confining pressure. A signature of this confining infall should be supersonic line broadening. While the internal non-thermal velocity dispersions of the Pipe cores are subsonic, as detected in dense gas tracers (see also Myers, 1983; André et al., 2007; Kirk et al., 2007, for other regions), Onishi et al. (1999) found supersonic line widths in 13CO, qualitatively what would be expected from gravitationally-accelerated, infalling material which enters the cores and filaments through shocks at the boundaries (Gómez et al., 2007; Gong & Ostriker, 2009). Our goal here is to make this qualitative picture more quantitative.
In this paper we attempt to develop an understanding of the gas flows driven by global gravitational collapse onto a dense filament. We start out with an analytical model to estimate the expected velocities in the collapsing gas (§2). This model is in turn motivated by numerical simulations (§3) of the flow-driven formation of an isolated low-mass cloud. These simulations show that filament formation and global collapse are a natural consequence of the cloud formation process. We compare the analytical and numerical results, and then use them as a guide to interpret recent observations of dense gas filaments in the Pipe Nebula (§4). We find that the typical velocity dispersions resulting from collapse of gas onto the dense filament agree reasonably well with observations of gas at the densities which we probe in the simulation. We also find that the ram pressures in the numerical simulation agree reasonably well with the confining pressures inferred by Lada et al. (2008) for their lower-density cloud cores. Our models imply that the observed non-thermal velocity dispersions are likely due to infall rather than supporting turbulence, and that the lower-mass cores can be gaining mass at significant rates. We conclude that the gravity-driven picture of cloud evolution is in reasonable agreement with the observations of this quiescent molecular cloud region.
2. The infinite cylinder and infall
Before examining the results from the numerical simulations, it is useful to develop estimates from a simple model to serve as a benchmark. Consider a uniform, infinite, self-gravitating filament extended in the direction, with the radial distance in cylindrical coordinates. The critical line density (mass per unit length in the direction), obtained by integrating momentum balance from to is a function only of temperature (Ostriker, 1964);
| (1) |
where is the isothermal sound speed. Assuming a mean molecular weight of ,
| (2) |
where is the gas temperature in (typical molecular cloud) units of 10 K. The filament has a density structure as a function of cylindrical radius of
| (3) |
where the scale height is given by
| (4) |
Here we have assumed that the relation between extinction and molecular hydrogen column density is .
We may also relate the scale height to the central density;
| (5) |
For reference, the half-mass radius is at .
Now consider a parcel of gas in free-fall toward this cylinder, starting from rest at a cylindrical radial distance . The gravitational acceleration is
| (6) |
and thus the infall velocity at is
| (7) |
If we put this in terms of a static filament,
The infall velocity is therefore relatively insensitive to the initial position.
In a realistic situation, infalling material will shock at the filament boundary as it adds mass to the filament. The subsequent velocity dispersion in the post-shock, filamentary gas will be subsonic but non-zero (Gómez et al., 2007; Gong & Ostriker, 2009), with a precise value depending upon the rate of radiative cooling.
This model ignores any global motions which are generally present in finite clouds. Burkert & Hartmann (2004) showed that the collapse of a circular, uniform sheet results in a strong pile-up of material at the infalling edge (”gravitational edge focusing”)111We should point out that this effect has also been noted by Li (2001), who used it to explain clustered star formation, albeit in the context of magnetically dominated finite sheets subject to ambipolar drift.. Interior to this edge, the collapse timescale of a region of extent is relatively independent of radial position , and is approximately
| (9) |
where is the inital radius of the sheet and is the surface density. This is also approximately the time taken for the edge of the sheet to reach the center. Equation (9) implies that the velocity difference across a region is roughly
| (10) |
The relative importance of the global collapse to the filament-induced velocities will then depend upon relative magnitudes of the surface density of the external region and the mass line density of the filament.
3. Numerical results
With the analytical estimates of the flow dynamics around filaments in hand, we apply them now to a less idealized geometry, using a simulation of cloud growth driven by large-scale gas flows. The goal is to test whether the analytical estimate can reproduce the qualitative behavior of gas collapsing onto a dense filament in a more complex environment. We briefly summarize the main properties of the simulation (for further details, see Heitsch et al., 2008b). The simulation models the flow-driven formation of an isolated molecular cloud, including the appropriate heating and cooling processes as well as self-gravity. Two gas flows colliding head-on at a shocked interface lead to compression, strong cooling and rapid fragmentation due to a combination of dynamical and thermal effects. The isolated cloud forming out of this collision is mildly turbulent, and with increasing mass it submits to global gravitational collapse perpendicularly to the inflows. The finite cloud geometry leads to a sweep-up of material due to global gravitational edge focusing (see Burkert & Hartmann, 2004), resulting in the formation of a dense filament at the cloud edge (see Fig. 1 of Heitsch & Hartmann, 2008). As we will show below, the gas infall onto the filament itself is roughly cylindrical. It is the infall of gas onto this filament which we are interested in.
This formation mechanism is able to reproduce some of the salient properties of molecular clouds, namely their internal turbulence, the predominantly filamentary structure of their dense gas, and the observed rapid onset of ”star” formation in the clouds. The setup is rather generic and is physically equivalent to e.g. the collision of two supernova shells, the sweep-up of gas by an expanding shell (e.g., Patel et al., 1998), or gas swept up in spiral arms of galaxies (Elmegreen, 1979, 2007; Kim et al., 2003; Dobbs & Bonnell, 2007).
With a box size of pc and a resolution of cells, our simulation does not have the spatial resolution to directly model the small cores seen in the Pipe, since it does not reach the required densities and temperatures. Yet, we can use it to check the approximate validity of the simplistic model of infall onto a filament described in the previous section under more realistic conditions, including the cloud’s evolution and global gravitational collapse.
To compare the gas infall in our simulation to the physically appropriate tracer, we estimate the 13CO line emission from the model cloud. For this estimate, we make a simple approximation, motivated by the notion that CO formation requires shielding by dust grains (see Heitsch & Hartmann, 2008 for more details). We decide whether CO is “present” in a particular grid cell by determining the attenuation of the ambient radiation field integrated over solid angles. If the effective extinction is equivalent to that of an angle-averaged and the local temperature is K, we assume CO is present in high abundance. Because CO is rapidly dissociated at lower extinctions (van Dishoeck & Black, 1988), we do not advect CO for simplicity. The radiation field at each grid point is calculated by measuring the incident radiation for a given number of rays and averaging over the resulting sky. The ray number is determined such that at a radius corresponding to cells (i.e. half the size of the larger box dimensions), each resolution element of the cartesian model grid is hit by one ray, i.e. . Thus, fine structures and strong density variations are resolved (see also Heitsch et al., 2006a). With the distribution of CO thus determined, we apply a three-dimensional version of the radiative transfer Montecarlo code by Bernes (1979), as implemented by Mardones et al. (in preparation). The code determines the level populations by assuming statistical equilibrium between collisions and radiation. The collision rates are taken from the Leiden Atomic and Molecular Database222http://www.strw.leidenuniv.nl/moldata/. To lower the computational needs, we reduce the resolution of the original data cube by a factor of . After few tens of iterations, the level populations converge, and the line profiles in an arbitrary direction can be obtained.
Figure 1 shows the velocity-integrated emission (grayscale) of the 13CO-map for a model cloud assembled by large-scale colliding flows (model Gf2 of Heitsch et al., 2008b, at Myr). The view is along the inflow () direction, and the frames measure pc across. Overplotted are the spectra for regions with K. Each spectrum covers a velocity range from to . Two features in the line profiles are noteworthy: they are frequently asymetric, and some cases they exhibit more than a single peak.
Table 1 lists the first moments of the line profiles. Column 1 shows the number of the region, as shown in Figure 1, and column 2 shows the intensity in K . Columns 3 & 4 list the centroid velocity and the velocity dispersion, respectively, and finally, in column 5 we report whether the line profile has multiple peaks or not.
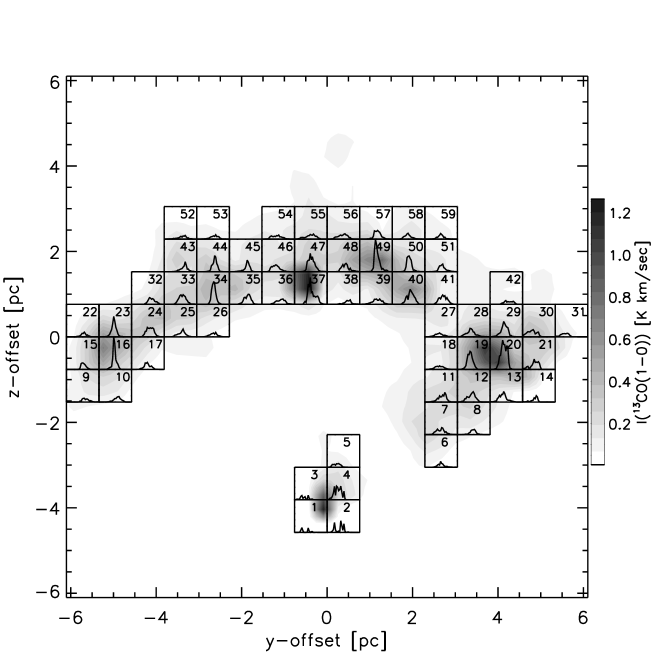
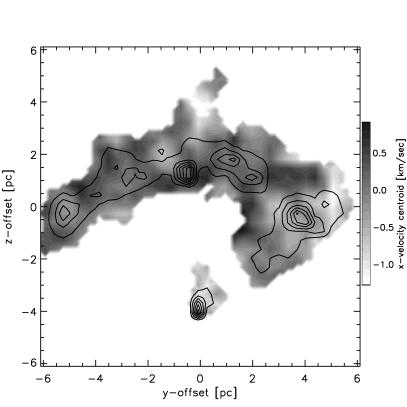
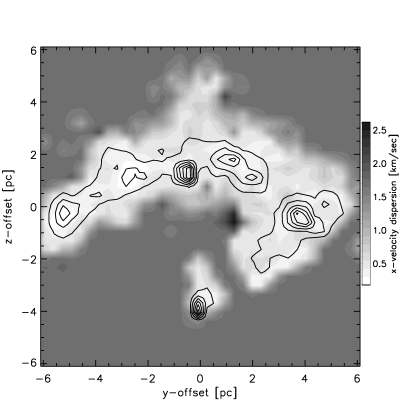
Figure 2 (left) shows the centroid velocity and the velocity dispersion (right), again in the projection. Despite the fact that we view the cloud along the inflow direction, the dense filament is coherent in velocity space (see also centroid velocities in center column of Table 1), except for the largish core on its right end, which is approaching the observer at km s-1. Thus, the velocity dispersion in the dense gas – the core-to-core velocity dispersion – does not contain much information about the velocities of the assembling flows (), in fact, the motions in the (coherent) dense post-shock gas are subsonic.
| number | [K km s-1] | [km s-1] | [km s-1] | mult |
|---|---|---|---|---|
| yes | ||||
| yes | ||||
| yes | ||||
| yes | ||||
| yes | ||||
| no | ||||
| yes | ||||
| no | ||||
| no | ||||
| no | ||||
| yes | ||||
| yes | ||||
| yes | ||||
| no | ||||
| no | ||||
| no | ||||
| yes | ||||
| no | ||||
| no | ||||
| no | ||||
| yes | ||||
| no | ||||
| no | ||||
| no | ||||
| no | ||||
| no | ||||
| no | ||||
| no | ||||
| no | ||||
| yes | ||||
| no | ||||
| no | ||||
| no | ||||
| no | ||||
| yes | ||||
| yes | ||||
| yes | ||||
| no | ||||
| no | ||||
| no | ||||
| no | ||||
| no | ||||
| no | ||||
| no | ||||
| no | ||||
| no | ||||
| no | ||||
| yes | ||||
| no | ||||
| no | ||||
| no | ||||
| no | ||||
| no | ||||
| no | ||||
| no | ||||
| no | ||||
| no | ||||
| no | ||||
| no |
This also can be seen when considering the gas motions perpendicular to the filament and in the plane of the sky, i.e. the infall of more diffuse gas onto the filament (Fig. 3). The velocity profiles were calculated by identifying the filament in the two-dimensional projection (see Fig. 1). Comparing the velocity and the density profiles (top and center panel), it is clear that gas at higher densities should show smaller velocity dispersions: at a distance of pc from the axis of the filament, the infall velocity ranges between and km s-1, i.e from subsonic to slightly supersonic. In other words, the dense filament is essentially a post-shock region (with subsonic internal motions), confined by a dynamical pressure generated by the (supersonic) infall of gas onto the filament. We note that the dense filament is not very well resolved and that thus we decided not to model higher-density tracers showing the subsonic motions more clearly – the line-profiles would not be reliable. Our choice of 13CO probes the immediate vicinity of dense cores, which makes it an appropriate tracer for our purposes.
The formation of subsonic cores in post-shock gas has also been discussed in the context of driven, supersonic turbulence assembling dense cores (Klessen et al., 2005; Ballesteros-Paredes et al., 2007). In that case, density peaks form at locations of maximum compression and of minimum relative velocity difference. In our case (Fig. 3), the inflows are driven by the deepening gravitational potential of the assembling cloud, not relying on externally forced turbulence.
The bottom panel of Figure 3 compares the median value of the pressures as an estimate of what processes dominate the gas dynamics in the environment of the filament. The thick solid line corresponds to the ram pressure obtained with the infall velocity along the -direction (i.e. perpendicular to the filament in Figure 1), while the thin solid line shows the total ram pressure profile. The gravitational pressure is shown by the dot-dashed line, while the thermal pressure is given by the dashed line. Clearly, the region is more dynamical than just indicated by the mean infall velocities: as suggested by this figure, the infall (upper panel) is driven by the gravitational potential (lower panel), while the thermal pressure responds only weakly to the gravitational pressure.

To get a clearer view of the dynamics, we show in Fig. 4 the three projections of the datacube, with the line profiles overplotted, as in Fig. 1. The panel is on the top of the cube, the on the left, and the on the right. These projections reveal that the filament is actually tilted by approximately degrees in the plane, with the left side closer to the observer located at . From the three-dimensonal datacube, we know that the infall velocities in the three directions are of similar magnitude. However, this does not necessarily translates to an infall, double-peaked line profile. Although the three projections exhibit some double-peaked profiles, most of our 13CO lines exhibit only asymmetric, supersonic () profiles. Thus, the supersonic line widths observed in molecular clouds that are usually attributed to random motions (or ”turbulence”), very likely contain a substantial component of ordered motions due to coordinated global collapse. A filament tilted with respect to the line-of-sight – a very likely scenario –, only helps to suppress clear signatures of coordinated infall onto the filament, giving the impression of ”turbulent” motions.
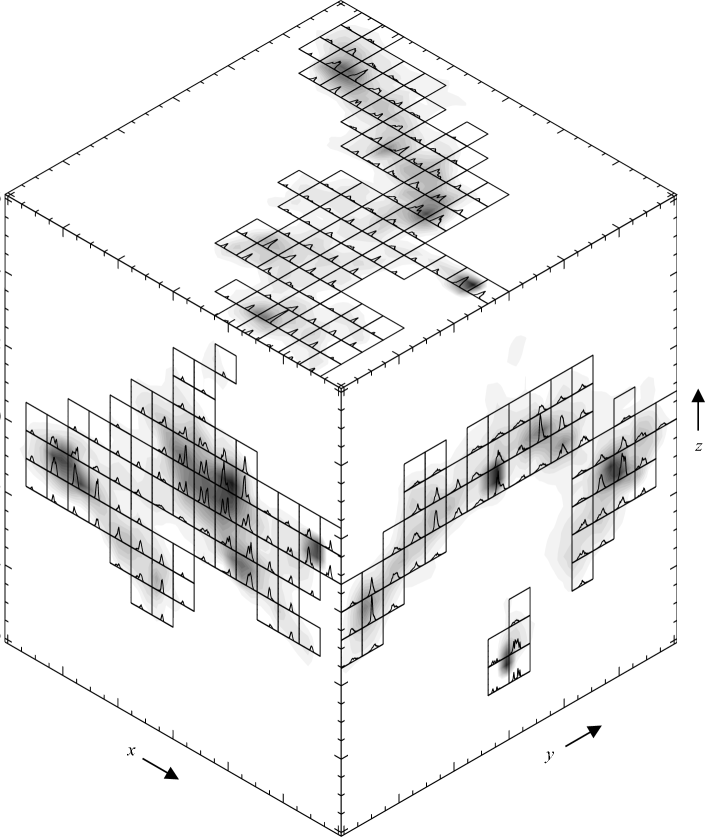
Table 2 summarizes the measured properties of the model filament, as identified in the two-dimensional projection. Since the massive cores potentially could affect the geometry, we show numbers for the full filament (including the cores), and the left half of the filament, which does not contain massive cores.
| [M⊙] | [K] | [pc] | measured | expected | |
|---|---|---|---|---|---|
| full filament | |||||
| without cores |
We note that the filament line density is approximately twice the expected limit for the isothermal case (for the higher temperature of 28 K in the simulation). As mentioned above, the filament is tilted, resulting in a shorter projected length, and thus in a higher line density. Also, other effects such as limited resolution and the possibility that the filament is not static but is still accreting mass on timescales of order Myr, could play a role.
Given that the model filament does not agree with the static approximation, we use equation (7) for the full filament to estimate . What value of to use is not clear, but if we take pc and pc for typical values, , this is about twice the average infall velocity at the filament (Figure 3).
To summarize, Figure 3 demonstrates the overall collapse of the cloud in addition to acceleration onto the filament. Obviously, equation (10) can describe the gas dynamics of the simulated cloud only in a very general way, as (a) matter is being added to the cloud during its collapse from the inflows, (b) the cloud (or filament) cross-section is not exactly circular, and as (c) there are shear components in the flows. Nevertheless, the overall collapse motions are approximately cylindrical (see total ram pressure profile in Fig. 3), indicating that at this stage of the simulation the massive filament dominates the gravitational potential and thus the dynamics of the cloud, and justifying equation (10) as a rough description of the actual dynamics. The total mass of the cloud, including the filament itself, at this epoch is distributed over a region approximately pc, which implies an average surface density of g cm-2 or cm-2. Assuming the initial radius in the -direction was pc, equation (10) then implies a velocity gradient across a region of pc of , which again is in reasonable agreement with the results in Figure 2. Considering the very crude nature of these estimates, agreement with the numerical simulation at the factor of two level is adequate.
4. Comparison with the Pipe Nebula
Motivated by the global, approximately cylindrical infall observed in the simulation (§3) under rather general conditions, we first discuss in this section our analytical estimates (§2) and then the simulation results in the context of the Pipe nebula. We summarize the relevant observational findings first, and then use the approximate agreement between observations and models to interpret the physical conditions of the Pipe nebula in the context of global infall (§5).
The most recent estimate of core properties comes from Rathborne et al. (2009). The core masses range from to about , with radii ranging from to pc and a typical internal density (H2) of . The FWHM of the C18O lines ranges from about 0.4 to about . The estimated visual extinction rises slowly with mass until about , at which point rises rapidly from about to ; this is roughly the mass range which becomes gravitationally bound, according to Lada et al. (2008). Median properties of the cores are , pc, and FWHM . Such a “median” core is typically pressure-confined according to Lada et al. (2008). To simplify the comparison with observations, we assume a typical temperature of 10 K, though there is some evidence that some of the Pipe cores have slightly higher temperatures, K (Rathborne et al., 2007).
To proceed further we need an estimate of the average line density of the filament. The Pipe, though highly elongated, is not a perfectly straight filament nor is it uniform. The sum of the core masses in Rathborne et al. (2009) is ; distributing this mass over a length pc results in an average line density . This estimate neglects the inter-core mass but includes the “bowl” region which is much more complex in structure. If we restrict attention to the portion of the pipe at negative galactic longitudes, the total core mass is over pc or . As the Pipe does not exhibit considerable star formation at the present epoch (Forbrich et al. (2009) estimate a star formation efficiency of % when comparing to the total cloud mass given by Onishi et al., 1999), it seems reasonable to assume an average line density of , to include mass outside the core but not so much that the filament would be radially gravitationally-unstable.
To further fix ideas we take an average filament optical depth to be . This is near the low end of the core extinction values found in Rathborne et al. (2009). Then from equation (4), the scale height is pc; this seems reasonable, seeing that the median core radius given by Rathborne et al. (2009) is about 0.07 pc. We may also then derive a central density from equation (5) of or . This density is a few times smaller than the average core density , but we have not taken any confining pressure into account.
We are now in a position to calculate an estimate of the infall velocity using equation (2). Taking , we find . The timescale for this motion is sensitive to the choice of initial condition, i.e. the initial velocity; for the above solution, the time taken to fall in from to pc is about Myr.
The translation of this infall velocity into a typical velocity dispersion is sensitive to geometry at the factor of two level. Assuming that the filament is oriented perpendicularly to our line of sight, and the emission is simply mass weighted, the average velocity width is . If we identify this with the FWHM or line width, our results are consistent with the median 13CO line width of found by Onishi et al. (1999, see their Fig. 6b). It is larger than that observed in the C18O cores by about a factor of ; however, as pointed out by Lada et al. (2008), the C18O observations sample material both outside and inside the cores. As mentioned in §§2 and 3, cores would be predicted to be the sites of post-shock gas and thus with much smaller internal velocity dispersions. Lada et al. state that, in the lower-mass cores, half or more of the total line-of-sight column density arises from material outside the core (also Gómez et al., 2007; Gong & Ostriker, 2009). Conversely, this means that for many cores, half or less of the emitting material is outside the core. Thus we would predict a core velocity width perhaps half that above, or around , in rough agreement with observations (Muench et al., 2007). In addition, there is no specific reason to assume that the filament is oriented perpendicularly to the line of sight. Any (very likely) tilt of the filament with respect to the line of sight will result in an even smaller projected velocity dispersion.
Going back to the numerical simulations, we note that the velocity dispersion in the flow direction, calculated as the second moment of the line profile (see Fig. 1 and Table 1), are or the order of . This implies that the FWHM, calculated as , is of the order of , a value close to the observed by Onishi et al. (1999) for the Pipe. The discrepancy with the analytic result, however, is probably due in part to the more complex velocity field of the simulation, including the global collapse. In some cases the observed line width is inflated because of the superposition of separate cores along the line of sight, which can be seen in systems with two peaks of emission (see also last column in Table 1). In any case the simulations are in reasonable agreement with the Onishi et al. observations.
While there are other possible mechanisms to generate the observed velocity dispersions in molecular gas (one of them would be MHD turbulence, see e.g. McKee & Zweibel (1995) for a detailed discussion), we point out that in a cloud of many Jeans masses, of non-uniform density and of irregular geometry, it will be impossible to avoid having significant gravitational accelerations locally. These in turn will produce motions on the order of km s-1 (see Fig. 3 and §2), unless there is a special forcing or velocity field that would prevent this. Yet this forcing not only would have to be chosen so cleverly in time and space as to support just the right region that is about to collapse, but it also would have to prevent the collapse while reproducing the supersonic motions in the environment of the filament. Thus while we cannot say that there is no other source for the observed gas motions, we do argue that at least part of these motions are likely to be gravity-driven.
5. Discussion & Conclusions
The results presented in this work support the idea that molecular clouds are in a general state of global collapse, suggested more than 35 years ago by Goldreich & Kwan (1974). Although such global collapse of irregular structures develops internal turbulence at some level, the large linewidths in MCs are caused mainly by the large-scale systematic inward motions in this scenario. Given the irregularities, angular momentum conservation and the high Reynolds numbers, it would actually be outright surprising if the collapse did not generate some ”turbulence”.
Zuckerman & Evans (1974) suggested that such large-scale collapse would result in a star formation rate much higher than observed, mandating some mechanism of cloud support to render star formation inefficient (see McKee, 1999 for a summary). Yet, analytical and numerical studies (e.g., Burkert & Hartmann, 2004; Field et al., 2008; Heitsch et al., 2008b; Heitsch & Hartmann, 2008; Vázquez-Semadeni et al., 2007, 2008, 2009) demonstrate that MCs, while globally collapsing, are highly susceptible to strong fragmentation. While this fragmentation is to some extent a consequence of a combination of thermal and dynamical instabilities during the cloud formation process (Heitsch et al., 2008a), it is mainly due to the fact that the cloud geometry is finite, leading to gravitational edge focusing, i.e. non-linear gravitational accelerations as a function of position (Burkert & Hartmann, 2004). In other words, the existence of non-linear gravitational accelerations as a function of position, leading to a rapid piling up of material as well as local fragmentation, allows local collapse to proceed faster than global collapse. And it is precisely because small, high-density structures are rapidly developing, that the mass involved in the densest regions has to be small, ensuring a small star formation efficiency. In other words, the observed low star formation efficiency seems to be the testimony of the importance of non-linear acceleration at particular places while the global collapse occurs. In this connection it is worth pointing out that the major region of star formation within the Pipe (with 15 YSOs; Covey et al., 2009), the B59 cloud, lies at one end of the filament, which is a preferred locus for gravitational edge focusing (Burkert & Hartmann, 2004).
While there are clearly a number of uncertainties in both the analytical and numerical calculations and in the precise observational quantities, a simple model of gravitational infall toward the filament clearly can account for the observed non-thermal velocity dispersions in the Pipe. The gravity-driven model also does predict small (core-to-core) velocity dispersions consistent with observations (Hartmann, 2002; Walsh et al., 2004, 2007; Kirk et al., 2009). This agreement is possible because the “turbulence” is not being continuously driven by an ad hoc force but is the result of (global) gravitational acceleration. The simulation results also suggest that while gas is falling onto the filament supersonically, the velocity dispersions in the dense post-shock gas are subsonic, consistent with the more detailed treatment of core formation in post-shock gas by Gómez et al. (2007); Gong & Ostriker (2009). Yet the current simulation is not sufficiently resolved to support more detailed statements about the dense cores.
Lada et al. (2008) suggested that the confining pressure for many Pipe cores was the result of the “weight” of the cloud. Here we refine this suggestion by pointing out that a static pressure estimate is not strictly appropriate for a cloud in supersonic motion. The ram pressure that we infer is, however, another aspect of the same physical mechanism - gravitational acceleration. It is also worth noting that, in this interpretation, the non-thermal velocity dispersion in the cores and surrounding regions are dominated by collapse motions and thus do not provide pressure support against gravity (Ballesteros-Paredes et al., 1999b; Ballesteros-Paredes, 2006; Vázquez-Semadeni et al., 2008). Nor does in this picture a driving source for turbulence within molecular clouds appear to be necessary (see also Field et al., 2008; Heitsch & Hartmann, 2008).
The numerical simulations, with an average infall velocity in the -direction of and a density of at the filament, imply ram pressures of order K. Scaling this result from the filament of the simulation to the estimated for the Pipe region from 13CO (Onishi et al., 1999) results in a predicted pressure 3 times larger, or about K. This is in reasonable agreement with the confining pressures for Pipe cores estimated by Lada et al. (2008) of K.
The core mass function (CMF) inferred for the Pipe (Alves et al., 2007; Lada et al., 2008; Rathborne et al., 2009) peaks at a mass well above the typically-estimated peak of the stellar initial mass function (IMF). In the gravity-driven picture, translating the CMF at an instant of time to an IMF is complicated because the model of gravitationally-accelerated infall implies that the filament - and thus the cores - are accreting mass (see Clark et al., 2007 for a related argument). If we set the ram pressure of infall equal to confining pressure inferred by Lada et al. (2008), and use from the analytic model, the implied density of infalling material or . The mass accumulation rate over a cylindrical region of radius pc and length pc is then . While this estimate is obviously sensitive to the adopted parameters, it is clear that the lower-mass cores can quite plausibly double their mass over timescales of less than 1 Myr (see also Gómez et al., 2007; Gong & Ostriker, 2009). In fact, observations of starless cores are starting to indicate that quiescent, coherent dense starless cores do accrete actively (e.g., Schnee et al., 2007). Alternatively, the numerical simulation shows a doubling of mass in cores over a timescale of 1 Myr (Heitsch & Hartmann, 2008), consistent with this estimate.
The long-range nature of gravity makes it very difficult to avoid the generation of supersonic velocity fields and the production of filaments and other dense structures in clouds with many Jeans masses (Burkert & Hartmann, 2004; Bate et al., 2002, 2003; Vázquez-Semadeni et al., 2007; Heitsch et al., 2008b; Smith et al., 2009).
The mass, spatial extent, and typical column densities of the Pipe are not very different from those of the Taurus molecular cloud. It is conceivable that the Pipe is representative of how Taurus would have appeared 1 - 2 Myr ago. The average filament line density in Taurus is estimated to be roughly twice the critical value (Hartmann, 2002), which is consistent with the active star formation in the region. Blindly applying the mass infall rate calculated above to Taurus would imply a buildup from to the observed on a timescale of 1 Myr.
Finally, one may consider the future evolution of the Pipe nebula with regards to the star formation efficiency. While we have shown that besides the gas dynamics, the gravity-driven model can naturally explain the origin of the strong fragmentation as a key ingredient for the observed low star formation efficiency, we have not discussed how the remaining molecular gas can be prevented from eventually collapsing onto the dense filament. In low-mass star-forming regions this could be achieved by e.g. magnetic support of the diffuse molecular gas (Heyer et al., 2008; Price & Bate, 2009), or by Galactic tidal disruption (Ballesteros-Paredes et al., 2009a, b).
References
- Alves et al. (2007) Alves, J., Lombardi, M., & Lada, C. J. 2007, A&A, 462, L17
- André et al. (2007) André, P., Belloche, A., Motte, F., & Peretto, N. 2007, A&A, 472, 519
- Audit & Hennebelle (2005) Audit, E. & Hennebelle, P. 2005, A&A, 433, 1
- Ballesteros-Paredes (2006) Ballesteros-Paredes, J. 2006, MNRAS, 372, 443
- Ballesteros-Paredes et al. (2009a) Ballesteros-Paredes, J., Gómez, G. C., Loinard, L., Torres, R. M., & Pichardo, B. 2009a, MNRAS, 395, L81
- Ballesteros-Paredes et al. (2009b) Ballesteros-Paredes, J., Gómez, G. C., Pichardo, B., & Vázquez-Semadeni, E. 2009b, MNRAS, 393, 1563
- Ballesteros-Paredes et al. (1999a) Ballesteros-Paredes, J., Hartmann, L., & Vázquez-Semadeni, E. 1999a, ApJ, 527, 285
- Ballesteros-Paredes et al. (2007) Ballesteros-Paredes, J., Klessen, R. S., Mac Low, M.-M., & Vazquez-Semadeni, E. 2007, in Protostars and Planets V, ed. B. Reipurth, D. Jewitt, & K. Keil, 63–80
- Ballesteros-Paredes et al. (1999b) Ballesteros-Paredes, J., Vázquez-Semadeni, E., & Scalo, J. 1999b, ApJ, 515, 286
- Bate et al. (2002) Bate, M. R., Bonnell, I. A., & Bromm, V. 2002, MNRAS, 332, L65
- Bate et al. (2003) —. 2003, MNRAS, 339, 577
- Bernes (1979) Bernes, C. 1979, A&A, 73, 67
- Burkert & Hartmann (2004) Burkert, A. & Hartmann, L. 2004, ApJ, 616, 288
- Clark et al. (2007) Clark, P. C., Klessen, R. S., & Bonnell, I. A. 2007, MNRAS, 379, 57
- Covey et al. (2009) Covey, K. R., Lada, C., Muench, A., & Román-Zúñiga, C. 2009, in Bulletin of the American Astronomical Society, Vol. 41, Bulletin of the American Astronomical Society, 399
- Dobbs & Bonnell (2007) Dobbs, C. L. & Bonnell, I. A. 2007, MNRAS, 376, 1747
- Elmegreen (1979) Elmegreen, B. G. 1979, ApJ, 231, 372
- Elmegreen (2007) —. 2007, ApJ, 668, 1064
- Field et al. (2008) Field, G. B., Blackman, E. G., & Keto, E. R. 2008, MNRAS, 385, 181
- Forbrich et al. (2009) Forbrich, J., Lada, C. J., Muench, A. A., Alves, J., & Lombardi, M. 2009, ArXiv e-prints, 0908.4086
- Goldreich & Kwan (1974) Goldreich, P. & Kwan, J. 1974, ApJ, 189, 441
- Gómez et al. (2007) Gómez, G. C., Vázquez-Semadeni, E., Shadmehri, M., & Ballesteros-Paredes, J. 2007, ApJ, 669, 1042
- Gong & Ostriker (2009) Gong, H. & Ostriker, E. C. 2009, ApJ, 699, 230
- Hartmann (2002) Hartmann, L. 2002, ApJ, 578, 914
- Hartmann et al. (2001) Hartmann, L., Ballesteros-Paredes, J., & Bergin, E. A. 2001, ApJ, 562, 852
- Hartmann & Burkert (2007) Hartmann, L. & Burkert, A. 2007, ApJ, 654, 988
- Heitsch & Hartmann (2008) Heitsch, F. & Hartmann, L. 2008, ApJ, 689, 290
- Heitsch et al. (2008a) Heitsch, F., Hartmann, L. W., & Burkert, A. 2008a, ApJ, 683, 786
- Heitsch et al. (2008b) Heitsch, F., Hartmann, L. W., Slyz, A. D., Devriendt, J. E. G., & Burkert, A. 2008b, ApJ, 674, 316
- Heitsch et al. (2006a) Heitsch, F., Slyz, A. D., Devriendt, J. E. G., & Burkert, A. 2006a, MNRAS, 373, 1379
- Heitsch et al. (2006b) Heitsch, F., Slyz, A. D., Devriendt, J. E. G., Hartmann, L. W., & Burkert, A. 2006b, ApJ, 648, 1052
- Hennebelle et al. (2008) Hennebelle, P., Banerjee, R., Vázquez-Semadeni, E., Klessen, R. S., & Audit, E. 2008, A&A, 486, L43
- Heyer et al. (2008) Heyer, M., Gong, H., Ostriker, E., & Brunt, C. 2008, ApJ, 680, 420
- Kim et al. (2003) Kim, W.-T., Ostriker, E. C., & Stone, J. M. 2003, ApJ, 599, 1157
- Kirk et al. (2009) Kirk, H., Johnstone, D., & Basu, S. 2009, ArXiv e-prints
- Kirk et al. (2007) Kirk, H., Johnstone, D., & Tafalla, M. 2007, ApJ, 668, 1042
- Klessen et al. (2005) Klessen, R. S., Ballesteros-Paredes, J., Vázquez-Semadeni, E., & Durán-Rojas, C. 2005, ApJ, 620, 786
- Koyama & Inutsuka (2002) Koyama, H. & Inutsuka, S.-i. 2002, ApJ, 564, L97
- Lada et al. (2008) Lada, C. J., Muench, A. A., Rathborne, J., Alves, J. F., & Lombardi, M. 2008, ApJ, 672, 410
- Li (2001) Li, Z.-Y. 2001, ApJ, 556, 813
- Lombardi et al. (2006) Lombardi, M., Alves, J., & Lada, C. J. 2006, A&A, 454, 781
- Mac Low et al. (1998) Mac Low, M.-M., Klessen, R. S., Burkert, A., & Smith, M. D. 1998, Physical Review Letters, 80, 2754
- McKee (1999) McKee, C. F. 1999, in NATO ASIC Proc. 540: The Origin of Stars and Planetary Systems, ed. C. J. Lada & N. D. Kylafis, 29
- McKee & Zweibel (1995) McKee, C. F. & Zweibel, E. G. 1995, ApJ, 440, 686
- Muench et al. (2007) Muench, A. A., Lada, C. J., Rathborne, J. M., Alves, J. F., & Lombardi, M. 2007, ApJ, 671, 1820
- Myers (1983) Myers, P. C. 1983, ApJ, 270, 105
- Onishi et al. (1999) Onishi, T., Kawamura, A., Abe, R., Yamaguchi, N., Saito, H., Moriguchi, Y., Mizuno, A., Ogawa, H., & Fukui, Y. 1999, PASJ, 51, 871
- Ostriker (1964) Ostriker, J. 1964, ApJ, 140, 1056
- Padoan & Nordlund (1999) Padoan, P. & Nordlund, Å. 1999, ApJ, 526, 279
- Patel et al. (1998) Patel, N. A., Goldsmith, P. F., Heyer, M. H., Snell, R. L., & Pratap, P. 1998, ApJ, 507, 241
- Price & Bate (2009) Price, D. J. & Bate, M. R. 2009, ArXiv e-prints
- Rathborne et al. (2009) Rathborne, J. M., Lada, C. J., Muench, A. A., Alves, J. F., Kainulainen, J., & Lombardi, M. 2009, ArXiv e-prints
- Rathborne et al. (2007) Rathborne, J. M., Simon, R., & Jackson, J. M. 2007, ApJ, 662, 1082
- Schnee et al. (2007) Schnee, S., Caselli, P., Goodman, A., Arce, H. G., Ballesteros-Paredes, J., & Kuchibhotla, K. 2007, ApJ, 671, 1839
- Schneider & Elmegreen (1979) Schneider, S. & Elmegreen, B. G. 1979, ApJS, 41, 87
- Smith et al. (2009) Smith, R. J., Clark, P. C., & Bonnell, I. A. 2009, MNRAS, 667
- Stone et al. (1998) Stone, J. M., Ostriker, E. C., & Gammie, C. F. 1998, ApJ, 508, L99
- Tobin et al. (2009) Tobin, J. J., Hartmann, L., Furesz, G., Mateo, M., & Megeath, S. T. 2009, ApJ, 697, 1103
- van Dishoeck & Black (1988) van Dishoeck, E. F. & Black, J. H. 1988, ApJ, 334, 771
- Vázquez-Semadeni et al. (2007) Vázquez-Semadeni, E., Gómez, G. C., Jappsen, A. K., Ballesteros-Paredes, J., González, R. F., & Klessen, R. S. 2007, ApJ, 657, 870
- Vázquez-Semadeni et al. (2009) Vázquez-Semadeni, E., Gómez, G. C., Jappsen, A. K., Ballesteros-Paredes, J., & Klessen, R. S. 2009, ArXiv e-prints
- Vázquez-Semadeni et al. (2008) Vázquez-Semadeni, E., González, R. F., Ballesteros-Paredes, J., Gazol, A., & Kim, J. 2008, MNRAS, 390, 769
- Walsh et al. (2004) Walsh, A. J., Myers, P. C., & Burton, M. G. 2004, ApJ, 614, 194
- Walsh et al. (2007) Walsh, A. J., Myers, P. C., Di Francesco, J., Mohanty, S., Bourke, T. L., Gutermuth, R., & Wilner, D. 2007, ApJ, 655, 958
- Zuckerman & Evans (1974) Zuckerman, B. & Evans, II, N. J. 1974, ApJ, 192, L149