M. Ablikim1, J. Z. Bai1, Y. Bai1,
Y. Ban11,
X. Cai1, H. F. Chen16,
H. S. Chen1, H. X. Chen1, J. C. Chen1,
Jin Chen1, X. D. Chen5,
Y. B. Chen1, Y. P. Chu1,
Y. S. Dai18, Z. Y. Deng1,
S. X. Du1a, J. Fang1,
C. D. Fu1, C. S. Gao1,
Y. N. Gao14, S. D. Gu1, Y. T. Gu4,
Y. N. Guo1, Z. J. Guo15b, F. A. Harris15,
K. L. He1, M. He12, Y. K. Heng1,
H. M. Hu1,
T. Hu1, G. S. Huang1c, X. T. Huang12,
Y. P. Huang1, X. B. Ji1, X. S. Jiang1,
J. B. Jiao12, D. P. Jin1,
S. Jin1, G. Li1,
H. B. Li1, J. Li1, L. Li1, R. Y. Li1,
W. D. Li1, W. G. Li1,
X. L. Li1, X. N. Li1, X. Q. Li10,
Y. F. Liang13, B. J. Liu1d,
C. X. Liu1, Fang Liu1, Feng Liu6,
H. M. Liu1,
J. P. Liu17, H. B. Liu4e,
J. Liu1,
Q. Liu15, R. G. Liu1, S. Liu8,
Z. A. Liu1,
F. Lu1, G. R. Lu5, J. G. Lu1,
C. L. Luo9, F. C. Ma8, H. L. Ma2,
Q. M. Ma1,
M. Q. A. Malik1,
Z. P. Mao1,
X. H. Mo1, J. Nie1, S. L. Olsen15,
R. G. Ping1, N. D. Qi1,
J. F. Qiu1, G. Rong1,
X. D. Ruan4, L. Y. Shan1, L. Shang1,
C. P. Shen15, X. Y. Shen1,
H. Y. Sheng1, H. S. Sun1, S. S. Sun1,
Y. Z. Sun1, Z. J. Sun1, X. Tang1,
J. P. Tian14,
G. L. Tong1, G. S. Varner15, X. Wan1,
L. Wang1, L. L. Wang1, L. S. Wang1,
P. Wang1, P. L. Wang1,
Y. F. Wang1, Z. Wang1, Z. Y. Wang1,
C. L. Wei1, D. H. Wei3,
N. Wu1, X. M. Xia1,
G. F. Xu1, X. P. Xu6,
Y. Xu10, M. L. Yan16, H. X. Yang1,
M. Yang1,
Y. X. Yang3, M. H. Ye2, Y. X. Ye16,
C. X. Yu10,
C. Z. Yuan1, Y. Yuan1,
Y. Zeng7, B. X. Zhang1,
B. Y. Zhang1, C. C. Zhang1,
D. H. Zhang1, H. Q. Zhang1,
H. Y. Zhang1, J. W. Zhang1,
J. Y. Zhang1,
X. Y. Zhang12, Y. Y. Zhang13,
Z. X. Zhang11, Z. P. Zhang16, D. X. Zhao1,
J. W. Zhao1, M. G. Zhao1, P. P. Zhao1,
Z. G. Zhao16, B. Zheng1, H. Q. Zheng11,
J. P. Zheng1, Z. P. Zheng1, B. Zhong9
L. Zhou1,
K. J. Zhu1, Q. M. Zhu1,
X. W. Zhu1,
Y. S. Zhu1, Z. A. Zhu1, Z. L. Zhu3,
B. A. Zhuang1,
B. S. Zou1
(BES Collaboration)
1 Institute of High Energy Physics, Beijing 100049, People’s Republic of China
2 China Center for Advanced Science and Technology(CCAST), Beijing 100080,
People’s Republic of China
3 Guangxi Normal University, Guilin 541004, People’s Republic of China
4 Guangxi University, Nanning 530004, People’s Republic of China
5 Henan Normal University, Xinxiang 453002, People’s Republic of China
6 Huazhong Normal University, Wuhan 430079, People’s Republic of China
7 Hunan University, Changsha 410082, People’s Republic of China
8 Liaoning University, Shenyang 110036, People’s Republic of China
9 Nanjing Normal University, Nanjing 210097, People’s Republic of China
10 Nankai University, Tianjin 300071, People’s Republic of China
11 Peking University, Beijing 100871, People’s Republic of China
12 Shandong University, Jinan 250100, People’s Republic of China
13 Sichuan University, Chengdu 610064, People’s Republic of China
14 Tsinghua University, Beijing 100084, People’s Republic of China
15 University of Hawaii, Honolulu, HI 96822, USA
16 University of Science and Technology of China, Hefei 230026,
People’s Republic of China
17 Wuhan University, Wuhan 430072, People’s Republic of China
18 Zhejiang University, Hangzhou 310028, People’s Republic of China
a Current address: Zhengzhou University, Zhengzhou 450001, People’s
Republic of China
b Current address: Johns Hopkins University, Baltimore, MD 21218, USA
c Current address: University of Oklahoma, Norman, Oklahoma 73019, USA
d Current address: University of Hong Kong, Pok Fu Lam Road, Hong
Kong
e Current address: Graduate University of Chinese Academy of Sciences,
Beijing 100049, People’s Republic of China
Abstract
We report the first observation of decay in a sample of 58 million
events collected with the BESII detector. The branching fraction is
determined to be . The
selected signal event sample is further used to search for the
resonance through . No evidence of a signal is seen.
An upper limit of is set at the 90% confidence level.
1 Introduction
Following the observation of by the BaBar Collaboration in
via initial-state
radiation [1], the resonance was observed by the BES
Collaboration in [2] and more recently by the Belle Collaboration in
[3].
Since both the and [4] are observed
in annihilation via initial-state radiation and these two
resonances have similar decay modes, it was speculated that may
be an -quark version of [1]. There have
been a number of different interpretations proposed for the ,
that include a hybrid [5] [6] [7], a
state [8], a tetraquark state
[9], or a baryonium [10]. Likewise has
been correspondingly interpreted as: a hybrid
[11], a state [12], or a
tetraquark state [13]. None of these
interpretations has either been established or ruled out by
experimental observations.
According to Ref. [12], a hybrid state may have very
different decay patterns compared to a quarkonium
state. Measuring the branching fractions of some decay modes may shed
light on understanding the nature of . Among those promising
decay modes, is of special
importance. This decay mode is forbidden if is a hybrid state but
allowed if it is a quarkonium state.
On the other hand, there are still lots of unknown decay modes of and investigating more of them is useful to understand the mechanism
of decays. Based on a sample of 58M events collected by the BESII
detector at the Beijing Electron-Positron Collider (BEPC), a search
for the process is performed. In addition, the first
measurement of the branching fraction Br() is obtained.
2 Detector and data samples
The upgraded Beijing Spectrometer detector (BESII) was located at
the Beijing Electron-Positron Collider (BEPC). BESII was a large
solid-angle magnetic spectrometer which is described in detail in
Ref. [14]. The momentum of charged particles is
determined by a 40-layer cylindrical main drift chamber (MDC)
which has a momentum resolution of
/p= ( in GeV/c). Particle
identification is accomplished using specific ionization ()
measurements in the drift chamber and time-of-flight (TOF)
information in a barrel-like array of 48 scintillation counters.
The resolution is ; the TOF
resolution for Bhabha events is ps. Radially
outside of the time-of-flight counters is a 12-radiation-length
barrel shower counter (BSC) comprised of gas tubes interleaved
with lead sheets. The BSC measures the energy and direction of
photons with resolutions of (
in GeV), mrad, and cm. The
iron flux return of the magnet is instrumented with three double
layers of proportional counters that are used to identify muons.
A GEANT3 based Monte Carlo (MC) package (SIMBES) [15] with
detailed consideration of real detector performance (such as dead
electronic channels) is used. The consistency between data and Monte
Carlo has been carefully checked in many high purity physics channels,
and the agreement is quite reasonable [15].
3 Analysis
The decay channel under investigation,
, has two
charged kaons, two charged pions, and two photons in its final state.
A candidate event is therefore required to have four good charged
tracks reconstructed in the MDC with net charge zero and at least two
isolated photons in the BSC. A good charged track is required to (1)
be well fitted to a three dimensional helix in order to ensure a
correct error matrix in the kinematic fit; (2) originate from the
interaction region, i.e. the point of closest approach of the track
to the beam axis is within 2 cm of the beam axis and within 20 cm from
the center of the interaction region along the beam line; (3) have a
polar angle , within the range ; and (4)
have a transverse momentum greater than 70 MeV/. The TOF and
information is combined to form a particle
identification confidence level for the , , and
hypotheses, and the particle type with the highest confidence level is
assigned to each track. The four charged tracks selected are further
required to be consistent with an unambiguously identified combination. An isolated neutral cluster
is considered as a good photon when (1) the energy deposited in
the BSC is greater than 60 MeV, (2) the angle between the nearest
charged track and the cluster is greater than , (3) the
angle between the cluster development direction in the BSC and the
photon emission direction is less than , and (4) at least
two layers have deposits in the BSC and the first hit is in the
beginning six layers. A four-constraint (4-C) kinematic fit is
performed to the hypothesis , and if there are more than two good photons,
the combination with the smallest value is selected. We further require that
. Because we are not
interest in the events of which the two photons come from , we
require the invariant mass of two photons to be greater than GeV/.
3.1 Branching fraction of
After applying the above event selection criteria,
Fig. 1 shows the scatter plot of versus
. One can see , ,
, and events scattered in
different regions of the plot. The signal region in this analysis is
defined by
GeV/, which is shown as the middle box in
Fig. 1. Other boxes shown are side-band regions, and
events in these regions are used to estimate the background in the
signal region. The invariant mass spectra are shown in
Fig. 1, where the solid histogram is
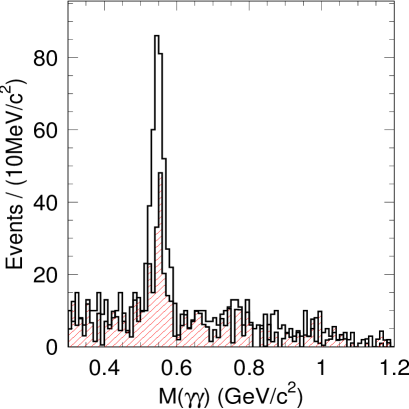
and the dashed histogram is . Figure 2
shows the invariant mass spectrum for events in the signal
region, where an is seen. In Fig. 2, the
shaded histogram is the spectrum obtained requiring two good photons,
while the dashed histogram is the spectrum for more than two
photons. When there are more than two photons, the ratio of signal
over background is much lower. In order to remove potential
backgrounds as much as possible, we also require the number of good
photons to be two.
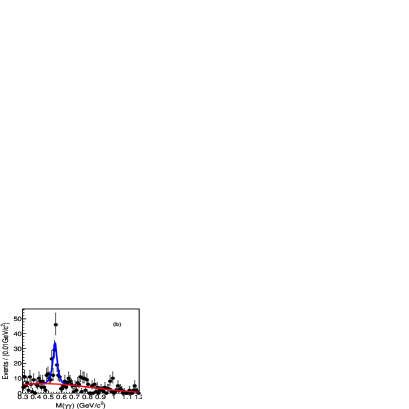
Figure 2 shows the
invariant mass spectrum of events surviving the above selection, while
the shaded histogram is the normalized background estimated using the
side-band regions shown in Fig. 1. The number of
events is determined by
fitting the spectra in Fig. 2. The
branching fraction
is determined using
,
where is the number of events in the signal region,
obtained by fitting the spectrum in Fig. 2 (the blank
histogram); is the number of background events estimated from
side-band regions, obtained by fitting the spectrum in
Fig. 2 (the shaded histogram); is the
total number of events [17]; is the
detection efficiency obtained from MC simulation of
; and , and
are the corresponding branching
fractions. Figures 3 and 3 show
respectively the fitting results of the signal and side-band events,
where the shape of the invariant mass spectrum obtained
from the MC sample is used
as the signal shape and a third order Chebyshev polynomial is used as
the background shape. The branching
fraction is determined to be
where the error is statistical only. It is the first measurement for this decay mode of and it is shown that this mode is a typical three bodies decay. The branching fraction is compatible
with the result of given by
BaBar Collaboration [16].
It is worth mention of that this branching fraction is several times smaller
than the radiative decay mode which is very different from
the situation of that the branching fraction of is much bigger than
.
Figure 1: (a) Scatter plot of versus
invariant mass, where the middle box is the signal
region and the other boxes are the side-band regions. (b) The
invariant mass spectra of ; the solid histogram is
and the dashed is .
3.2
Next, we search for a possible resonance recoiling against
. So in addition to the above requirements, we require that
the invariant mass satisfies
GeV/ and define the
side-band region to be 0.1 GeV/
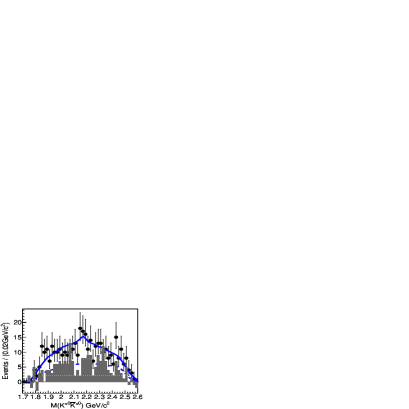
GeV/. The invariant mass spectrum recoiling
against for
is
shown in Fig. 4, where the dashed histogram is the
contribution from phase space for
and the shaded histogram is
the contribution from the normalized side-band events in the ,
and side-band
regions. There is
no obvious enhancement in the region around 2.175 GeV/.
The backgrounds in the selected event sample are studied with MC
simulations. For the decay ,
the possible main background channels are:
; ;
; ;
; for
each channel a sizable MC sample is simulated. There is no peak around
2.175 GeV/ in the invariant mass distribution in any
background channel.
We fit the mass distribution to determine a possible signal, where
three parts are included in the total probability distribution
function (p.d.f): (1) for the signal p.d.f, we use the shape of the
invariant mass spectrum obtained from MC simulation of
produced
with the mass and width of fixed to BaBar’s results; (2) for
the normalized phase space contribution p.d.f., we use the shape of
the invariant mass distribution obtained in the
MC simulation, normalized with
the branching ratio obtained in the previous section; (3) for the
other possible backgrounds, we use a third order Chebyshev polynomial.
The product branching ratio is determined using
where is the number of signal
events, is the total number of events
[17], is the detection efficiency obtained
from MC simulation of
, where the
first step decay used an angular distribution ,
is the polar angle of the momentum in the center of
mass frame, and
and
are the corresponding branching
fractions. The error is only the statistical error. The signal
significance is only .
The upper limit of
at the 90% confidence level is obtained using a Bayesian
approach [18].
We obtain the upper limit:
where is upper limit at the 90% confidence level,
is the systematic error discussed below, and the other
symbols are defined as above.
Figure 2: (a) The invariant mass spectrum for data; the
dashed histogram is from the events, the shaded
histogram is from the events, and the blank histogram
is from all events. (b) The invariant mass spectrum for
, where the blank histogram is from signal region
events, and the shaded one is from the side-band regions events.
Figure 3: Unbinned fitting results of invariant mass spectra: (a) for the signal region events; (b) for the
side-band region events,
where the signal shape is obtained from the MC invariant
mass distribution and the background shape is a third order Chebyshev polynomial.
Figure 4: The invariant mass spectrum, where points with
error bars are candidate events, the
dashed histogram is from MC phase space for
, the shaded histogram is from
side-band events, and the solid curve is the fitting result, where
the Y(2175) shape used is from MC simulation.
4 Systematic Errors
In this analysis, the systematic errors on the branching fraction and
upper limit mainly come from the following sources:
4.1 MDC Tracking efficiency and kinematic fitting
The systematic errors from MDC tracking and kinematic fitting are
estimated by using simulations with different MDC wire resolutions
[15]. In this analysis, the systematic errors from this
source are 12.8% for and
12.0% for
.
4.2 Photon detection efficiency
The photon detection efficiency is studied in reference [15].
The results indicate that the systematic error is less than 1% for
each photon. Two good photons are required in this analysis, so 2% is
taken as the systematic error for the photon detection efficiency.
4.3 Particle identification (PID)
In references [15] and [19], the efficiencies of pion
and kaon identification are analyzed. The systematic error from PID
is about 1% for each charged track. In this analysis, four charged
tracks are required, so 4% is taken as the systematic error from
PID.
4.4 Uncertainty of intermediate decay
The branching fraction uncertainties for and from
PDG08 [18] are taken as systematic errors.
4.5 Number of events
The number of events is ,
determined from the number of inclusive 4-prong
hadrons [17]. The uncertainty 4.72% is taken as a
systematic error.
4.6 Fitting
4.6.1 branching fraction
When fitting the invariant mass spectrum, as described
in section III.A, the signal shape obtained from MC is fixed,
and different order polynomials are used for the background shape. The
difference is taken as the systematic error for the background
uncertainty. We also use different
regions in fitting the invariant mass spectrum. The total systematic
error from fitting is 6.7%.
4.6.2 upper limit
When fitting the invariant mass spectrum of , as
described in section III.B, there are three sources of systematic
error: for the first p.d.f, we used the different resonance parameters
measured by BaBar and BES, and take the difference as the systematic
error from the uncertainty of signal parameters; for the second, the
systematic error comes from the error of the branching fraction of
measured in section III.A; for
the third, we used the difference between fitting with a third order
Chebyshev polynomial and fitting with the invariant mass shape from
side-band events as the systematic error for the
background uncertainty. Combining these contributions,
16.3% is obtained as the systematic error from fitting.
4.7 Different selection of side-band regions
We used different side-band regions to estimate the backgrounds both
in section III.A and III.B, and take the difference as a source of
systematic error. The result is 10.0% for the measurement of
branching fraction and 4.2% for the upper limit.
4.8 Number of photons
To estimate the systematic error from the requirement of two good
photons, we compare the efficiency difference for this requirement
between data and MC sample, and obtain 4.4%, which is taken as the
systematic error from the two photon requirement.
4.9 simulation
The is simulated with a P-wave relativistic Breit-Wigner
function
,
with the width
,
where r is the interaction radius and the value
measured by a scattering
experiment [20] is used. Varying the value of r by
, the difference of the detection efficiencies for
,
is taken
as the systematic error from the uncertainty of the r value.
The systematic errors from the different sources and the total
systematic errors are shown in Table I.
Table 1: Systematic errors (%)
Error sources
Br()
Upper limit
MDC tracking efficiency and 4-C fitting
12.8
12.0
Photon detection efficiency
2
2
PID
4
4
Intermediate decay
Number of events
4.7
4.7
Fitting
6.7
16.3
Side-band region
10.0
4.2
Photon number
4.4
4.4
simulation
3.5
2.6
Total systematic error
19.5
22.3
5 Summary
With 58M BESII events, the branching fraction of
is measured for the first time:
No obvious enhancement near 2.175 GeV/ in the invariant mass
spectrum of is observed. The upper limit on
at the 90% C.L. is . Due to the
limited statistics, we can not distinguish whether the is a
hybrid or quarkonium state.
The BES collaboration thanks the staff of BEPC and computing
center for their hard efforts. This work is supported in part by
the National Natural Science Foundation of China under contracts
Nos. 10491300, 10225524, 10225525, 10425523, 10625524, 10521003, 10821063,
10825524, the Chinese Academy of Sciences under contract No. KJ 95T-03, the
100 Talents Program of CAS under Contract Nos. U-11, U-24, U-25,
and the Knowledge Innovation Project of CAS under Contract Nos.
U-602, U-34 (IHEP), the National Natural Science Foundation of
China under Contract No. 10225522 (Tsinghua University), and the
Department of Energy under Contract No. DE-FG02-04ER41291 (U.
Hawaii).
References
[1] BABAR Collaboration, B.Aubert et al., Phys. Rev. D 74, 091103(R) (2006).
[2] BES Collaboration, M.Ablikim et al., Phys. Rev. Lett. 100, 102003 (2008).
[3] BELLE Collaboration,
C. P. Shen et al., Phys. Rev. D 80, 031101(R) (2009).
[4] BABAR Collaboration, B.Aubert et al., Phys. Rev. Lett. 95, 142001 (2005).
[5] S.L. Zhu, Phys. Lett. B 625, 212 (2005).
[6] F.E. Close and P.R. Page, Phys. Lett. B 628, 215 (2005).
[7] E. Kou and O. Pene, Phys. Lett. B 631, 164 (2005).
[8] F.J. Llanes-Estrada, Phys. Rev. D 72, 031503 (2005).
[9] L. Maiani, V. Riquer, F. Piccinini and A.D. Polosa, Phys. Rev. D 72, 031502 (2005).
[10] C. F. Qiao, Phys. Lett. B 639 263 (2006).
[11] Gui-Jun Ding & Mu-lin Yan, Phys. Lett. B 650, 390-400 (2007).
[12] Gui-Jun Ding & Mu-lin Yan, Phys. Lett. B 657, 49-54 (2007).
[13] Zhi-Gang Wang, Nucl. Phys. A 791, 106-116 (2007).
[14] BES Collaboration, J. Z. Bai et al., Nucl. Instrum. Meth. A 458, 627 (2001).
[15] BES Collaboration, M. Ablikim et al., Nucl. Instrum. Meth. A 552, 344 (2005).
[16] BABAR Collaboration, B.Aubert et al., Phys. Rev. D 76, 092005 (2007).
[17] FANG Shuangshi et al., HEP&NP, 2003, 27(4): 277-281.
[18] C. Amsler et al., Phys. Lett. B 667, 1 (2008)
[19] BES Collaboration, M. Ablikim et al., Phys. Rev. Lett. 97 142002 (2006).
[20] D. Aston et al., Nucl. Phys. B 296, 493 (1988).