Dissecting an intermediate-mass (IM) protostar
Abstract
Aims. Our aim is to unveil the physical conditions and structure of the intermediate mass (IM) protostar IRAS 21391+5802 (IC 1396 N) at scales of 1000 AU.
Methods. We have carried out high-angular resolution (14) observations in the continuum at 3.1mm and in the N2H+ 10, CH3CN 5k4k and 13CS 21 lines using the Plateau de Bure Interferometer (PdBI). In addition, we have merged the PdBI images with previous BIMA (continuum data at 1.2mm and 3.1mm) and single-dish (N2H+ 10) data to have a comprehensive description of the region.
Results. The combination of our data with BIMA and 30m data show that the bipolar outflow associated has completely eroded the initial molecular globule. The 1.2mm and 3.1mm continuum emissions are extended along the outflow axis tracing the warm walls of the biconical cavity. Most of the molecular gas, however, is located in an elongated feature in the direction perpendicular to the outflow. A strong chemical differentiation is detected across the molecular toroid, with the N2H+ 10 emission absent in the inner region.
Conclusions. Our PdBI data show two different regions in IC1396 N: (i) the young stellar objects (YSO) BIMA 3 and the protocluster BIMA 2, detected in dust continuum emission and one of the individual cores, IRAM 2A, in the CH3CN 5k4k line, and (ii) the clumps and filaments that have only been detected in the N2H+ 10 line. The clumps belonging to this second group are located in the molecular toroid perpendicular to the outflow, mainly along the walls of the biconical cavity. This chemical differentiation can be understood in terms of the different gas kinetic temperature. The [CH3CN]/[N2H+] ratio increases by 5 orders of magnitude with gas temperature, for temperatures between 20 K and 100 K. The CH3CN abundance towards IRAM 2A is similar to that found in hot corinos and lower than that expected towards IM and high mass hot cores. This could indicate that IRAM 2A is a low mass or at most Herbig Ae star (IRAM 2A) instead of the precursor of a massive Be star. Alternatively, the low CH3CN abundance could also be the consequence of IRAM 2A being a Class 0/I transition object which has already formed a small photodissociation region (PDR).
Key Words.:
stars:formation–stars: individual (IRAS 21391+5802, IC 1396 N)1 Introduction
Intermediate-mass young stellar objects (IMs) (protostars and Herbig Ae/Be stars with M⋆ 210 M⊙) are crucial to star formation studies because they provide the link between the evolutionary scenarios of low- and high-mass stars. These objects share many similarities with high-mass stars, in particular they are predisposed to be formed in clusters. However, to study them presents decided advantages compared to massive star forming regions, as many of them are located close to the Sun (1 kpc) and in regions of reduced complexity.
IRAS 21391+5802 (IC 1396 N) is one of the best studied IM protostars (L=440 L⊙, d=750 pc). Classified as a Class 0 / I borderline source, this young protostar is associated with a very energetic bipolar outflow. In addition, near-infrared images by Nisini et al. (2001) and Beltrán et al. (2009) revealed the presence of a collimated 2.12 m H2 jet. The outflows and envelope of this protostar were firstly mapped by Codella et al. (2001) and Beltrán et al. (2002, 2004b) using BIMA and OVRO. These observations revealed the existence of 3 millimeter continuum sources in the region. The most intense one, BIMA 2, is located at the center of the envelope and seems to be the driving source of the most energetic outflow.
Recently, Neri et al. (2007) reported high angular resolution continuum images at 3mm and 1.3mm carried out with the IRAM Plateau de Bure Interferometer (PdBI) at its most extended configuration. The high sensitivity and spatial resolution of the two continuum images clearly testify to the presence of at least three bright continuum emission cores at the position of the source previously named BIMA 2. While the two weaker cores were not resolved by the interferometer, the primary core IRAM 2A was resolved at 1.3mm emission to an elliptical region of 300 AU AU. The mass and dust emissivity spectral index of this core are similar to those measured in circumstellar disks around Herbig Ae/Be stars (Neri et al. 2007; Fuente et al. 2003, 2006; Alonso-Albi et al. 2008, 2009a). Other possible interpretations (hot corinos, cold compact pre-stellar clumps) cannot be, however, discarded.
In this Paper, we present high angular resolution images of the N2H+ 10, CH3CN 5k4k and 13CS J=21 lines observed with the PdBI in its extended AB configuration. In addition we combine our previous continuum PdBI images (Neri et al.2007) with the BIMA observations published by Beltrán et al. (2002). The new 1.2mm and 3.1mm continuum images together with the molecular data provide a valuable insight into the chemical and physical structure of this IM protocluster, in particular of the IM hot core.
2 Observations
2.1 PdBI observations
Observations were performed with the PdBI in AB configuration between January and March 2008. We observed a 1.4 GHz bandwidth with receivers tuned at 91.78 GHz. The spectral configuration allowed achieving a resolution of 0.25 km/s for the transitions CH3CN 5k4k, N2H+ 10 and for 13CS 21. Since the lines are wide, all the maps have been created with a spectral resolution of 0.2 MHz (0.64 km/s). Continuum was obtained by averaging the observed band with no line contribution. Because of some poor quality data, the uv-coverage is slightly different for the different lines. Synthesized beams are 1.561.23 PA 68∘ for CH3CN, 1.381.16 PA 95∘ for N2H+ and 1.421.21 PA 98∘ for 13CS. The rms of the images is 2.5 mJy/beam (0.2 K).
In order to calibrate the changes in time of the complex gains (i.e. phases and amplitudes), we observed alternatively with the source, every 22min, 2037+511. The calibration was found to be straightforward for all the tracks. A flux of 1.2 Jy was deduced for 2037+511 at the observed frequency. The RF calibration was performed by observing for few minutes the brightest sources in the sky. MWC349 was observed and used as flux reference, adopting a flux of 1.1 Jy as suggested by recent PdBI models and consistently with expected antennas’ efficiency values. The flux calibration is found to be reliable to better than 10%.
2.2 PdBI+BIMA Continuum images
The PdBI 3mm continuum data are merged with previous PdBI data by Neri et al (2007), and with older interferometric BIMA observations by Beltrán et al (2002). The contrast of weights of the different observations makes it difficult the merging, forcing to lower the weights of the PdBI data.
At 1mm we merged the PdBI data by Neri et al (2007) and the BIMA observations by Beltrán et al (2002). The merging was corrected by the different beam sizes, no factor was added to correct for weight contrast. The merged image is only reliable for the innermost 25 arcseconds, which corresponds to HPBW of the PdBI primary beam. Due to the PdBI primary beam correction, the imaging becomes very noisy close to the border of the PdBI primary beam. Despite nearly a factor of 2.5 difference in the primary beam sizes, we are confident in the elongated structure detected within the PdBI primary beam along the outflow direction.
Finally, note that the data fluxes were not corrected for the different frequencies of the data sets; the BIMA data frequencies are 97.98 and 244.94 GHz, those of the previous PdBI observations are 92.09 and 242.00 GHz, and last 3mm continuum data center at 91.78 GHz. Assuming the largest spectral index measured in the region, alpha=+2.8 (Neri et al. 2007), we could introduce a maximum error in the derived continuum fluxes of 30% at 3mm and of 10% at 1mm, which applies mainly to the cocoon.
2.3 N2H+ 10 image
The PdBI N2H+ data were merged with short-spacing observations obtained with the 30m-telescope (at Pico Veleta, Spain). A 120”-size field was mapped with the single dish, by observing every 12”. As commented in Sect 3.3, the flux is mostly filtered out in the interferometric data, for that the single-dish data are so crucial to recover the flux and to reconstruct the line emission distribution.
3 Small scale ( 1000 AU)
3.1 CH3CN: The hot core IRAM 2A
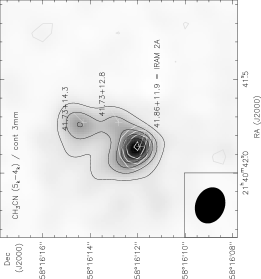
The CH3CN 5k4k line emission has only been detected towards IRAM 2A, the most massive core in the proto-cluster. The integrated intensity map of the CH3CN 5k4k transition shows that the emission arises in a point source centered at the position of the massive hot core IRAM 2A (see Fig. 1).
Comparing the integrated emission peak of the PdBI map with that of the 30m spectrum (see Fig. 2), we estimate that 1–2% of the emission is coming from a compact region around IRAM 2A while the remaining arises from an extended component. This is approximately the same number we obtain by dividing the 1.3mm flux towards IRAM 2A, 35 mJy (Neri et al. 2007) and the single-dish 1.3mm flux, 1.4 Jy. This shows that CH3CN is a good tracer of IM hot cores.
The interferometric profile of the CH3CN 5k4k emission is very different from that observed with the 30m telescope (see Fig. 2). In fact, there is a shift of 2.5 km/s between the centroid of the PdBI emission and that of the 30m. However, it is much more similar to that observed in the high excitation CH3CN 14k13k lines which suggests that the difference between the single-dish and interferometric profiles of the CH3CN 5k4k is mainly due to the very different angular resolution of the observations (the beam of the 30m telescope at the frequency of the CH3CN 5k4k line is 27, the 30m beam at the frequency of the CH3CN 14k13k is 9, in our PdBI observations the beam is 1.561.23). It suggests that the velocity of the hot core is different from that of the bulk of the molecular cloud. Most of the CH3CN 5k4k single-dish emission is arising in the extended envelope whose kinematics has been severely affected by the bipolar outflow (see Codella et al. 2001, Beltrán et al. 2002, 2004b). However, the different velocity profiles of the PdBI and 30m lines could also be due to the filtering of the extended emission by the PdBI observations. The amount of missed flux is different for each spectral channel depending on the spatial distribution of the emission at that velocity. Interferometric observations at lower angular resolution are required to discern about filtering effects and a real change in velocity between the hot core and the surrounding cloud.
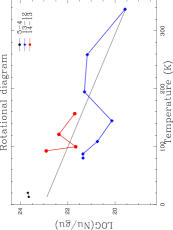
We have determined the CH3CN column density towards IRAM 2A using the rotational diagram technique and the interferometric 13k12k data published by Neri et al. (2007), those presented in this Paper and the CH3CN 14k13k line observed with the 30m telescope (see Fig. 3). We assume that all the emission of the CH3CN 14k13k line arises in the hot core IRAM 2A. In the case that an extended emission component is also contributing to the flux of the CH3CN 14k13k line, the derived temperature would be an upper limit to the actual one. We derive a rotational temperature of 9725 K and a CH3CN column density of 6.55.0 1013 cm-2 averaged in a beam of 1.61.2. Assuming that the dust temperature is 100 K, and the size of IRAM 2A estimated by Neri et al (2007), 0.40.2, we obtain a CH3CN abundance of 53 10-10 in this core.
3.2 13CS
We have not detected the 13CS 21 line in this region. Beltrán et al. (2004b) mapped the region in the CS J=21 line using BIMA with an angular resolution of 7.06.3. The most intense peak is detected towards BIMA 2 with a maximum intensity of 9.6 Jy beam-1 km s-1 integrated in a velocity interval of -3 to 3 km/s. Assuming that the line ratio between the 12CS 21/13CS 21 is 60 (a reasonable value for N(CS)=2 1014 cm-2 derived by Codella et al. 2001), our upper limit to the 13CS emission implies that less than 60 % of the CS emission detected by BIMA interferometer is arising in the IM hot core. In the case of a smaller 12CS 21/13CS 21 line ratio, i.e., a higher opacity of the CS 21 line, the fraction of the 13CS emission arising in the hot core would be smaller. Thus, the 13CS 21 line does not seem to be a good tracer of IM hot cores. This is consistent with the kinematical study by Beltrán et al. (2004b). They concluded that the CS emission is not tracing the dense hot core, but the interaction of the molecular outflow with the core(s).
3.3 N2H+
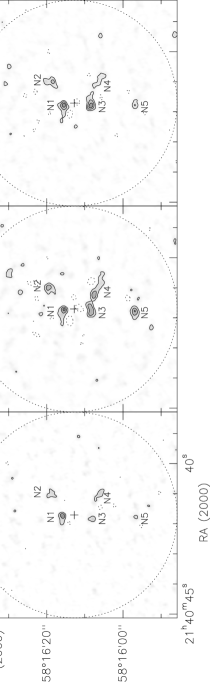
In Fig. 4 we show the integrated intensity maps of the N2H+ J=10 F=11, F=21 and F=01 lines. Emission of the N2H+ line has been detected in several clumps across the area sampled by the interferometer (labeled in Fig 4 ), but none of them is spatially coincident with the compact cores detected in the continuum images (see Fig. 5). Moreover, the interferometric spectrum towards the most intense core, IRAM 2A, has no evidence of emission. We have convolved the whole image with a beam of 27 to compare the result with the single-dish spectrum obtained with the 30m by Alonso-Albi et al. (2009). We find that only 1% of the flux was recovered by the interferometer. The velocity profile of the PdBI and 30m spectra are also quite different showing that most of the emission at ambient and red-shifted velocities has been resolved and filtered out by the PdBI observations (see Fig. 6).
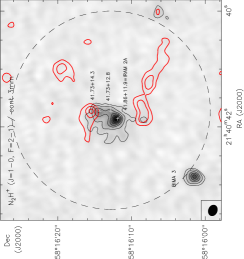
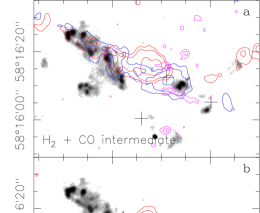
In Fig 7, we show our N2H+ 10 F=21 image superposed to the bipolar molecular outflow as traced by the interferometric observations of CO 10 and CS 54 lines. All the N2H+ clumps except N5 seem to follow the morphology of the bipolar outflow, delineating the walls of the cavity. The fact that filtering is less important at velocities shifted from that of the ambient cloud, favors the detection of the interaction layer between the outflow and the surrounding cloud. The match between N2H+ and the bipolar outflow lobes is better when we compare with the CS 54 line. This is the expected behavior since the N2H+ and CS are high dipole moment molecules that trace the dense gas. In fact, CS and N2H+ could have similar spatial distribution in the blue lobe if we take into account the lower angular resolution of the CS data.
4 Large Scale
4.1 PdBI+BIMA images continuum images
The continuum images at 1.2mm and 3.1mm resulting from merging BIMA and PdBI data show two different emission components: (i) the central cluster identified by Neri et al. (2007) and (ii) extended emission along the outflow direction (see Fig. 8). The emission from the central cluster was already modeled by Neri et al. (2007). They found that it is well explained as arising from three compact clumps ( 300 AU) immersed in a cocoon of about 2800 AU. The spectral indices are different for the cocoon and the compact cores. While the compact cores have spectral indices of 1.4–1.9, the spectral index in the cocoon is 2.8. The value in the cocoon is consistent with optically thin dust emission with 1.
The continuum emission at 1.2mm and 3.1mm is extended along the outflow axis. This extended emission arises from the walls of the cavity excavated by the outflow, that are expected to be warmer than the surroundings. The dust continuum emission tracing the walls excavated by the outflow has also been observed in low-mass star-forming regions, as for example in the Class 0 L1157 (Beltrán et al. 2004a). The spatial distribution of the continuum emission at 1.2mm is different from that at 3.1mm. The 1.2mm emission is more intense in the eastern lobe. In contrast, the 3.1mm emission comes mainly from the western lobe. This different spatial distribution could reveal a gradient in the 1.2mm/3.1mm spectral index along the outflow. While values larger than 2, consistent with optically thin dust emission, are found in the eastern (red) lobe, values 0.6, typical for an ionized wind, are found in the western (blue) lobe. However, taking into account the technical complexity and the uncertainties involved in the merging processes of the PdBI and BIMA data, we have to be cautious with this result. Moreover, in regions with complex morphologies, the different filtering of the continuum emission at 3.1mm and 1.2mm (different synthesized beams) can produce an apparent change in the 1.2mm/3.1mm spectral index. A more complete set of data with visibilities that provide uv-coverage with critical sampling and consistent frequency scaling is required to confidently measure the 1.2mm/3.1mm spectral index.
4.2 30m+PdBI N2H+ 10 image
We have included the 30m short spacing data and synthesized the 30m+PdBI image to have a more realistic view of the spatial distribution of N2H+ emission. After merging the 30m and PdBI data we have obtained the image shown in Fig. 9. The highest red and blue shifted velocities show the same spatial distribution as the clumps N in the PdBI image (see 3.65 km s-1 and -1.38 km s-1 panels in Fig. 9). This high velocity gas is distributed in two filaments in the North and South of IRAM 2A respectively. The bulk of the N2H+ emission is, however, arising in an elongated envelope located perpendicular to the molecular outflow (see Fig. 7 and 8). This envelope does present a velocity gradient of 1 km s-1 over an angular distance of 11 ( 23 km s-1 pc-1) in the direction of the bipolar outflow. This velocity gradient is consistent with the outflow kinematics which corroborates that the kinematics of the whole molecular globule is affected by the bipolar outflow.
The N2H+ envelope is elongated in the same orientation as the cocoon in the continuum model proposed by Neri et al. (2007). This suggests that both emissions are tracing the same physical structure and that the different spatial distribution of the emission is due to chemical differentiation. As discussed in Sect. 5, the [CH3CN]/[N2H+] ratio is strongly dependent on the gas and dust temperature.
5 The CH3CN/N2H+ abundance ratio: a chemical diagnostic
The different morphologies of CH3CN and N2H+ can be at least qualitatively understood considering that CH3CN is mainly formed on the surface of dust grains (e.g. Bisschop et al. 2007; Garrod et al. 2008), whereas only gas phase processes are responsible for the formation and destruction of N2H+ (Aikawa et al. 2005). On the one hand, the N2H+ abundance increases in cold and dense regions, where CO molecules freeze-out onto dust grains. On the other hand, the largest fractional abundance of CH3CN is observed toward warm regions (in particular hot cores), where the dust temperature becomes large enough (90 K) to allow mantle evaporation.
To see how the dust temperature affects the CH3CN/N2H+ abundance ratio, we consider a simple chemical model of a uniform cloud at temperatures between 5 and 100 K. The chemical processes are the same as those described in detail by Caselli et al. (2008): gas phase formation and destruction of N2H+, HCO+, H and deuterated counterparts, time-dependent freeze-out of CO and N2, thermal and non-thermal desorption due to cosmic-ray impulsive heating, dust grains with a MRN (Mathis et al. 1977) size distribution. More details about the model can also be found in Emprechtinger et al. (2009).
For the CH3CN chemistry, we used the results of the comprehensive Garrod et al. (2008) model M, shown in their Fig. 5. Here, the CH3CN abundance is plotted as a function of time and temperature and it shows two main plateau: one at 40T90 K, where X(CH3CN)10-10, mainly due to HCN evaporation followed by gas phase processes, and one at T90 K, where X(CH3CN) reaches its peak abundance of 10-8 due to direct evaporation from grain mantles. At lower temperatures, X(CH3CN)10-13. To simulate this trend, our model assumes that a fraction (X(CH3CN)=10-10) of surface CH3CN has a binding energy of 1900 K (close to that of CO), whereas the majority has a binding energy of 4500 K (close to that of H2O).
Figure 10 shows the fractional abundances of CO, N2H+ and CH3CN as a function of gas and dust temperature and for three different values of the gas density: n(H2)=5104, 5105 and 5106 cm-3. The gas and dust temperatures are assumed to be the same, given that they are coupled at densities larger than a few 104 cm-3 (Goldsmith 2001). We assume that the fraction of CH3CN on the surface of dust grains does not change with density. Surface CO completely evaporates at T20 K. As expected, the N2H+ abundance shows a peak at the minimum of the CO abundance (CO is one of the main destroyers of N2H+, together with electrons and negatively charged dust grains). Moreover, being a molecular ion, N2H+ is sensitive to the volume density, given that the electron fraction approximately varies as n(H2)-0.5. The [CH3CN]/[N2H+] ratio as a function of temperature (and for the three different density values considered) is also plotted in Fig. 10. The model assumes steady state.
The [CH3CN]/[N2H+] ratio varies by 5 orders of magnitude when the temperature increases from 20 to 100 K. This large variation makes this ratio an excellent chemical thermometer in this range of gas kinetic temperatures. Variation in the molecular hydrogen density can also affect this ratio but to a lesser extent. Since the N2H+ fractional abundance is dependent on the molecular hydrogen density, the [CH3CN]/[N2H+] ratio together with X(N2H+) are excellent tracers of the temperature and the density of the emitting gas.
5.1 Molecular cores in IC 1396 N
On basis of the results of our model, we are going to use the chemistry as a diagnostic for the physical conditions of the cores in IC 1396 N. Towards IRAM 2A we have estimated X(CH3CN)5 10-10 and X(N2H+)1.2 10-10. The [CH3CN]/[N2H+] ratio and the derived X(CH3CN) are consistent with our chemical model for gas temperatures 80 K, in agreement with our estimate of the gas temperature from the CH3CN rotational diagram. The upper limit to the N2H+ abundance derived towards this core suggests that the molecular hydrogen density is 5105 cm-3, which is also consistent with the masses and sizes derived from the continuum emission. The CH3CN abundance measured towards IRAM 2A is similar to that found in hot corinos (Bottinelli et al. 2004, 2007) but 1 to 2 orders of magnitude lower than those expected in high-mass cores (Nummelin et al. 2000; Wilner, Wright & Plambeck 1994). Fuente et al. (2005b) derived a CH3CN abundance of 7 10-9 towards the IM core NGC 7129–FIRS 2 which is more similar to the values found in high mass stars. NGC 7129–FIRS 2 and IC 1396 N are IM protostars with similar luminosities. The difference in the CH3CN abundance of NGC 7129–FIRS 2 and IC 1396 N could be due to the fact that IC 1396 N is a cluster of low-mass and Herbig Ae stars. In contrast, Fuente et al. (2005b) did not detect clustering in NGC 7129–FIRS 2 down to a spatial resolution of 1000 AU, which suggests that NGC 7129–FIRS 2 could be the precursor of a more massive Be star. On the other hand, IC 1396 N is a more evolved object than NGC 7129–FIRS 2. While IC 1396 N is considered a borderline Class 0/I object), NGC 7129–FIRS 2 is one of the youngest Class 0 objects known thus far (Fuente et al. 2001, 2005a). Other possibility is that the low abundance of CH3CN is due to the fact that the recently formed IM star has already formed a small (undetectable with our angular resolution) photodissociation region (PDR). A PDR of Av1-3 mag, at a density of n(H2)=5 105cm-3, would have a size of a few 100 AU. The CH3CN 5k4k and N2H+ 10 lines have not been detected towards BIMA 3. The non-detection of this core in N2H+ is consistent with very high density (n(H2)5105 cm-3) and hot (100 K) gas.
In addition to the IRAM 2A and BIMA 3 cores, we have detected filaments and clumps in the N2H+ 10 line emission that remain undetected in the other tracers. In Table 2 we show the derived N2H+ column densities towards 5 selected positions (labeled ’N’ in Fig. 4 and Table 2) assuming gas temperatures of 100, 50 and 20 K. These column densities are in fact lower limits to the real ones since the emission close to the ambient velocities could be underestimated because of the PdBI filtering. We also show lower limits to the N2H+ abundance and upper limits to the [CH3CN]/[N2H+] ratio. Comparing the [CH3CN]/[N2H+] ratio with our chemical calculations (see Fig. 10), we estimate an upper limit of 50 K for the actual gas temperature. However, assuming T50 K, the derived N2H+ abundance would be 1 order of magnitude higher than that expected from our chemical model for reasonable values of the molecular hydrogen density (5105 cm-3). Thus, we conclude that these clumps have very likely gas temperatures of around 20 K or less. Note that our chemical model predicts a peak in N2H+ abundance around T=17 K. The UV radiation from the star and possible low velocity shocks are heating the walls of the cavity excavated by the bipolar outflow. In addition to the density and column density enhancements expected in the walls of the cavity, the detection of clumps N1 to N4 might be favored by the warmer gas.
Summarizing, we have detected two chemically different regions in IC1396 N: (i) the warm cores IRAM 2A and BIMA 3, detected in continuum emission and with temperatures around 100 K and (ii) the filaments and the clumps N1 to N4 located along the walls of the bipolar cavity excavated by the outflow that are only detected in the N2H+ 10 line and have very likely temperatures of around 20 K. N5 could be a colder and denser one. The [CH3CN]/[N2H+] ratio is a good chemical diagnostic to discern the temperature of the dense cores.
| Source | RA(2000) | Dec(2000) | Size | T | Mass | N(H2) | X(N2H+) | X(CH3CN) | [CH3CN]/[N2H+] | v |
|---|---|---|---|---|---|---|---|---|---|---|
| (M⊙) | (km/s) | |||||||||
| IRAM 2A∗ | 21:40:41.86 | 58:16:11.9 | 0.40.2 | 100 | 0.06 | 3.1 1024 | 1.4 10-10 | 5.0 10-10 | 4 | 2 |
| BIMA3∗ | 21:40:42.84 | 58:16:01.4 | 0.80.4 | 100 | 0.05 | 6.5 1023 | 1.6 10-10 | 2.3 10-9 | 2 | |
| 50 | 0.11 | 1.4 1024 | 4.1 10-11 | 1.2 10-9 | ||||||
| 20 | 0.32 | 4.1 1024 | 6.2 10-12 | 6.1 10-10 | ||||||
| N1a | 21:40:41.76 | 58:16:15.57 | 1.41.2 | 100 | 0.03 | 6.8 1022 | 1.8 10-9 | 2 | 2.4 | |
| 50 | 0.06 | 1.4 1023 | 4.7 10-10 | 5 | ||||||
| 20 | 0.15 | 3.7 1023 | 8.0 10-11 | 16 | ||||||
| N2a | 21:40:41.03 | 58:16:18.66 | 1.41.2 | 100 | 0.03 | 6.8 1022 | 1.1 10-9 | 5 | 2.1 | |
| 50 | 0.06 | 1.4 1023 | 3.0 10-10 | 8 | ||||||
| 20 | 0.15 | 3.7 1023 | 5.1 10-11 | 40 | ||||||
| N3a | 21:40:41.83 | 58:16:08.22 | 1.41.2 | 100 | 0.03 | 6.8 1022 | 1.6 10-9 | 2 | 1.9 | |
| 50 | 0.06 | 1.4 1023 | 4.2 10-10 | 5 | ||||||
| 20 | 0.15 | 3.7 1023 | 7.2 10-11 | 17 | ||||||
| N4a | 21:40:41.22 | 58:16:07.26 | 1.41.2 | 100 | 0.03 | 6.8 1022 | 1.2 10-9 | 3 | 2.4 | |
| 50 | 0.06 | 1.4 1023 | 3.1 10-10 | 7 | ||||||
| 20 | 0.15 | 3.7 1023 | 5.3 10-11 | 36 | ||||||
| N5a | 21:40:41.81 | 58:15:56.82 | 1.41.2 | 100 | 0.03 | 6.8 1022 | 1.3 10-9 | 3 | 2.1 | |
| 50 | 0.06 | 1.4 1023 | 3.4 10-10 | 7 | ||||||
| 20 | 0.15 | 3.7 1023 | 5.8 10-11 | 20 |
∗ Sizes, masses and N(H2) from Neri et al. (2007)
a The size is assumed to be equal to the beam size. The values of N(H2) and the masses have been estimated from the 3rms (1mJy/beam) of our 3.1mm map and 1mm=0.01 cm2 g-1 and a dust emissivity spectral index of 1.
6 Overview of the region
Figure 11 shows an sketch of the cometary bright-rimmed globule IC1396 N. The bipolar molecular outflow associated with the young intermediate mass protostar has excavated the molecular cloud producing a biconical cavity. This cavity has disrupted the cloud in the south-western direction allowing the high-velocity gas to travel away. The dense gas is located in an elongated feature, probably an asymmetric toroid, in the direction perpendicular to the outflow. The molecular toroid presents strong temperature gradients which produce a chemical differentiation.
The N2H+ emission is very intense in the outer part of the toroid, with the peaks located 3 North and South from the position of the protocluster (see Fig. 9), but absent in the inner region. The inner region was modeled by Neri et al. (2007) based on the continuum data. They concluded that the continuum emission arises in 3 dense cores immersed in a cocoon. The non detection of these cores in N2H+ suggest that all three are warm cores, probably protostars. Consequently, the previously thought single IM protostar, could actually be a tight proto-cluster. Emission of the CH3CN 54 and 1312 lines has been detected towards the most intense core, IRAM 2A (Neri et al. 2007, this Paper). On basis of our CH3CN observations, we determine a temperature of 9725 K and a CH3CN abundance of 53 10-10 towards IRAM 2A, similar to that found in hot corinos.
Summarizing, the strong dependence of the [CH3CN]/[N2H+] on the gas and dust temperature produces a layered structure in the molecular toroid perpendicular to the bipolar outflow, with the CH3CN emission being more intense in the inner region and N2H+ in the outer part.
6.1 Source(s) of the molecular outflow(s)
Three bipolar outflows have been identified in the CO maps: the first one is located around the position of a strong mm continuum BIMA 2 source in the head of the globule, the second one is associated with BIMA 1 (Beltrán et al. 2002) and the last one is located in the northern region, outside our interferometric images (Codella et al. 2001). Single-dish observations of the SiO lines towards the central outflow (that associated with BIMA 2) revealed a highly collimated structure with four clumps of sizes 0.1 pc located along the outflow axis. Interferometric images of the CO emission showed, however, that this outflow present a quite complex morphology that Beltrán et al. (2002) interpreted as the result of the interaction of the high velocity gas with dense clumps surrounding the protostar.
Our highest angular resolution images allow us to learn a bit more about the structure of this complex bipolar outflow. One of the main questions is the driving source of this energetic outflow. The previously thought unique IM protostar BIMA 2, turned to be a cluster of dense cores. The detection of warm CH3CN in IRAM 2A suggest that this is the most massive protostar and could be the driving source of this energetic outflow. This interpretation is also supported by the morphology of the 1mm continuum emission. However the angular resolution of previous interferometric CO observations ( 2) does not allow to undoubtedly conclude about that (see Fig. 7). Higher angular resolution observations of CO and/or SiO are required to determine the outflow(s) exciting source(s)
7 Conclusions
We have carried out high-angular resolution (1.4) observations in the continuum at 3.1mm and in the N2H+ 10 and CH3CN 5k4k lines using the Plateau de Bure Interferometer (PdBI). In addition, we have merged the PdBI images with previous BIMA (continuum data at 1.2mm and 3.1mm) and single-dish (N2H+) data to have a comprehensive description of the region. Our results can be summarized as follows:
-
•
At large scale, the combination of our data with previous BIMA and 30m data show that the bipolar outflow associated has completely eroded the initial molecular globule. The 1.2mm and 3.1mm continuum emissions are extended along the outflow axis tracing the warm walls of the biconical cavity.
-
•
Most of the molecular gas is located in an elongated feature in the direction perpendicular to the outflow. Our results show two types of region in IC1396 N: (i) the cores detected in dust continuum emission, one of which (the most massive) has also been detected in the CH3CN 5k4k line, and (ii) the filaments and clumps located in the molecular toroid, mainly along the walls of the bipolar cavity excavated by the outflow, that are only detected in the N2H+ 10 line. This chemical differentiation can be understood in terms of the temperature dependent behavior of the chemistry of N2H+ and CH3CN. The [CH3CN]/[N2H+] ratio increases by 5 orders of magnitude when the gas temperature increases from 20 to 100 K.
-
•
We have used the [CH3CN]/[N2H+] ratio as a chemical diagnostic to derive the temperature and evolutionary status of the young stellar objects (YSOs). The CH3CN abundance towards IRAM 2A is similar to that found in hot corinos and lower than that expected towards IM and high mass hot cores. This could indicate that IRAM 2A is a low mass or at most Herbig Ae star (IRAM 2A) instead of the precursor of a massive Be star. Alternatively, the low CH3CN abundance could also be the consequence that IRAM 2A is a Class 0/I transition object which has already formed a small photodissociation region (PDR).
Our chemical model and observational data prove that the [CH3CN]/[N2H+] ratio is a good tracer of the gas kinetic temperature that is closely related with the spectral type of the star that is being formed. Together with the [CH3CN]/[N2H+] ratio, the fractional abundances of CH3CN and N2H+ can inform about the physical conditions of the gas. Interferometric observations of CH3CN and N2H+ towards IM protostars are, consequently, a valuable tool to have insight into the structure of these young stellar objects.
Acknowledgements.
We are grateful to the IRAM staff in Grenoble and Spain with their great help during the observations and data reduction.References
- Alonso-Albi et al. (2008) Alonso-Albi, T., Fuente, A., Bachiller, R., Neri, R., Planesas, P., & Testi, L. 2008, ApJ, 680, 1289
- Alonso-Albi et al. (2009) Alonso-Albi, T., Fuente, A., Bachiller, R., Neri, R., Planesas, P., Testi, L., Berné, O., & Joblin, C. 2009a, A&A, 497, 117
- Alonso-Albi et al. (2009) Alonso-Albi et al. 2009b, in preparation
- Aikawa et al. (2005) Aikawa, Y., Herbst, E., Roberts, H., & Caselli, P. 2005, ApJ, 620, 330
- Beltrán et al. (2002) Beltrán, M. T., Girart, J. M., Estalella, R., Ho, P. T. P., & Palau, A. 2002, ApJ, 573, 246
- Beltrán et al. (2004) Beltrán, M. T., Gueth, F., Guilloteau, S., & Dutrey, A. 2004a, A&A, 416, 631
- Beltrán et al. (2004) Beltrán, M. T., Girart, J. M., Estalella, R., & Ho, P. T. P. 2004b, A&A, 426, 941
- Beltrán et al. (2009) Beltrán, M.T., Massi, F., López, Girart, J.M., Estalella, R. 2009, A&A, in press
- Bisschop et al. (2007) Bisschop, S. E., Jørgensen, J. K., van Dishoeck, E. F., & de Wachter, E. B. M. 2007, A&A, 465, 913
- Bottinelli et al. (2004) Bottinelli, S., et al. 2004, ApJ, 617, L69
- Bottinelli et al. (2007) Bottinelli, S., Ceccarelli, C., Williams, J. P., & Lefloch, B. 2007, A&A, 463, 601
- Caselli et al. (2008) Caselli, P., Vastel, C., Ceccarelli, C., van der Tak, F. F. S., Crapsi, A., & Bacmann, A. 2008, A&A, 492, 703
- Codella et al. (2001) Codella, C., Bachiller, R., Nisini et al. 2001, A&A, 376, 271
- Emprechtinger et al. (2009) Emprechtinger, M., Caselli, P., Volgenau, N. H., Stutzki, J., & Wiedner, M. C. 2009, A&A, 493, 89
- Fuente et al. (2001) Fuente, A., Neri, R., Martín-Pintado, J., Bachiller, R., Rodríguez-Franco, A., & Palla, F. 2001, A&A, 366, 873
- Fuente et al. (2003) Fuente, A., Rodríguez-Franco, A., Testi, L., et al. 2003, ApJL, 598, L39
- Fuente et al. (2005) Fuente, A., Neri, R., & Caselli, P. 2005a, A&A, 444, 481
- Fuente et al. (2005) Fuente, A., Rizzo, J. R., Caselli, P., Bachiller, R., & Henkel, C. 2005b, A&A, 433, 535
- Fuente et al. (2006) Fuente, A., Alonso-Albi, T., Bachiller, et al. 2006, ApJL, 649, L119
- Garrod et al. (2008) Garrod, R. T., Weaver, S. L. W., & Herbst, E. 2008, ApJ, 682, 283
- Goldsmith (2001) Goldsmith, P. F. 2001, ApJ, 557, 736
- Mathis et al. (1977) Mathis, J. S., Rumpl, W., & Nordsieck, K. H. 1977, ApJ, 217, 425
- Neri et al. (2007) Neri, R., et al. 2007, A&A, 468, L33
- Nisini et al. (2001) Nisini, B., et al. 2001, A&A, 376, 553
- Nummelin et al. (2000) Nummelin, A., Bergman, P., Hjalmarson, Å., Friberg, P., Irvine, W. M., Millar, T. J., Ohishi, M., & Saito, S. 2000, ApJS, 128, 213
- Wilner et al. (1994) Wilner, D. J., Wright, M. C. H., & Plambeck, R. L. 1994, ApJ, 422, 642