The Debris Disk around HR 8799
Abstract
We have obtained a full suite of Spitzer observations to characterize the debris disk around HR 8799 and to explore how its properties are related to the recently discovered set of three massive planets orbiting the star. We distinguish three components to the debris system: (1) warm dust (T 150 K) orbiting within the innermost planet; (2) a broad zone of cold dust (T 45 K) with a sharp inner edge, orbiting just outside the outermost planet and presumably sculpted by it; and (3) a dramatic halo of small grains originating in the cold dust component. The high level of dynamical activity implied by this halo may arise due to enhanced gravitational stirring by the massive planets. The relatively young age of HR 8799 places it in an important early stage of development and may provide some help in understanding the interaction of planets and planetary debris, an important process in the evolution of our own solar system.
Subject headings:
circumstellar matter – infrared: stars – planetary systems – stars: individual (HR8799)1. Introduction
Rapid progress has been made in the past decade in discovering other planetary systems and in building theories for their formation and evolution. More than 300 extrasolar planets have been found through measuring stellar radial velocities and about 60 planets have been observed to transit their stars (Extrasolar Planets Encyclopaedia, http://exoplanet.eu/). However, these techniques are optimal in finding systems dramatically different from the solar system, with giant planets in orbits very close to their stars. There are two primary avenues for probing systems with planets that might have structures more analogous to that of the solar system. First, giant planets have recently been imaged around Fomalhaut (Kalas et al., 2008) and HR 8799 (Marois et al., 2008) in orbits with radii of tens of AU. Second, the Spitzer Space Telescope (Spitzer, Werner et al. 2004) has observed more than 200 debris disks, which represent dust production from colliding planetesimals, typically in zones analogous to the asteroid and Kuiper belts in the solar system. It is expected that these debris disks are sculpted by giant planets through gravitational interactions (Wyatt 2008 and references therein). Observations and models of well-studied examples show a wide variety of structures and behavior, possibly related to the individual quirks of their (unseen) planetary systems and their evolutionary states (e.g., Stapelfeldt et al. 2004; Su et al. 2005; Beichman et al. 2005; Song et al. 2005; Rhee et al. 2008; Su et al. 2008; Hillenbrand et al. 2008; Backman et al. 2009).
HR 8799 has been known to have a prominent debris system presumably sculpted by unseen planets (Zuckerman & Song, 2004). The recent detection of three giant planets orbiting this star, along with estimates of their masses and orbits, provides a new opportunity to understand in more detail the forces that shape debris disks. This paper reports new measurements with Spitzer that fully characterize the debris disk around HR 8799. We show that the debris system includes at least three components: warm dust interior to the three planets; cold dust exterior to them; and a halo of small grains surrounding the cold dust zone. The placement of the first two disk components appears to be as expected from the orbits of the planets. The dynamics of the three massive planets (Fabrycky & Murray-Clay, 2008; Reidemeister et al., 2009; Goździewski & Migaszewski, 2009) suggests substantial dynamical excitation in the overall planetary system. The elevated level of dynamical activity in the cold dust zone, which is the source of the large halo, is possibly a result of the unstable state of the system. The 20–160 Myr age of the system (Moór et al., 2006; Marois et al., 2008) corresponds to a critical phase in the history of our own solar system when planet formation processes were near completion and the solar system’s dynamical configuration was being established. The HR 8799 debris system offers an exciting view of this phase of planetary system formation and evolution.
We present the new observations in §2, describe the general observational results in §3, build detailed models in §4, and discuss the implications of this work in §5.
2. Observations and Data Reduction
The observations presented here are from the Spitzer Director’s Discretionary Time (DDT) program 530 and Guaranteed Time Observations (GTO) program 50175 that utilize all of the major observation modes of both the InfraRed Spectrograph (IRS, Houck et al. 2004) and the Multiband Imaging Photometer for Spitzer (MIPS, Rieke et al. 2004). The observational setting and depth for each of the modes are summarized in Table 1. A short (6 s 1 cycle) integration IRS spectrum of HR 8799 was previously published by Chen et al. (2006, 2009). Here we present an IRS spectrum that is 4–60 times deeper along with newly obtained MIPS images. Observations at 24 m were obtained in standard small-field photometry mode, for a total integration of 210 s. The observation at 70 m provides a total integration of 320 s on source. The 160 observation was obtained using the enhanced-mode at 4 sub-pixel-offset positions, for a total integration of 150 s. The MIPS SED-mode observation provides a low-resolution (R=15–25) spectrum from 55 to 95 with 600 s of integration on source.
| AOR Key | Instrument | Module | Integration |
|---|---|---|---|
| 28889856 | IRS Staring | SL2 | 6 s 4 cycles |
| SL1 | 14 s 4 cycles | ||
| LL2 | 120 s 3 cycles | ||
| LL1 | 120 s 3 cycles | ||
| 28889088 | MIPS Photometry | 24 , 5 cluster pos. | 3 s 1 cycle |
| 28889344 | MIPS Photometry | 70 , default scale | 10 s 4 cycles |
| 28889600 | MIPS Photometry | 160 , 4 cluster pos. | 10s 1 cycle |
| (enhanced mode) | |||
| 25711872 | MIPS SED-mode | 1′ chop | 10s 10 cycles |
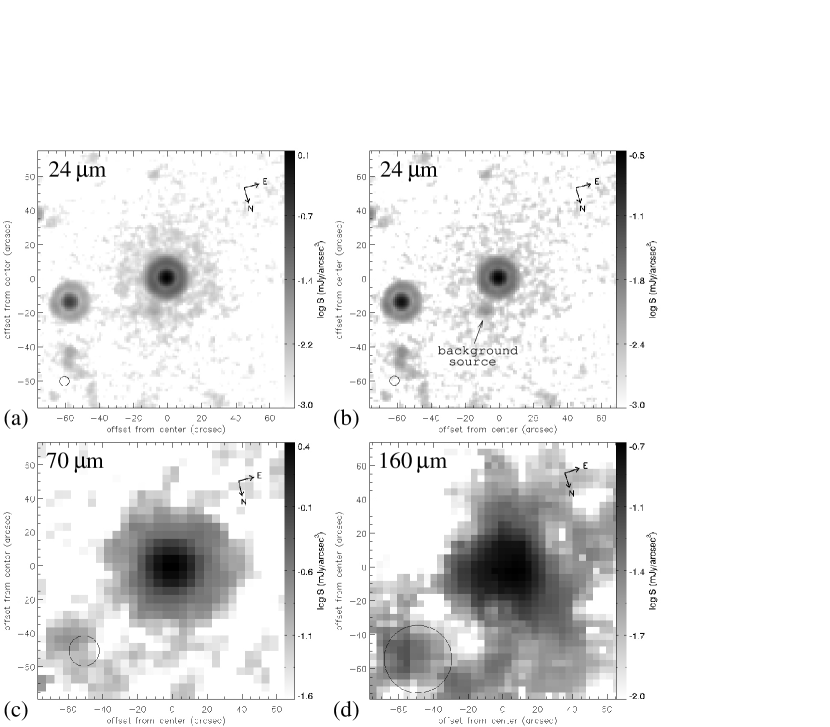
All of the MIPS data were processed using the Data Analysis Tool (Gordon et al., 2005) for basic reduction (e.g., dark subtraction, flat fielding/illumination corrections), with additional processing to minimize instrumental artifacts (Engelbracht et al., 2007; Gordon et al., 2007). After correcting these artifacts in individual exposures, the final mosaics were combined with pixels half the size of the physical pixel scale; the resulting images are shown in Figure 1. The calibration factors used to transfer the instrumental units to the physical unit (mJy) are adopted from the MIPS calibration papers (Engelbracht et al., 2007; Gordon et al., 2007; Stansberry et al., 2007; Lu et al., 2008).
To ensure the best flat field result at 24 , a second flat field made from a median stack of the data with all bright sources masked out was also applied in addition to the regular scan-mirror-dependent flat fielding (for details see Engelbracht et al. 2007). The flux density of the source at 24 was estimated using aperture photometry with both small and large apertures (the same photometry parameters111small aperture: a radius of 623 with sky annulus from 1992 to 2988 and an aperture correction of 1.699; large aperture: a radius of 1494 with sky annulus from 2988 to 4233 and an aperture correction of 1.142. as used in Su et al. 2006). The large aperture gives a flux density of 83.00.5 mJy, while the small aperture gives a flux density of 80.80.7 mJy (2.7% lower), implying the source profile is more extended than a true point source. Therefore, to capture all the flux from the extended component, we conducted photometry with a very large (radius of 35″) aperture on an image with the DC offset and all background sources subtracted without a sky annulus (i.e., the aperture photometry was relative to the median pixel value for the entire frame; therefore, an aperture correction of 1.06 was applied, see Engelbracht et al. 2007). The final measured flux we adopted is 86.4 mJy (before color correction).
The center of the source at 24 was determined using a 2-D Gaussian fitting routine, and it coincides with the expected stellar position within the pointing error (1″). This is consistent with the fact that the flux contribution in the 24 band is mostly from the stellar photosphere (58 mJy; see §3.1). The stellar photosphere was then subtracted by scaling an observed blue point spread function (PSF). After photospheric subtraction (see Fig. 1b), the source has FWHMs of 578567 at a position angle (P.A.) of 17°222The disk brightness in the 24 band is dominated by the bright unresolved component (details see §3.2). Therefore, the position angle given here only reflects the angle of the instrumental PSF, not the extended disk., slightly broader than an observed red PSF (561555 for the Lep disk, Su et al. 2008). There is a faint (0.8 mJy) source located 21″ from HR 8799 at P.A. of –36°, presumably a background object.
The 70 data reduction follows the steps recommended by Gordon et al. (2007) and uses time filtering with the source region masked out. Several region sizes were tried. A masked radius of 55″ yields the minimum value for the background variation (1- = 1.1410-2 mJy arcsec-2 per subpixel). The source at 70 (see Fig. 1c) is clearly extended with FWHMs of 246244 at a P.A. of 77°333Note that source appears to be azimuthally symmetric, therefore the P.A. quoted here does not necessarily reflects the true P.A. of the source., compared to the nominal resolution of 18″. The source has an azimuthally symmetric morphology in the image. The outer boundary of the source (though masked by the instrumental PSF) can be traced out to 42″ or 34″ in radius at 1- or 3- levels, respectively. Aperture photometry was used to estimate the flux density for the source since it is extended. An aperture of 42″ in radius (1- boundary) was used with a sky annulus of 44″–54″. After correcting for lost light based on the same aperture settings applied to a theoretical PSF, the final integrated 70 flux density is 545 mJy (before color correction).
The 160 data were taken in the “enhanced AOT” to allow them to be time filtered, as was also done for the 70 data (for details see Stansberry et al. 2007). No additional 160 PSF was obtained for the purpose of leak subtraction as it has been shown that the ghost image produced by the 160 filter leakage is less than 15 times of the photospheric flux density at 160 . The disk is 400 times brighter than the photosphere in this channel (see Tab. 2). This is also confirmed by careful inspection of the data where the expected ghost image lies. The final 160 mosaic shows some large-scale extended cirrus structures surrounding the source (see discussion in §5.3). The source is clearly detected at 160 (see Fig. 1d), and is consistent with being azimuthally symmetric above the 5- level at the expected star position. The source at 160 is surrounded by a low level of asymmetric background cirrus. The FWHMs are 47″41″ (based on an image with a field of view of 88″), slightly broader than a nominal observed PSF (38″, Stansberry et al. 2007), possibly influenced by the background cirrus. Aperture photometry is used to determine the integrated flux. To minimize the influence of the background cirrus, we used small aperture sizes (16″ and 24″), sky annuli (64″–128″) and aperture corrections (4.683 and 2.613 for a red point source of 50 K; Stansberry et al. 2007). The resultant integrated 160 flux density is 539 mJy (before color-correction). The centroid of the disk seen in the MIPS 70 and 160 images coincides with the expected position of the star.
| Flux Density (mJy) | ||||||
|---|---|---|---|---|---|---|
| m | TotalaaIntegrated in a large aperture including the star after color correction | StarbbFrom best-fit Kurucz model | Disk | MIR CoreccCentral unresolved source for the inner warm component at 24 | FIR CoreddCentral unresolved source for the outer cold component at 70 | ExtendedeeExtended emission for the cold component |
| 23.68 | 86.6 | 58 | 29 | 21 | 5 | 7.5 |
| 71.42 | 610 | 6.5 | 605 | 285–387 | 319–217 | |
| 155.89 | 555 | 1.4 | 554 | 554 | ||
The MIPS SED-mode data were reduced and calibrated as described by Lu et al. (2008) with an extraction aperture of 5 native pixels (50″) in the spatial direction. Since the source size (see below) is smaller than the extraction aperture, the slit loss was corrected based on a point source. This procedure would under-correct for the slightly extended source and may explain why there is small offset (17% at the fiducial wavelength of the 70 band) between the 70 m photometry and the MIPS-SED spectrum. The final MIPS SED-mode spectrum is smoothed to match the resolution at the long-wavelength portion of the spectrum (R=15).
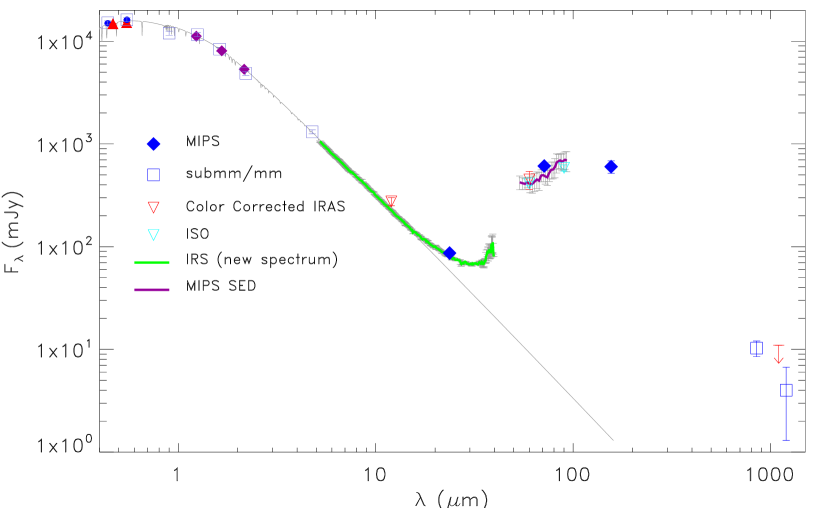
The basic reduction and extraction of the IRS spectral data were provided by the SSC IRS pipeline S18.5. We first trimmed a few end points from each module and manually removed large outliers by visually inspecting each of the co-added, background-subtracted spectra (differencing the two nod positions). The spectra were then averaged with sigma clipping (S/N=3). All of the final photometry measurements (color-corrected, see details in §3.2), MIPS SED-mode data, IRS combined spectrum, along with previously published data are shown in the spectral energy distribution (SED) (Fig. 2).
3. Analysis
3.1. Stellar Properties of HR 8799
HR 8799 (HD 218396, HIP114189), located at 39.4 pc (van Leeuwen, 2007), is classified as an A5 V (Cowley et al., 1969), Doradus variable. It has Bootis type characteristics (Gray & Kaye, 1999) with low abundances of the heavier elements (e.g., [Fe/H] = –0.55), but near-solar abundances of C and O (Sadakane 2006). A high-resolution optical spectrum of the star indicates = 7250K, log = 4.30 (Sadakane 2006). The galactic space motion (UVW) of the star resembles those of young clusters and associations in the solar neighborhood with ages of 20–160 Myr (Moór et al., 2006; Marois et al., 2008). The stellar rotation velocity () is 49 km s-1 (Royer et al., 2007), consistent with the star being viewed close to pole-on.
To determine the stellar spectral energy distribution, we fit all available optical to near-infrared photometry (Johnson , Strömgen photometry, Hipparcos Tycho photometry, 2MASS photometry) with the synthetic Kurucz model (Castelli & Kurucz, 2003) based on a goodness of fit test. A value of =7500 K with =1.4 and log g = 4.5 and sub-solar abundances gives the best match, in good agreement with the results from spectroscopy (Sadakane 2006). The resulting stellar luminosity is 5.7 , placing the star near the zero-age main sequence consistent with a young age. Based on the best-fit Kurucz model, we then estimate the stellar photospheric flux densities at 23.6, 71.42, and 155.9 for the MIPS 24, 70 and 160 bands, respectively. These values are listed in Table 2. With a stellar mass of 1.5 , the blowout size () is 2 assuming a grain density of 2.5 g cm-3 around HR 8799.
3.2. Disk Components
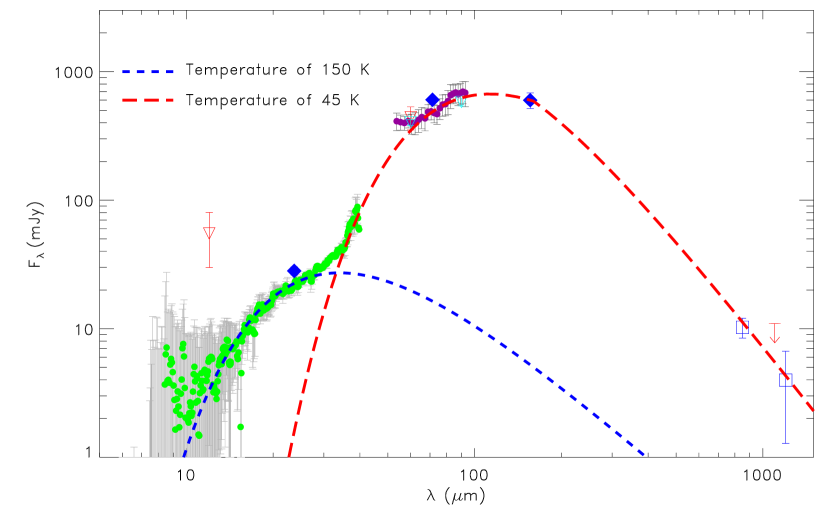
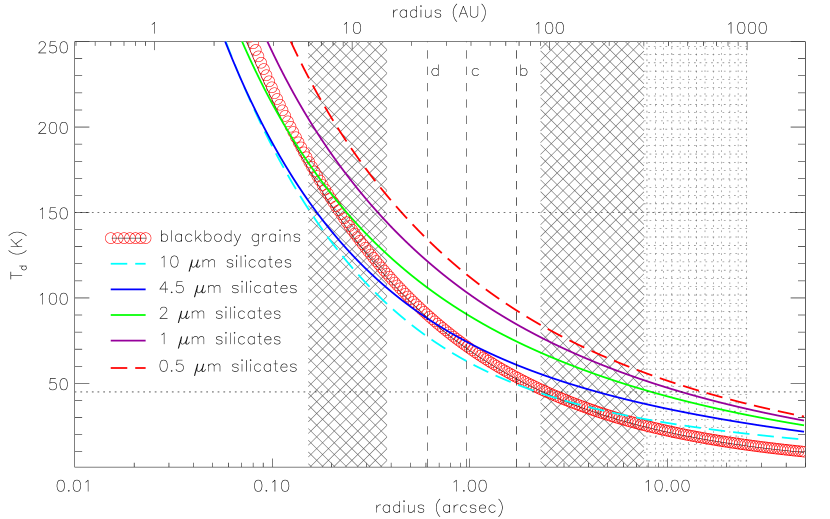
Figure 3 shows the excess SED after stellar photospheric subtraction. It is evident that there are at least two disk components in the system: one with a characteristic temperature of 150 K (warm) and the other with a characteristic temperature of 45 K (cold). Similar disk components have been suggested by Reidemeister et al. (2009) as well. For blackbody radiators that are in thermal equilibrium with the stellar radiation field, the warm (150 K) and cold (45 K) components correspond to radii of 9 AU (02) and 95 AU (24) from the star. Interestingly, HR 8799 d, c and b are at projected separations of 24, 38 and 68 AU from the star, respectively (Marois et al., 2008). They all lie between the two dust reservoirs. In general, the location of the dust that is at a specific thermal equilibrium temperature depends on the grain properties (through the absorption efficiency , which is size dependent). The equilibrium dust temperature is computed by balancing the absorption and emission energy and ultimately it depends on cross sections (, where is the grain radius); therefore, the temperature of large grains is generally lower than that of small grains at the same distance from the heating source. We adopt the optical constants for astronomical silicates (Laor & Draine, 1993) and compute the grain properties ( values for the absorption and scattering efficiency for grain radii of 0.1–1000 in size) using Mie theory with additional modifications for large sizes (10 ). The resultant thermal equilibrium dust temperatures as a function of radius from the star are shown in Figure 4. Due to the nature of an optically thin debris system, any dust in a continuous spatial distribution between the two distinct temperature components will have intermediate temperatures, resulting in a smoother excess SED between 20–55 (see Fig. 2 in Reidemeister et al. 2009). The SED shape and the distinct characteristic dust temperatures strongly suggest that very little dust resides between the two components.
Based on Figure 4, the emitting zone for the warm component is between 5 and 15 AU, with an angular diameter of 1″. This component, which dominates the emission detected in the IRS spectrum and the MIPS 24 band, should be unresolved at 24 (inside planet d). A similar calculation indicates that the cold component, if it has a size of 100 AU in radius, should be at best only barely resolved at 24 ; however, the excess SED (Fig. 3) shows that the cold component would contribute only a small ( 9%) portion of the total signal in the MIPS 24 band. Thus, the flux well outside the PSF at 24 suggests the detection of an extended component at this wavelength.
We estimate the flux of the unresolved point source in the 24 image (star + disk) by scaling a PSF to match the peak flux of the source. The scaling suggests that the central unresolved component is 78 mJy at maximum (assuming the extended component contributes no flux at the position of the star). The stellar photosphere is expected to be 58 mJy in the 24 band, so the central unresolved disk component is 20 mJy before color correction. Due to the large temperature differences between the warm and cold components, different color-corrections must be applied to each of the components at 24 . Applying a color-correction factor of 1.055 for a blackbody of 150 K (see the MIPS Data Handbook, http://ssc.spitzer.caltech.edu/mips/dh/, for the detailed color corrections for the MIPS bands), the total flux density of the central unresolved (warm) disk component is 21 mJy, which agrees well with the photosphere-subtracted IRS spectrum (22.41.4 mJy). Therefore, the extended disk component is 7.5 mJy (after applying a color correction of 0.894 for a blackbody of 50 K). Adding these measurements, the final total flux density for the entire system (star + two disk components after color corrections for the two different temperatures) is 86.6 1.7 mJy (assumed 2% error based on the nominal calibration uncertainty, Engelbracht et al. 2007).
The expected stellar photosphere is 6.5 mJy in the 70 band, suggesting the disk is 603 mJy after a color correction factor of 1.12 for a 50 K blackbody. Therefore, the total (star + disk) flux density at 70 is 61031 mJy (assumed 5% error based on the nominal calibration uncertainty, Gordon et al. 2007). At 160 , the stellar photosphere is 1.4 mJy; therefore, the total disk flux density is 554 mJy after a color correction of 1.03 for a blackbody of 50 K, resulting in a total (star+disk) flux of 55566 mJy (assumed 12% error based on the nominal calibration uncertainty, Stansberry et al. 2007).
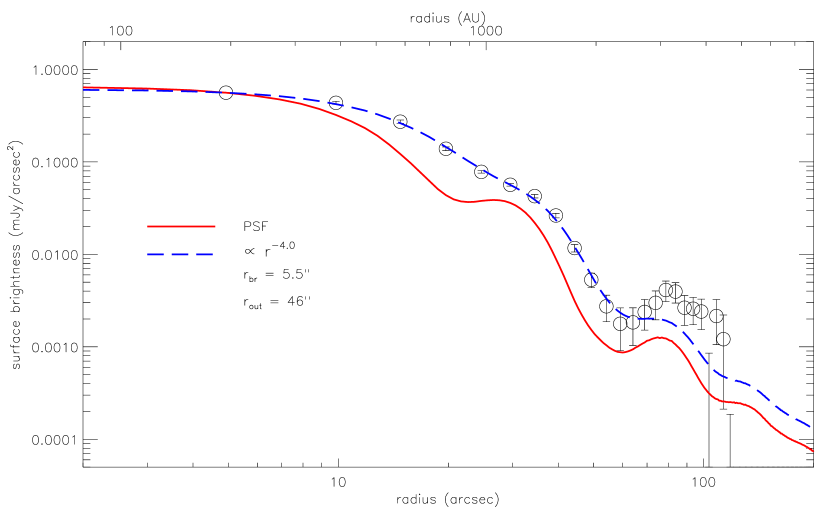
The 70 image is essentially only from the disk since the star is 1 % of the total flux in the far-infrared. An observed radial surface brightness profile of the disk at 70 is shown in Figure 5. As was indicated by the FWHM measurements, the disk is clearly resolved. The structure of the disk at 70 is similar to the one at 24 , a bright core and an extended disk; however, the bright core at 70 cannot originate from the warm component seen at 24 (because the temperature is too cold). This bright core is most likely to originate from a dust belt (hereafter the planetesimal disk) outside planet b, where emission by dust is also detected at submillimeter wavelengths (Williams & Andrews, 2006; Sylvester et al., 1996). Consistent with this possibility, the emission at 850 is mostly confined within 20″ (diameter) based on the JCMT/SCUBA measurements (Williams & Andrews, 2006). However, if the dust emitting at 70 all originated from the same location as in the submillimeter, the disk could not be resolved by MIPS at 70 . In addition, Reidemeister et al. (2009) also estimate the outer edge of the cold dust component is between 125 and 170 AU (a narrow ring) based on simple SED fitting and assumed grain properties. Given the nominal resolution of 18″ in the MIPS 70 band, any disk structure that is smaller than 360 AU in radius is not resolvable at a distance of 40 pc. The large measured FWHMs at 70 suggest that the extended emission at 70 must originate from a component outside the planetesimal disk.
Limited by the large beam size at 70 , the current data cannot differentiate whether there is any gap between the planetesimal disk and the extended component. We can only estimate the bright core (presumably the planetesimal disk) flux by normalizing a PSF to match the peak of the observed flux (this procedure provides an upper limit) or to match the flux within a 10″ radius (to provide a lower limit). After color correction for 50 K, the unresolved core flux density is 285–387 mJy, suggesting that the extended component is roughly equal in integrated brightness to the unresolved core.
3.3. Disk Inclination
Based on 10 years of astrometric data on planet b, Lafrenière et al. (2009) suggest an orbital inclination of 13°–23° off the plane of the sky. In addition, both Fabrycky & Murray-Clay (2008) and Reidemeister et al. (2009) suggest that the system is unlikely to be exactly face-on from stability analyses of the planetary configuration. The resolved image at 24 provides very little constraint because the emission at this wavelength is mostly dominated by the central unresolved disk. The resolved image at 70 appears to be relatively azimuthally symmetric. From 100 MIPS observations of a routine calibrator, HD 180711 (G9 III, 447 mJy at 70 ), the measured FWHM ratio is 1.0440.023 for a point source at 70 . The measured FWHM ratio (1.008) of the HR 8799 70 disk suggests a deviation of 1.5- from a face-on symmetric disk. From model images (see discussion in §4.2) constructed for various inclination angles, we can rule out any angles that are larger than 25° because the resultant images give a ratio much larger than the measured value.
3.4. Summary
In summary, the resolved disks at 24 and 70 indicate that the disk around HR 8799 has at least three components: a warm belt inside planet d, a planetesimal disk outside of planet b with extension of 10″, and a surrounding large extended disk. The separation into these three components and their placement relative to the planets in the system appear to be largely independent of assumed grain sizes and optical properties. All of the observed flux densities, including those for the three disk components, are listed in Table 2.
4. Models
We now build on the observational results of the preceding section through more detailed models of the HR 8799 debris disk. Although these specific models are under-constrained and hence not unique, they are guided by models of other debris systems and fit the observations of HR 8799. Therefore, they give a plausible picture of the disk behavior. In § 4.1, we constrain the disk extent by fitting the observed surface brightness profiles with assumed powerlaw profiles that are independent of grain properties. The main purpose of this exercise is to derive spatial information that can be used in a realistic thermal model. In § 4.2, we then utilize the disk components that are inferred from the observations with the adopted grain properties to estimate the physical extent and masses required for the dust in each component.
4.1. Disk Surface Brightness Distributions
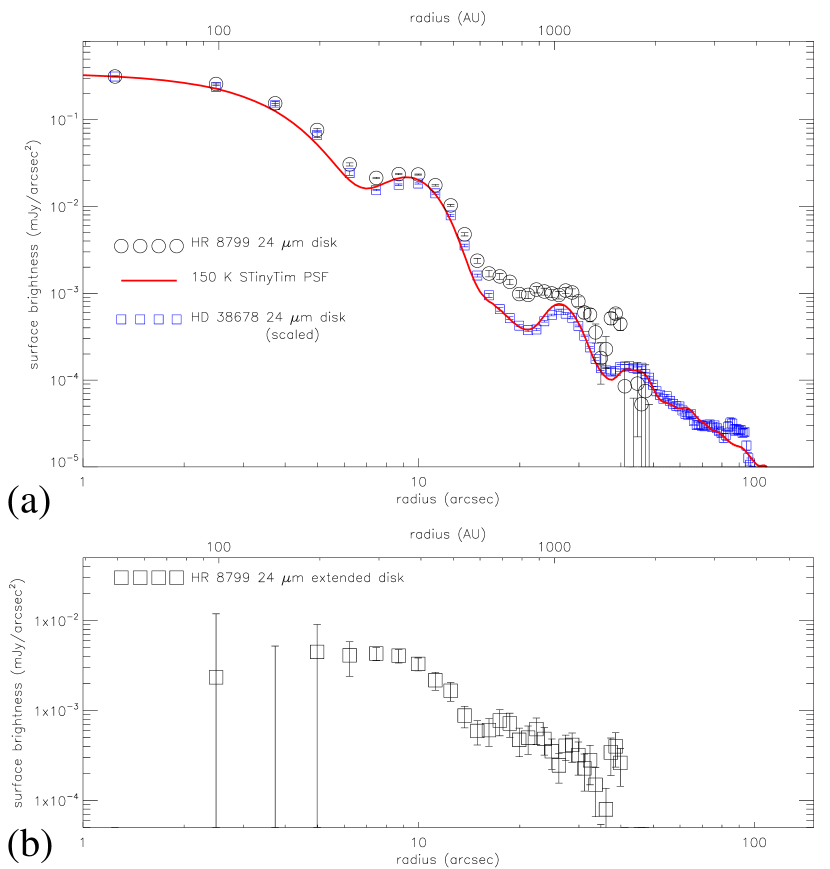
Because of our low angular resolution, it is convenient to characterize the disk using radially averaged surface brightness distributions, represented as a mean value at a given radius and the standard deviation of the mean. For simplicity, we assume that the disk is face-on, so an azimuthally averaged radial profile can be used for modeling. This approximation greatly reduces the noise by averaging the intensity at a given radius (a similar approach has been used on the disks around Vega (Su et al., 2005) and Eri (Backman et al., 2009)). The surface brightness radial profile of the disk (after PSF subtraction for the stellar photosphere and masking out all nearby sources) at 24 is shown in Figure 6a. For comparison, we also show the azimuthally averaged radial profiles of the smoothed theoretical PSF (generated by the STinyTim program, Krist 2006) and the unresolved disk around Lep444Most of the available 24 PSF calibrators are stars and thus have very blue colors compared to the HR 8799 disk. We use the profile of the Lep disk to demonstrate the accuracy of our data reduction and the stability of the Spitzer PSF, by matching the theoretical radial profile over a range in brightness of over more than 4 orders of magnitude. (Su et al. 2009, in prep.) scaled to match the peak flux of the HR 8799 disk. The radial profile of the unresolved Lep disk agrees well with the theoretical PSF, while it is clear that the second dark and the third bright Airy rings of the HR 8799 disk (in the range of 20″ to 30″ from the center) are brighter than for a point source.
By subtracting the scaled radial profile of the Lep disk from the observed radial profile of HR 8799, a rough disk surface brightness distribution for the extended disk component is revealed (Fig. 6b). This component is very faint, 110-3 mJy arcsec-2 at a distance of 1000 AU from the star, similar to the surface brightness level seen at 24 in the Vega disk.
As shown in Figures 5 and 6, the true disk structure is masked by the instrumental PSFs. One way to understand the structure of the disk is to construct a trial surface brightness distribution, convolve it with the beam, and then compare with the observed data. In particular, this approach is a practical way to constrain the true disk outer radius in the low-resolution images. Since our goal is to set constraints on the main planetesimal disk, the 24 profile in the following fits is for the extended disk only. The simplest model is to assume that the surface brightness profile follows a power-law, , between an inner break radius () and outer cut-off radius (). In an optically thin debris disk where the only heating source is the stellar radiation and the disk density is only a function of radius in a power-law form of , the radial surface brightness is then proportional to where is the Planck function, and is the radial-dependent dust temperature (generally, for small grains and for large grains). This simple power-law formula has been used to fit the well-resolved Vega disk at both 24 and 70 , and it was found that the power indices change from for the inner part of the disk to for the outer part of the disk (Su et al., 2005). An inner break point is needed in this simple power-law for steep indices (3 or 4); otherwise, the profile mimics a point source after convolution with the PSF. Because the outermost planet is at a radius of 2″, we also set the disk surface brightness to zero inside 2″, i.e., 0 for 2″ ( stands for ).
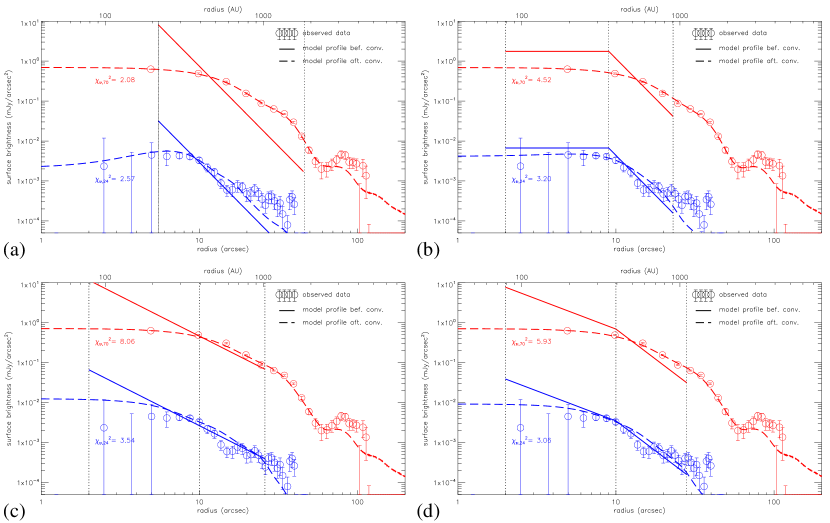
We have tried four different cases for the model surface brightness distribution: (1) a larger inner hole with =4, (2) a flat distribution between and but with =4 outward, (3) a single powerlaw with =2, and (4) two powerlaws with indices of =2 and =3. In all cases, we varied and of the surface brightness distribution (two free parameters) and computed the reduced value to determine the best fit. The reduced value was computed for data points between 5″–40″, and between 5″–75″ at 24 and 70 , respectively. Note that the bright hump seen in the 70 profile between 75″ and 90″ is where the second bright Airy ring is located (see Fig. 5). The match between an observed PSF derived from the calibration stars and theoretical PSF is poor in this range; therefore, we disregard the 70 data points outside 75″ in the modeling. The results are shown in Figure 7.
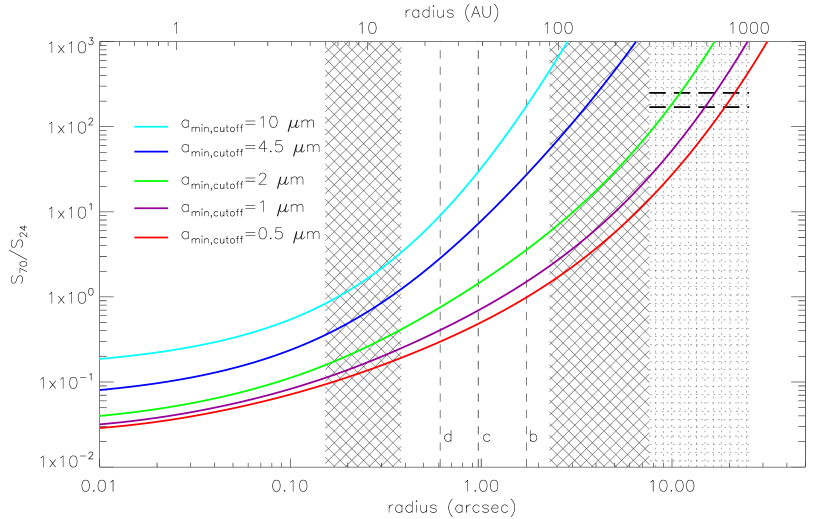
Due to Spitzer’s large beam sizes in the far-infrared, the assumed surface brightness behavior and its number of free parameters needed to describe the model, there is no unique fit for the observed profiles. The best-fit outer radii range from 23″ to 46″, consistent with the previous finding of emission from outside of the submillimeter planetesimal ring (10″). From the model surface brightness profiles, we can also derive the surface brightness ratio () in the extended disk. The ratios range from 170 to 250, which can be used to set constraints on the grain properties since the density-dependent term cancels out in the ratio. Figure 8 shows the expected ratio for a size distribution of with a maximum size cutoff of 10 and various minimum grain size cutoffs () using astronomical silicate grains. Based on the range of derived ratios (represented by the horizontal dashed line in figure 8), the acceptable range of is 2 (=). Outside the main planetesimal disk (10″), only grains with minimum sizes the radiation blowout size have flux ratios in the observed range. This supports the idea that the disk outside of the main planetesimal disk consists of small grains being pushed outward by radiation pressure, i.e., the HR 8799 disk has an extended halo similar to that seen around the Vega disk (Su et al., 2005).
4.2. Specific Disk Models
From the preceding section, we can expand on the description of the three disk components summarized at the end of §3.2: (1) the warm belt inside the innermost planet d has a temperature of 150 K with parameters dubbed as “”; (2) the main planetesimal disk outside the outermost planet b has a temperature of 45 K with parameters dubbed as “” (parent bodies); and (3) the outermost component is small grains strongly affected by photon pressure with parameters dubbed as “”. The basic equations for computing the SED and surface brightness of an optically-thin debris disk can be found in Backman & Paresce (1993), Wolf & Hillenbrand (2003), and Su et al. (2005). To model these structures, we use grain properties for astronomical silicates with a density of 2.5 g cm-3 and a size distribution appropriate for a steady-state collisional cascade (Dohnanyi, 1969). Using the SED of the excess and the resolved images as constraints, we fit the minimum and maximum grain sizes ( and ) in the size distribution and the inner and outer radii of each of the disk components ( and ) by assuming a constant surface density () disk for the strongly bound disk and for the weakly-bound or unbound disk (i.e., the grains affected by photon pressure).
From its characteristic temperature (150 K) and Figure 4, the inner radius of the warm component can be as close as 6 AU if the grains have a size of 10 . However, the spectral shape of the 10 to 20 excess emission is better fit with grains of sizes. In addition, the spectral shape suggests that sub-micron grains are absent, since their emission spectrum would result in higher contrast features at 10 and 20 . We fit the inner warm component as a bound disk with parameters used in Table 3. The dust mass only accounts for the small grains that dominate the mid-IR emission. We lack the constraints, such as the flux of this warm component at longer wavelengths, that would be required to estimate the mass of the population of large grains and parent bodies associated with the warm emission.
It is less straightforward to fit the other two disk components, due to the lack of strong constraints on the size of the planetesimal disk. We can, however, use the following information: (1) we know roughly how much flux comes from the unresolved component (presumably the planetesimal disk) at 70 ; (2) the minimum inner radius of the planetesimal disk is 90 AU, from the characteristic temperature of the cold component in the SED; and (3) large grains (at least a few hundred microns) are required due to the collisional cascade nature of debris disks. The model parameters not only have to provide satisfactory fits to the global SED, but the model images after convolution with the beam sizes have to match the observed images as well. Our modeling strategy is similar to the one applied to the Oph disk (Su et al., 2008); we first tried many combinations of parameters that can provide good fits to the SED, then refined the parameters by matching the observed radial profiles. We started with constraining the parameters for the inner component using data shortward of 30 since they are most sensitive to this component, then used the constraints listed above for the parameters in the other two disk components.
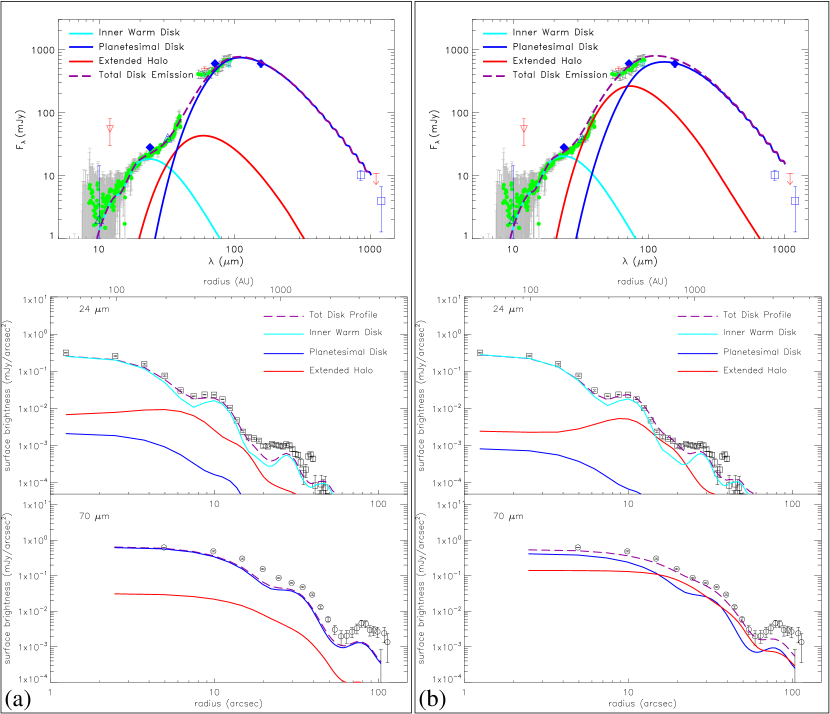
For the planetesimal disk, we fixed and at 1000 and 90 AU, respectively. Additionally, we constrained to be greater than (2 ). For the extended halo disk, was fixed at 1000 AU; and were required to be equal (there is no gap between the planetesimal and halo disks). Initially, we fit the planetesimal disk with a narrow ring () so the actual density distribution has less effect in the output SED. A difficulty in this narrow ring model is that grains smaller than have relatively high thermal equilibrium temperatures at the location where the extended disk starts, and the resultant emission from the inner edge of the halo component is too strong in the 25–35 range. The only way to make the narrow ring model work is to have far less contribution from the extended disk as shown in the SED of Figure 9a (the top panel). However, the resulting model yields insufficient flux from the extended component, and therefore, also shows a disk at 70 that is too small, as shown in the model radial profile (Fig. 9a).
To satisfy all the constraints listed above simultaneously, the outer radius of the planetesimal disk has to extend to 300 AU. Figure 9b shows one of the best-fit models in terms of SED and radial profiles. In this model, the planetesimal disk extends from =90 AU to =300 AU and consists of grains of =10 to =1000 with a total dust mass () of 1.210. The halo disk extends from =300 AU to =1000 AU and consists of grains of =1 to =10 with a total =1.910. Note that the reduced values in the SED fitting are similar between the narrow-ring and broad-disk models; however, the model flux ratio at 70 between the extended component (halo) and the unresolved core (planetesimal disk) is too low compared to the observed ratio (1). This mis-match is best shown in the model surface brightness profile at 70 (bottom panel of Fig. 9a), where the narrow-ring model does not fit the 70 profile at all.
The parameters used and derived in our thermal model for the disk components are listed in Table 3. Because of the ambiguous nature of SED modeling with multiple components and low-resolution images, these model parameters are not unique but were built from the least number of components with simple assumptions that produced a good match to all the available data. One should not take the model grain sizes too literally since they depend greatly on the grain properties used. However, the total dust mass in each of the components remains similar among all of the acceptable models.
| Parameters | Inner Warm Disk | Planetesimal Disk | Halo |
|---|---|---|---|
| () | () | () | |
| (AU) | 6 | 90 | 300 |
| (AU) | 15 | 300 | 1000 |
| () | 1.5 | 10 | 1 |
| () | 4.5 | 1000 | 10 |
| () | 1.110-6 | 1.210-1 | 1.910-2 |
| 2.210-5 | 7.510-5 | 1.010-4 |
5. Discussion
5.1. Debris Disk Structure
The architecture of the HR 8799 planetary system is complex: a warm inner asteroid-belt analog located at a radius of 6–15 AU; a cold Kuiper-belt-analog planetesimal disk located from 90 AU up to 300 AU; three massive planets orbiting between the two disk components; and a prominent halo of small grains extending up to 1000 AU. Similar components (except for imaged planets) have been found in a number of other debris disk systems, indicating some underlying order within the diversity in debris disk structures.
5.1.1 Inner Warm Component
Assuming the grains in the inner belt are astronomical silicates, we can rule out grains of sub-micron size, due to the absence of strong silicate features at 10 and 20 . The shape of the IRS spectrum strongly favors micron sizes for the grains that dominate the emission. If we further assume that all the grains in this component are bound (amin = abl), then the outer radius of this warm component can be as small as 10 AU based on temperature arguments (see the 2 curve in Fig. 4). We also find that the maximum inner radius of this component is around 6 AU, again from temperature arguments. There are few, if any, grains inside this radius. An upper limit on the dust mass inside this inner warm component can be estimated based on the observed IRS excess spectrum. A flux density of 1 mJy at 10 corresponds to a dust mass of 2.310 assuming astronomical silicates of =10 at 3 AU (i.e., T200 K) and a grain density of 2.5 g cm-3. This inner hole can be maintained by ice sublimation if the grains are icy (Jura et al., 1998); a process that will occur at a dust temperature of 150 K. Alternatively, the lack of grains inside 6 AU suggests either that there is another (unseen) interior planet maintaining a dust-free zone, or that the growth of the protoplanets in the terrestrial zone (3–20 AU for an A-type star) at an early stage initiated a collisional cascade that moved outward and created this inner hole (Kenyon & Bromley, 2004). Since we lack constraints such as a measurement of the long wavelength emission from this inner component at higher spatial resolution, we cannot set limits on . Because the dust in this component is warm, very little mass is required, only about 1.110 for dust with an infrared fractional luminosity () of 2.210-5. These values are rough lower limits because it is difficult to place tighter constraints without knowing additional parameters such as .
We also fit the inner warm component with amorphous carbon grains (density of 1.85 g/cm3, Zubko et al. 1996). As expected from the discussion in § 4, the model results for the placement of the disk are not very sensitive to the assumed grain composition ( AU and 15 AU), and we can also rule out a significant amount of sub-micron carbonaceous grains in this inner component because the equilibrium temperature of 150 K places them right at the location of planet c. A similar result of low sensitivity to grain properties is also found in Su et al. (2005), who analyzed the behavior of the Vega system for grains of silicate, carbonaceous, and mixed composition.
A similar inner warm component (T150 K) that dominates the disk emission at the IRS and MIPS 24 wavelengths is seen relatively commonly among resolved debris systems. For example, HR 4796A, Fomalhault, and Eri disks all have such a component (Wahhaj et al., 2005; Stapelfeldt et al., 2004; Backman et al., 2009). In fact, all of their excess SEDs look very similar: a steep inflection between the IRS spectrum and MIPS-SED mode data, indicating a relatively sharp inward-facing edge to the structure dominating the far-infrared emission. This feature may arise from the action of massive planets, as appears to be the case for Fomalhaut (Kalas et al., 2008; Quillen, 2006; Chiang et al., 2009). HD 32297 and Tel are other systems that show similar characteristics revealed by recent ground-based imaging (Moerchen et al., 2007; Fitzgerald et al., 2007; Smith et al., 2009). In addition, a recent IRS spectroscopic study of unresolved debris disks shows that warm components are very common (50%) among A-type excess stars (Morales et al., 2009). In the case of HR 8799, there are strong indications that this warm component is physically separated from the cold, outer component and that there is little dust in the intervening region.
5.1.2 Outer Cold Planetesimal Disk
Our best-fit model appears to indicate too much flux in the submillimeter (Fig. 9) for the cold planetesimal disk. However, the model 850 disk has a FWHM of 178 after being convolved with the nominal 850 beam size of 15″. This slight extension would not be resolved by the 850 observation because the data were taken in photometry mode and no mapping was done. The flux density reported in Williams & Andrews (2006) was calibrated assuming a point source. Therefore, the correct way to compare the model and observed fluxes is to integrate the total flux in a 15″ diameter aperture on the model image. The 850 model flux within a diameter of 15″ is 9.33 mJy, consistent with the SCUBA measurement of 10.31.8 mJy. Similarly, the 1.2 mm flux is also under-estimated for the source extension since it was obtained using the IRAM 30 m single dish telescope (FWHM=95).
The dust mass in the planetesimal disk that is derived from our three-component model is 0.12 , consistent with the mass derived from the 850 observation (0.1 , Williams & Andrews 2006). This is only twice as large as the mass required by the narrow ring model, even though the disk is much larger. The dust mass in this cold component is similar to values derived for disks in the 12 Myr-old Pic moving group ( Pic and HD 15115, Holland et al. 1998; Williams & Andrews 2006). The amount of the excess emission in the HR 8799 disk (=1.5 and =94, compared to the stellar photosphere) is comparable with other debris disks around A-stars of similar age (20–160 Myr) (Su et al., 2006), at least within statistical expectations. The infrared fractional luminosity for this component is 7.510-5, suggesting a collision-dominated disk.
Since the cold component is the birth place for the second-generation debris from collisional cascades, the presence of large grains is required. The inner edge of the disk, although not directly resolved by imaging, has a minimum radius of 90 AU from temperature arguments. We lack high-spatial-resolution submillimeter data to put strong constraints on the outer edge of the planetesimal disk. The outer radius of 300 AU in our model is based on the fewest and most straightforward assumptions.
5.1.3 Halo
Finally, we consider the halo component of the system. The general appearance and extent of this component are similar to the halo around the Vega system. In that case, the Spitzer observations provided sufficient angular resolution to fit the surface brightness profile and show that it is consistent with expectations for grains being blown out by radiation pressure. While the details of this process are complex, it is generally parametrized by , the ratio of radiation pressure force to gravitational force. When collisions produce grains with 1, they will be blown out of the system quickly. When the collisional cascade produces grains over a narrow range of below unity, they will tend to go into elliptical orbits. The behavior of these barely-bound grains has been suggested to explain the broken power-laws seen in the scattered-light disk surface brightness profile around AU Mic (Strubbe & Chiang, 2006) and Pic (Augereau et al., 2001). However, these highly-elliptical orbits will continue to cross the parent body zone and eventually it is likely that these grains will collide again, be broken into smaller ones with and be blown out of the system. Thus, the time scale for mass loss from the system depends on the details of the collisional fragmentation of the grains.
However, qualitatively, the halo around HR 8799 resembles the behavior of Vega closely and differs substantially from the observations of most other A-stars, indicating that both systems are currently undergoing an enhanced level of dynamical stirring in their outer planetesimal disks that leads to an elevated production rate for small grains with near unity. These grains will eventually be ground down to sizes that participate in a general outflow from the system. We therefore model the halo by making assumptions similar to those used for the Vega outflow (Su et al., 2005).
To fit the Vega outflow, grains extending up to about five times the nominal blowout size were required. This apparent discrepancy probably arises because, for simplicity, the models are based on solid, spherical grains, whereas real grains are likely to be non-spherical and complex in structure with a substantial volume of voids (e.g., Dominik et al. 2007 and references therein). The influence of photon pressure will be much larger for such grains than for solid spherical ones. We use in the extended halo component, about five times larger than the blowout size for HR 8799, and other parameters of the model are similar to those used for Vega (Su et al., 2005). The estimated dust mass in the halo is relatively large, 1.9 that is 6 times greater than the mass in the Vega outflow. The terminal radial velocity is 2–4 km s-1 for grains having and that are being produced in the planetesimal disk, 100–300 AU from a 1.5 M☉ star (Moro-Martín & Malhotra, 2005). For a disk radius of 1000 AU, the residence time for such particles is 900–2400 yr. For a static collisionally dominated disk (Wyatt et al., 2007), the expected ratio of mass in blown out grains to that of grains in the bound disk is 1.2% in the HR 8799 system (i.e., a 1.5 M⊙ star with a fractional disk luminosity of 8 and 100 AU). The observed ratio for HR 8799 is 15 times higher, qualitatively similar to the Vega system, where the mass in blown out grains is about 30 times the predicted static level. Both systems have much more prominent halos than systems such as Fomalhaut (Stapelfeldt et al., 2004) and Leo (Stock et al. in prep.). This comparison indicates that there is an elevated level of dynamical activity in the bound disks of Vega and HR 8799 that is enhancing the production of small grains.
Although we have proceeded by analogy with Vega, future work should address the role of weakly bound grains in more detail. The conclusion that the halo indicates more dynamical activity than in A stars without such halos should be robust, but more complete modeling should draw out other aspects of the HR 8799 system.
5.2. Interaction of Planets and Debris
Based on the “resonance overlap” condition in the planar circular restricted three body problem, the width of the chaotic region, , in the vicinity of a planet with mass of and orbital semi-major of orbiting a star with mass of is given by Malhotra (1998),
| (1) |
Adopting the nominal parameters from Marois et al. (2008), stellar mass 1.5 , planet masses 7 and 10 , and semi-major axes 24 or 68 AU for planets d and b, respectively, the width of the unstable zone near each planet is is 8 and 23 AU, respectively. Therefore, the locations of the outer edge of the inner dust belt (15 AU) and the inner edge of the outer belt (90 AU) are both consistent with gravitational sculpting by the innermost known planet d and the outermost known planet b, respectively. The nearly dust-free zone interior to 6 AU may indicate the presence of additional unseen inner planets. If so, then this leads to an estimate of the timescale of inner planet formation of 20–160 Myr given the age of HR 8799. This is in good agreement with theoretical calculations for terrestrial planet accretion (Wetherill, 1992) as well as isotopic constraints on the age of the Earth (Podosek & Ozima, 2000).
The existence of the halo indicates that the outer planetesimal disk is heavily stirred due either to: (1) the planets not being in a stable configuration (Fabrycky & Murray-Clay, 2008; Reidemeister et al., 2009; Goździewski & Migaszewski, 2009); (2) planet migration and orbital resonance crossings that are causing extreme excitation in the planetesimal disk, as in models for the Kuiper Belt (Malhotra, 1995) and for the Late Heavy Bombardment (Gomes et al., 2005); or (3) processes in the planetesimal disk itself, such as ongoing formation of (unseen) ice giants or planetary embryos that stir the disk (Kenyon & Bromley, 2008). The first two possibilities relate the dynamical activity in the planetesimal disk to issues associated with the stability of the configuration of the three known planets, while the third hypothesis would be independent of the planets. Although no specific conclusions can be drawn, the outcomes of any of these scenarios are a heavily stirred planetesimal disk that produces an era of enhanced collisional activity. The resulting collisional cascades and avalanches will feed an outflow of small grains (Grigorieva et al., 2007).
5.3. The Background Cloud near HR 8799 and the -Bootis Phenomenon
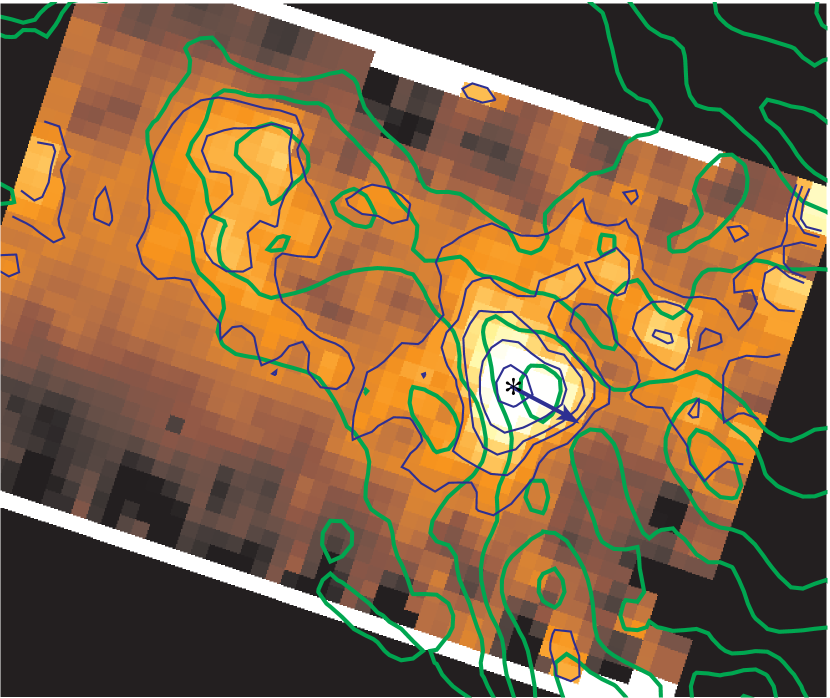
The cirrus seen at 160 resembles some of the large-scale structure in the CO (3-2) cloud detected by Williams & Andrews (2006). Figure 10 shows a new, 7′7′ CO (3-2) map at 15″ resolution around HR 8799, taken with the HARP heterodyne array on the JCMT, overlaid on the Spitzer 160 map. The CO emission is integrated in the local standard of rest (LSR) velocity from -4 to -6 km s-1. The radial velocity of the star, -12.40.5 km s-1, from Moór et al. 2006 is in the heliocentric velocity frame, however, and converts to -4.6 km s-1 LSR. Thus, contrary to the conclusion in Williams & Andrews (2006), we cannot say that the cloud is not associated with HR 8799 and cannot place any limits on the gas content of the disk from these observations. This is also further confirmed by the new IRAM 30-m observation that found strong CO (2-1) line emission due to the cloud at the heliocentric radial velocity of HR 8799 (Hily-Blant, Kastner, Forveille & Zuckerman, in prep.)
This new JCMT CO (3-2) map is larger and of higher quality than the map presented in Williams & Andrews (2006) and shows the extended, low level molecular emission in more detail. It appears to be associated with the extended arc of high latitude clouds, MBM 53-55, detected in CO (1-0) by Magnani et al. (2000). The distance of these objects and their relation to one another is not well known. If the association with the star is physical then, at 40 pc, this would be the closest known molecular cloud.
Whether physically associated or not, it is likely that the low flux levels (1-3) of the 160 emission come from the molecular cloud. The asymmetry in the outer part of the observed source at this wavelength may also be due to cloud contamination. Nevertheless, the detected source (with the peak flux 8-) is coincident with the expected stellar position, which is offset (20″) from the central emission of the nearby clump in the cloud. The cloud therefore contributes only a very small amount of flux that cannot be completely removed from our aperture photometry. At 70 , there is no resemblance to the large-scale background structure in the data nor an asymmetry seen in the source morphology; therefore, we can rule out any significant contribution from this extended background cloud to the 70 disk emission.
The arrow in Figure 10 shows the direction of proper motion of HR 8799 (RA = 107.93 mas yr-1 and Dec = –49.63 mas yr-1; van Leeuwen 2007). Given the coincidence in space and velocity, it is plausible that accretion from the cloud might explain the abundance anomalies leading to the Bootis designation (Kamp & Paunzen, 2002). Using equation (16) from Martínez-Galarza et al. (2009) for Bondi-Hoyle accretion implies a mass accretion rate of with an assumed density of 100 cm-3, just above the threshold to produce Bootis behavior (Turcotte & Charbonneau, 1993). However, this calculation assumes a fluid model for the ISM, which is not strictly applicable at the expected density (Martínez-Galarza et al., 2009). Therefore, the accretion rates may be significantly lower than indicated (Alcock & Illarionov, 1980). The accretion hypothesis rests on the untested assumption that the rate can be increased through such means as small scale high-density structures in the ISM and/or increases in density in the wake of the star.
6. Conclusions
We have obtained deep infrared images and spectra of the debris system around HR 8799. To our surprise at the distance of 40 pc, the HR 8799 disk is clearly resolved at both 24 and 70 ; the outer boundary of the disk can be traced further than 1000 AU. From general, model-independent considerations, the star appears to have one zone of warm dust within the orbit of its innermost known planet, another broad zone of cold dust outside the orbit of its outermost known planet, and an extended halo of small grains from this outer zone.
We have constructed detailed models of the system, guided by models of other debris systems as well as the observations of HR 8799. Although the models are not unique, because we draw on experience in modeling many debris systems, they should give a reasonably accurate picture of conditions in the HR 8799 system. The models indicate that the inner zone lies between 6 and 15 AU with a total dust mass of 1.110 and the outer zone is between 90 and 300 AU with a dust mass of 1.210. There is little dust inside the inner zone (6 AU) and in between the inner and outer cold zones where the three planets reside. The halo extends to at least 1000 AU and has a dust mass of 1.910, about 15 times the level expected for a static, quiescent debris system. The implied high level of dynamical activity in the HR 8799 debris system may be related to perturbations imposed by its system of three massive planets or may be signaling ongoing planet formation in the outer parts of this system.
HR 8799 is at an age similar to that of the solar system when the terrestrial planets formed, along the way to settling into the final configuration. The planetary system of HR 8799 (both planets and debris disk) provide an intriguing snapshot of processes occurring at this stage and may help us understand the formation and evolution of our own planetary system.
References
- Alcock & Illarionov (1980) Alcock, C., & Illarionov, A. 1980, ApJ, 235, 541
- Augereau et al. (2001) Augereau, J. C., Nelson, R. P., Lagrange, A. M., Papaloizou, J. C. B., & Mouillet, D. 2001, A&A, 370, 447
- Backman & Paresce (1993) Backman, D. E., & Paresce, F. 1993, Protostars and Planets III, 1253
- Backman et al. (2009) Backman, D., et al. 2009, ApJ, 690, 1522
- Beichman et al. (2005) Beichman, C. A. et al. 2005, ApJ, 626, 1061
- Bondi & Hoyle (1944) Bondi, H., & Hoyle, F. 1944, MNRAS, 104, 273
- Castelli & Kurucz (2003) Castelli, F., & Kurucz, R. L. 2003, IAU Symposium, 210, 20P
- Chen et al. (2006) Chen, C. H., et al. 2006, ApJS, 166, 351
- Chen et al. (2009) Chen, C. H., Sheehan, P., Watson, D. M., Manoj Puravankara, P., & Najita, J. R. 2009, arXiv:0906.3744
- Chiang et al. (2009) Chiang, E., Kite, E., Kalas, P., Graham, J. R., & Clampin, M. 2009, ApJ, 693, 734
- Cowley et al. (1969) Cowley, A., Cowley, C., Jaschek, M., & Jaschek, C. 1969, AJ, 74, 375
- Dohnanyi (1969) Dohnanyi, J. W. 1969, J. Geophys. Res., 74, 2531
- Dominik et al. (2007) Dominik, C., Blum, J., Cuzzi, J. N., & Wurm, G. 2007, Protostars and Planets V, 783
- Engelbracht et al. (2007) Engelbracht, C. W., et al. 2007, PASP,119, 994
- Fabrycky & Murray-Clay (2008) Fabrycky, D. C., & Murray-Clay, R. A. 2008, arXiv:0812.0011
- Fitzgerald et al. (2007) Fitzgerald, M. P., Kalas, P. G., & Graham, J. R. 2007, ApJ, 670, 557
- Goździewski & Migaszewski (2009) Goździewski, K. & Migaszewski, C. 2009, astro-ph/0904.4106
- Gomes et al. (2005) Gomes, R., Levison, H. F., Tsiganis, K., & Morbidelli, A. 2005, Nature, 435, 466
- Gordon et al. (2005) Gordon, K. D., et al. 2005, PASP, 117, 503
- Gordon et al. (2007) Gordon, K. D., et al. 2007, PASP, 119, 1019
- Gray & Kaye (1999) Gray, R. O., & Kaye, A. B. 1999, AJ, 118, 2993
- Grigorieva et al. (2007) Grigorieva, A., Thébault, P., Artymowicz, P., & Brandeker, A. 2007, A&A, 475, 755
- Hillenbrand et al. (2008) Hillenbrand, L. A., et al. 2008, ApJ, 677, 630
- Holland et al. (1998) Holland, W. S., et al. 1998, Nature, 392, 788
- Houck et al. (2004) Houck, J. R., et al. 2004, ApJS, 154, 18
- Jura et al. (1998) Jura, M., Malkan, M., White, R., Telesco, C., Pina, R., & Fisher, R. S. 1998, ApJ, 505, 897
- Kalas et al. (2008) Kalas, P., et al. 2008, Science, 322, 1345
- Kamp & Paunzen (2002) Kamp, I., & Paunzen, E. 2002, MNRAS, 335, L45
- Kenyon & Bromley (2004) Kenyon, S. J., & Bromley, B. C. 2004, ApJ, 602, L133
- Kenyon & Bromley (2008) Kenyon, S. J., & Bromley, B. C. 2008, ApJS, 179, 451
- Krist (2006) Krist, J. E. 2006, Spitzer Tiny TIM User’s Guide Version 2.0
- Lafrenière et al. (2009) Lafrenière, D., Marois, C., Doyon, R., & Barman, T. 2009, ApJ, 694, L148
- Lagrange et al. (2008) Lagrange, A. -., et al. 2008, arXiv:0811.3583
- Laor & Draine (1993) Laor, A. & Draine, B. T. 1993, ApJ, 402, 441
- Lowrance et al. (2005) Lowrance, P. J., et al. 2005, AJ, 130, 1845
- Lu et al. (2008) Lu, N., et al. 2008, PASP, 120, 328
- Magnani et al. (2000) Magnani, L., Hartmann, D., Holcomb, S. L., Smith, L. E., & Thaddeus, P. 2000, ApJ, 535, 167
- Malhotra (1995) Malhotra, R. 1995, AJ, 110, 420
- Marois et al. (2008) Marois, C., Macintosh, B., Barman, T., Zuckerman, B., Song, I., Patience, J., Lafrenière, D., & Doyon, R. 2008, Science, 322, 1348
- Martínez-Galarza et al. (2009) Martínez-Galarza, J. R., Kamp, I., Su, K. Y. L., Gáspár, A., Rieke, G., & Mamajek, E. E. 2009, ApJ, 694, 165
- Meyer et al. (2006) Meyer, M. R., Backman, D. E., Weinberger, A. J., & Wyatt, M. C. 2007, in Protostars and Planets V, (Tucson: Univ. Arizona Press), 57
- Moór et al. (2006) Moór, A., Ábrahám, P., Derekas, A., Kiss, C., Kiss, L. L., Apai, D., Grady, C., & Henning, T. 2006, ApJ, 644, 525
- Malhotra (1998) Malhotra, R. 1998, Solar System Formation and Evolution, ASP Conference Series, 149, 37
- Moerchen et al. (2007) Moerchen, M. M., Telesco, C. M., De Buizer, J. M., Packham, C., & Radomski, J. T. 2007, ApJ, 666, L109
- Morales et al. (2009) Morales, F. Y., et al. 2009, ApJ, 699, 1067
- Moro-Martín & Malhotra (2005) Moro-Martín, A., & Malhotra, R. 2005, ApJ, 633, 1150
- Podosek & Ozima (2000) Podosek, F. A., & Ozima, M. 2000, Origin of the earth and moon, edited by R.M. Canup and K. Righter and 69 collaborating authors. Tucson: University of Arizona Press., p.63-72, 63
- Quillen (2006) Quillen, A. C. 2006, MNRAS, 372, L14
- Reidemeister et al. (2009) Reidemeister, M., et al. 2009, A&A, in press.
- Rhee et al. (2008) Rhee, J. H., Song, I., & Zuckerman, B. 2008, ApJ, 675, 777
- Rieke et al. (2004) Rieke, G. H., et al. 2004, ApJS, 154, 25
- Royer et al. (2007) Royer, F., Zorec, J., & Gómez, A. E. 2007, A&A, 463, 671
- Sadakane, K. (2006) Sadakane, K. 2006, PASJ, 58, 1023
- Smith et al. (2009) Smith, R., Churcher, L. J., Wyatt, M. C., Moerchen, M. M., & Telesco, C. M. 2009, A&A, 493, 299
- Song et al. (2005) Song, I., Zuckerman, B., Weinberger, A. J., & Becklin, E. E. 2005, Nature, 436, 363
- Stansberry et al. (2007) Stansberry, J. A., et al. 2007, PASP, 119, 1038
- Stapelfeldt et al. (2004) Stapelfeldt, K. R., et al. 2004, ApJS, 154, 458
- Strubbe & Chiang (2006) Strubbe, L. E., & Chiang, E. I. 2006, ApJ, 648, 652
- Su et al. (2005) Su, K. Y. L., et al. 2005, ApJ, 628, 487
- Su et al. (2006) Su, K. Y. L., et al. 2006, ApJ, 653, 675
- Su et al. (2008) Su, K. Y. L., et al. 2008, ApJ, 679, 125
- Sylvester et al. (1996) Sylvester, R. J., Skinner, C. J., Barlow, M. J., & Mannings, V. 1996, MNRAS, 279, 915
- Turcotte & Charbonneau (1993) Turcotte, S., & Charbonneau, P. 1993, ApJ, 413, 376
- van Dishoeck (1992) van Dishoeck, E. F. 1992, Chemistry and Spectroscopy of Interstellar Molecules, 69
- van Leeuwen (2007) van Leeuwen, F. 2007, A&A, 474, 653
- Wahhaj et al. (2005) Wahhaj, Z., Koerner, D. W., Backman, D. E., Werner, M. W., Serabyn, E., Ressler, M. E., & Lis, D. C. 2005, ApJ, 618, 385
- Werner et al. (2004) Werner, M. W., et al. 2004, ApJS, 154, 1
- Williams & Andrews (2006) Williams, J. P., & Andrews, S. M. 2006, ApJ, 653, 1480
- Wetherill (1992) Wetherill, G. W. 1992, Icarus, 100, 307
- Wolf & Hillenbrand (2003) Wolf, S., & Hillenbrand, L. A. 2003, ApJ, 596, 603
- Wyatt et al. (2007) Wyatt, M. C., Smith, R., Su, K. Y. L., Rieke, G. H., Greaves, J. S., Beichman, C. A., & Bryden, G. 2007, ApJ, 663, 365
- Wyatt (2008) Wyatt, M. C. 2008, ARA&A, 46, 339
- Zubko et al. (1996) Zubko, V. G., Mennella, V., Colangeli, L., & Bussoletti, E. 1996, MNRAS, 282, 1321
- Zuckerman & Song (2004) Zuckerman, B., & Song, I. 2004, ApJ, 603, 738