Universal enhancement of the optical readout fidelity of single electron spins
Abstract
Precise readout of spin states is crucial for any approach towards physical realization of a spin-based quantum computer and for magnetometry with single spins. Here, we report a new method to strongly improve the optical readout fidelity of electron spin states associated with single nitrogen-vacancy (NV) centers in diamond. The signal-to-noise ratio is enhanced significantly by performing conditional flip-flop processes between the electron spin and the nuclear spin of the NV center´s nitrogen atom. The enhanced readout procedure is triggered by a short preparatory pulse sequence. As the nitrogen nuclear spin is intrinsically present in the system, this method is universally applicable to any nitrogen-vacancy center.
The negatively charged nitrogen-vacancy (NV) center in diamond exhibits numerous outstanding properties which make it a promising candidate for novel applications in quantum and imaging science. Impressive experiments have demonstrated its potential as a solid-state qubit at room temperature jelezko-prl04 ; hanson-nature08 ; stoneham-physics09 , for nanoscale magnetometry gopi-nature08 ; maze-nature08 ; lukin-naturephys08 and for probing spin dynamics at nanoscale childress-science06 ; hanson-science08 . The coherence times of its electron spin are the longest reported for any solid-state system at room-temperature gopi-naturemat09 ; nori-prb09 . The use of nearby single nuclear spins as additional resource for quantum information wrachtrup-01 allows a variety of applications, from conditional quantum gates jelezko-prl04-2 and storage of quantum information to realization of small quantum registers and multi-partite entanglement neumann-science2008 ; lukin-science2007 . In all these experiments, the quantum information stored in the spin system is read out optically by recording spin-state dependent fluorescence rates of the NV center nizovtsev-physicaB2001 ; manson-prb06 . Even single nuclear spin qubits can be read out via the NV center by coherent mapping of the nuclear spin state onto the electron spin jelezko-prl04-2 .
Therefore, the overall readout fidelity of any application is limited by the signal-to-noise ratio of the optical readout process of the NV center.
Very recently significant fidelity enhancement was achieved by mapping the electron spin state onto 13C nuclear spins and repetitive readout lukin-science09 .
In this Letter, we report a novel and universal method to enhance the signal-to-noise ratio of the optical readout process of NV center spins. To this end we exploit the spin dynamics of the intrinsic nitrogen nuclear spin that rely on a level-anticrossing (LAC) in the NV center´s excited state neumann-njp09 ; fuchs-prl08 ; jacques-prl09 to obtain a threefold enhancement in signal per readout step.
This speeds up the data acquisition process by a factor of 3 and corresponds to an increase of the signal-to-noise ratio by a factor of .
As the method exclusively utilizes interactions with the intrinsic nitrogen nucleus, its feasibility does not depend on the presence of further ancilla spins.
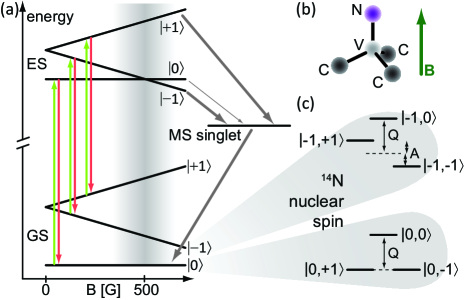
The NV center consists of a substitutional nitrogen atom and an adjacent vacancy (see Fig. 1(b)). Optical excitation of the transition between electronic ground and excited state gives rise to strong fluorescence which enables optical detection of individual NV centers by standard confocal microscopy techniques gruber-science97 . Ground and excited states are electron spin triplets (Fig. 1(a)). If the nitrogen atom is a 14N isotope (99,6% abundance, I=1), each electron spin state is further split into three hyperfine substates (Fig. 1(c)). Optical cycles between ground and excited state are spin-conserving manson-prb06 . However, intersystem crossing (ISC) rates to an intermediate metastable singlet state are strongly spin-dependent. As the system cannot undergo optical cycles while being trapped in the singlet state ( 250 ns manson-prb06 ), it remains dark during this time. Hence, the average fluorescence intensity depends on the spin state. ISC occurs mainly from the mS=1 () levels which therefore constitute "dark states", whereas the mS=0 () level constitutes a "bright state" with a higher average fluorescence intensity. ISC from the singlet state back to the ground state preferentially ends up in , leading to a strong polarization of the electron spin under optical excitation harrison-jlumin04 .
The ground state spin triplet represents the logic qubit or the magnetic sensor. It is initialized to by a nonresonant laserpulse (532 nm). The operating transition used in this Letter is the transition between and (see Fig. 2(a)). Unitary qubit control or magnetic sensing is performed by common microwave pulse techniques under dark conditions. The output of the operation encoded in the spin state is read out optically by application of a readout laserpulse and detection of the fluorescence response. Fig. 2(a) shows the accumulated number of response photons per ns upon a readout laserpulse for the observed NV center initially being in spin state . If the initial spin state is , the pulse shows a high initial fluorescence level which decays towards a steady-state value with non-zero population in the singlet state due to a small probability for ISC from . For , the initial fluorescence decays fast towards a low level due to a high ISC rate to the singlet state. As the singlet state always decays to spin state in the ground state manson-prb06 , the low fluorescence level decays to the steady-state value within the lifetime of the singlet state of about 250 ns.
The signal used to discriminate the spin states is the difference in the number of photons collected during the readout laserpulse (see grey area in Fig. 2(a)).
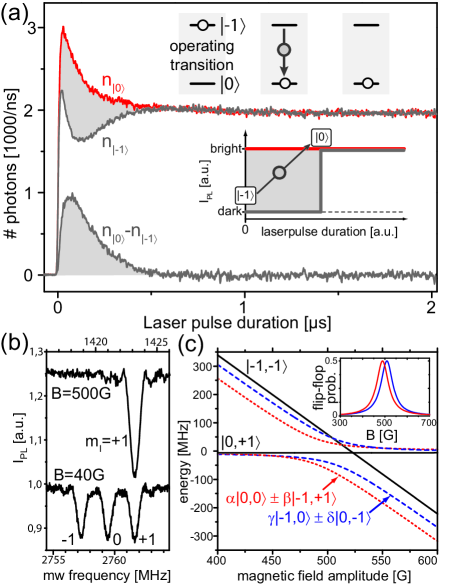
Note that for spin state , the system passes once through the singlet state before being polarized. After polarization, all information about the initial spin state is destroyed and the system is in its steady state . Hence, the signal per readout pulse is limited by the optical polarization rate of the electron spin which is given by the lifetime of the singlet state ( 250 ns) and is on the order of 4 MHz. If fluorescence photons could be detected at a higher rate than 4 MHz, single passages through the singlet state could be observed as completely dark intervals in the fluorescence signal. However, as currently achievable photon countrates ( 300 kHz at room temperature) are far below this threshold, readout has to be performed by repetitive accumulation of fluorescence signal with a concomitant increase in measurement time.
We now demonstrate a method to decrease the measurement time (increase the number of signal photons per shot) for the spin state of single NV centers by a factor of 3 by exploiting the spin dynamics of the 14N nitrogen nuclear spin (I=1). We make use of a recently discovered nuclear spin polarization mechanism jacques-prl09 that is mediated by a level anti-crossing (LAC) in the excited state neumann-njp09 . Note that this mechanism has been demonstrated for a 15N nucleus (I=1/2), however, it works analogously for 14N. Spin states will be denoted by in the following.
At a magnetic field of 500G (B || NV-axis), the mS=0 and the mS=-1 branch of the NV center electron spin are expected to cross in the excited state (see grey region in Fig. 1(a)). However, due to strong hyperfine coupling between electron and nitrogen nuclear spin in the excited state ( 20 times stronger than in the ground state fuchs-prl08 ), there is LAC between spin states and resp. and , associated with strong spin mixing (see Fig.2(c)). This allows energy-conserving flip-flop processes between electron and nuclear spin. These are not possible for spin states and which therefore are not affected by mixing. Under optical illumination, the electron spin is steadily polarized into . Thus, the only stable spin state is . As a result, optical illumination leads to strong polarization of the system into at B500G (see spectra in Fig. 2(b)).
If the system is now prepared in spin state before application of the readout laserpulse, it has to pass three times through the singlet state instead of one in a cascade-like process before reaching the bright steady state . As each passage through the singlet state yields the same amount of signal as obtained by conventional readout, the total signal is tripled.
The detailed process occuring upon application of a readout laserpulse is illustrated in Fig. 3(a).
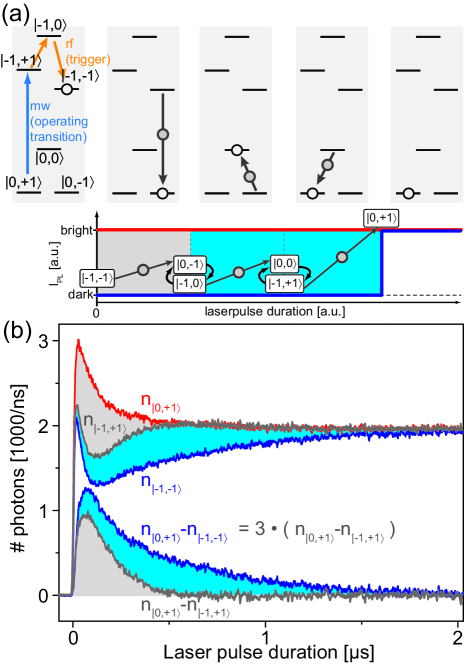
Starting from spin state , the system once passes through the singlet state as the electron spin is polarized. This process yields the signal (grey area in Fig. 3(a)) obtained equivalently by conventional readout. The passage through the singlet state (grey arrows with dots in Fig. 3(a)) is assumed to conserve the nuclear spin state, hence the system ends up in . The system is now repumped to the excited state by the same readout laserpulse. There it has a certain probability to perform the flip-flop process due to the strong mixing between these two spin states (see Fig.2(c)). Thus, it has the two possibilities of either performing an optical cycle under emission of a fluorescence photon or performing an electron-nuclear flip-flop process. As optical cycles are spin-conserving, a flip-flop process will finally occur and the system will be in . From there, it will pass a second time through the singlet state, additionally giving rise to the same amount of signal as before (blue area in Fig. 3(a)). After the second relaxation via ISC, the system will be in state . It will now again be reexcited, where the spin states and are mixed. As before, the system will inevitably perform a spin flip-flop with subsequent passage through the singlet state, again yielding additional signal. After this third ISC-relaxation, the system will be in the bright steady state , which yields a constant level of fluorescence intensity.
The fluorescence responses for conventional (grey trace) and enhanced readout (blue trace) are compared in Fig. 3(b). The lower traces show the difference in fluorescence between bright and dark state for both cases. The colored areas represent the amount of signal photons and show the expected threefold enhancement.
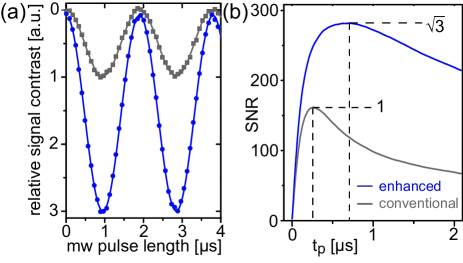
The amount of signal photons saturates with increasing pulse duration while the noise arising from the poissonian distribution of collected photons (shot noise) grows approximately as the squareroot of the pulselength. Hence, there is an optimal readout pulselength which maximizes the signal-to-noise ratio (). The signal acquired during the initial time interval of the fluorescence pulses is (grey area for mI=+1 in Fig. 3(b) and grey + dark blue area for mI=-1). is given by . The shot noise is the squareroot of the total number of collected photons, . The is
| (1) |
It has a global maximum at an optimal readout pulselength (see Fig. 4(b)).
For enhanced readout, both the signal and the time required for signal formation are increased by a factor of 3. Thus, the maximum is enhanced by (see Fig. 4(b)) and shifted to a longer pulselength. Fig. 4(a) shows electron Rabi oscillations recorded with conventional and enhanced readout. The experimental results exhibit the behaviour predicted by our model.
In practice, enhanced readout is implemented as follows: After execution of a desired pulse sequence on the operating transition (see arrow in Fig. 3(a)), two consecutive resonant radiofrequency -pulses on the nuclear spin transitions and (see orange arrows in Fig. 3(a)) are applied right before application of the readout laserpulse. Nuclear spin transitions can be driven selectively up to Rabi frequencies on the order of MHz. Thus, the time required to trigger the enhanced readout is on the order of a few s. At B=500G, the optimum pulselength for the enhanced fluorescence response is extended by about 500 ns. Hence, the enhanced readout method already pays if the length of the complete pulse sequence is on the order of a few s, which is fulfilled in most cases.
The most critical parameter of enhanced readout is the angle between magnetic field and the NV axis jacques-prl09 . The magnetic field can be varied over a wide range (200G) without losing the polarization effect (see jacques-prl09 ). However, as the flip-flop probability decreases with distance from the LAC (see inset in Fig. 2(c)), the signal formation process is slowed down which leads to decrease of the maximum . At 50G from the LAC, the enhancement is about half the maximum value.
The method has been demonstrated for NV centers containing a 14N atom (I=1), however, it works analogously for 15N (I=1/2), where a enhancement of is achievable by a single rf pulse. Note that this is the first demonstration of rf-control of a single nitrogen nuclear spin which proves its suitability as an additional qubit intrinsic to the NV center.
Summarizing, we presented a fast universal method to enhance the signal-to-noise ratio of the optical readout process of the NV center in diamond.
The measurement time required to determine the spin state of the system is reduced by a factor of 3.
This allows for faster room-temperature access to quantum information stored in the individual solid-state spin system and speeds up data acquisition in spin-based magnetometry.
Further enhancement can be achieved by including those 13C nuclear spins that are polarized at magnetic fields corresponding to the excited state LAC jacques-prl09 ; childress-arx09 .
References
- (1) F. Jelezko et al., Phys. Rev. Lett. 92, 7 (2004).
- (2) R. Hanson and D. D. Awschalom, Nature 453, 1043 (2008)
- (3) M. Stoneham, Physics 2, 34 (2009)
- (4) G. Balasubramanian et al., Nature 455, 648 (2008).
- (5) J. R. Maze et al., Nature 455, 644 (2008).
- (6) J. M. Taylor et al., Nature Physics 4, 810 (2008).
- (7) L. Childress et al., Science 314, 5797 (2006).
- (8) R. Hanson et al., Science 320, 5874 (2008).
- (9) G. Balasubramanian et al., Nature Materials 8, 383 (2009).
- (10) N. Mizuochi et al., Phys. Rev. B 80, 041201(R) (2009).
- (11) J. Wrachtrup, S. Ya. Kilin, and A. P. Nizovtsev, Optics and Spectroscopy 91, 3 (2001).
- (12) F. Jelezko et al., Phys. Rev. Lett. 93, 13 (2004).
- (13) P. Neumann et al., Science 320, 1326 (2008).
- (14) M. V. Gurudev Dutt et al., Science 316, 1312 (2007).
- (15) A. P. Nizovtsev et al., Physica B 308-310, 608-611 (2001).
- (16) N. B. Manson, J. P. Harrison, and M. J. Sellars, Phys. Rev. B 74, 104303 (2006).
- (17) L. Jiang, et al., Science DOI: 10.1126/science.1176496
- (18) P. Neumann et al., NJP 11, 013017 (2009).
- (19) G. D. Fuchs et al., Phys. Rev. Lett. 101, 117601 (2008).
- (20) V. Jacques et al., Phys. Rev. Lett. 102, 057403 (2009).
- (21) A. Gruber et al., Science 276, 2012 (1997).
- (22) R. H. Clarke, Triplet State ODMR Sectroscopy (John Wiley & sons, New York, 1982).
- (23) J. Harrison, M. J. Sellars, and N. B. Manson, J. Lumin. 107, 245 (2004).
- (24) B. Smeltzer, J. McIntyre, and L. Childress, arXiv:0909.3896v1
- (25) All experiments have been carried out in type IIa diamond samples.
- (26) We acknowledge financial support by the European Union (QAP, EQUIND, and NEDQIT) and Deutsche Forschungsgemeinschaft (SFB/TR21).
I Additional material
In this additional online material we explain the spin Hamiltonian and the important interactions in more detail. In addition the 14N nuclear spin spectra are presented. To record them the new signal enhancement method has been used.
I.1 The NV Hamiltonian
For the NV center with a 14N isotope the spin Hamiltonian for the ground state is
| (2) |
where the first and second terms express electron spin energies with the zero field splitting MHz of levels and and the Zeeman energy with the electron g-factor and the Bohr-magneton .
The third term is the hyperfine interaction between NV center’s electron spin and the nuclear spin of its 14N atom.
As the electron spin the nuclear spin is a triplet .
It leads to a splitting of MHz.
For simplicity we assume an isotropic hyperfine interaction which is sufficient to explain the spectra in the paper.
Finally, the fourth and fifth term describe the energies of the nuclear spin with its quadrupole splitting and its nuclear Zeeman energy where is the nuclear spin g-factor and the nuclear magnetic moment.
In this Hamiltonian the magnetic field is assumed parallel to the NV-axis (z-direction) as was the case in the performed experiments.
The resulting electron spin energy levels as a function of the magnetic field are displayed in Fig. 1(a) of the main paper and their nuclear spin sublevels are depicted in Fig. 1(c).
The electron spin transition between states and for two magnetic field strengths is shown in fig. 2(b) of the main paper.
In the lower spectrum the hyperfine splitting is visible.
It is absent in the upper spectrum because the nuclear spin is polarized in state .
The excited state Hamiltonian basically looks the same.
Only the constants change.
The zero field splitting becomes MHz Sneumann-njp09 ; Sfuchs-prl08 , and the hyperfine splitting is MHz (see Fig. 5).
Again we assume an isotropic hyperfine interaction.
The fact that the polarization mechanism for the nuclear spin mentioned in the paper works well underlines that there must be substantial off-diagonal terms in the hyperfine interaction of the excited state.
In Fig. 2(c) of the main paper, the calculated eigenvalues of the excited state Hamiltonian in the basis , , , , and are drawn as a function of the magnetic field amplitude.
The inset shows the probability for a spin flip-flop between electron and nuclear spin as a function of B. It has been calculated from the coefficients of the basis states participating in a flip-flop process (see Sjacques-prl09 for details).
I.2 nuclear spin manipulation
For the enhanced readout technique, the nuclear spin has to be manipulated.
Therefore, first of all the nuclear transition frequencies in electron spin state and have to be obtained.
This is done by a combined pulsed and cw technique which is sketched in Fig. S6(a).
The signal gained in this experiment already uses the enhancement technique.
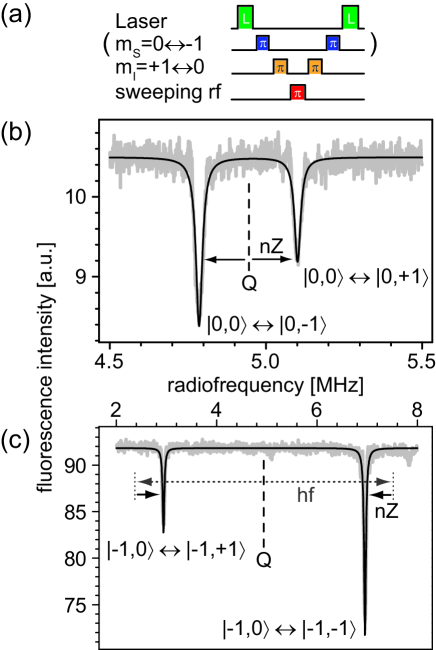
At first a magnetic field of 500 Gauss is applied parallel to the NV axis ( direction) as in the paper.
A laser pulse initializes the system into .
A subsequent microwave (mw) pulse (not necessary for operation in ) converts it into .
In a next step a radiofrequency (rf) pulse resonant on transition yields state .
Out of this starting state a rf pulse with sweeping frequency is applied.
Finally population in is converted back to which is the only bright state.
The population here is read out by a final laser pulse which is in fact the first laser pulse of the next run.
This sequence is continuously repeated while the frequency of the sweeping pulse is changed and the corresponding fluorescence is recorded.
If the swept frequency hits the resonance for transitions or no population ends up in bright state .
It is then either in or in .
In this case the final laser pulse eventually forces the nuclear spin to flip and pass through the metastable state which gives the signal as explained in the paper.
Note, that the electron spin state is already before the readout laser pulse so that it does not have to flip and does not contribute to the signal. This means that the nuclear spin state is read out without mapping it onto the electron spin due to the nuclear spin state selective flip-flop processes in the excited state.
Be also aware, that the signal for spin state is twice as high as the one for because the system has to pass the metastable state twice instead of once.
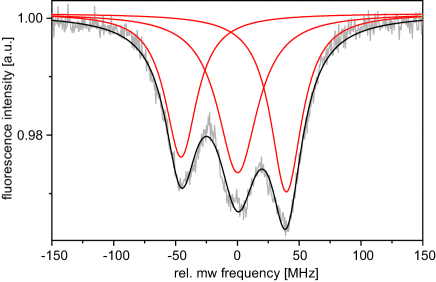
The resulting nuclear spin spectra are shown in Fig. S6(b,c).
From there a quadrupole splitting of MHz can be deduced and the hyperfine splitting is MHz.
These values have been obtained for a few centers in different samples and have agreed within the given bounds.
Nevertheless, they show small deviation from earlier obtained values Smanson-joptb99 .
The presented method is universal in the sense that the nitrogen nuclear spin is present for every NV center. For NV centers that have certain 13C nuclear spins in their vicinity, the signal-to-noise ratio can even be further enhanced. For participating nuclei with spin In, the enhancement is given by . Note that this is true only for nuclear spins which have the same quantization axis as the NV center electron spin and which participate in energy conserving flip-flop processes mediated by the excited state LAC leading to nuclear spin polarization Schildress-arx09 .
References
- (1) P. Neumann et al., NJP 11, 013017 (2009).
- (2) G. D. Fuchs et al., Phys. Rev. Lett. 101, 117601 (2008).
- (3) V. Jacques et al., Phys. Rev. Lett. 102, 057403 (2009).
- (4) Ch. Wei, and N. B. Manson, J. Opt. B: Quantum Semiclass. Opt. 1, 464-468 (1999).
- (5) B. Smeltzer, J. McIntyre, and L. Childress, arXiv:0909.3896v1