A strong excess in the 20-100 keV emission of NGC 1365
Abstract
We present a new Suzaku observation of the obscured AGN in NGC 1365, revealing an unexpected excess of X-rays above 20 keV of at least a factor 2 with respect to the extrapolation of the best-fitting 3-10 keV model. Additional Swift-BAT and Integral-IBIS observations show that the 20-100 keV is concentrated within 1.5 arcmin from the center of the galaxy, and is not significantly variable on time scales from days to years. A comparison of this component with the 3-10 keV emission, which is characterized by a rapidly variable absorption, suggests a complex structure of the circumnuclear medium, consisting of at least two distinct components with rather different physical properties, one of which covering 80% of the source with a column density 3-41024 cm-2. An alternative explanation is the presence of a double active nucleus in the center of NGC 1365.
1 Introduction
X-ray spectroscopy is a powerful way to investigate the complex structure of the circumnuclear medium in Active Galactic Nuclei.
In particular, the energy window above 10 keV is crucial to understand the nature of Compton-thick AGNs, i.e. those absorbed by a column density higher than 1024 cm-2. These objects represent about 40-50% of all AGNs in the local Universe (Risaliti et al. 1999, Guainazzi et al. 2005) and are expected to be also common at higher redshifts (Gilli et al. 2007). If the absorbing column density is in the range NH1025 cm-2, the primary AGN emission becomes directly observable only above 10 keV, while only the much fainter reflected emission is visible below 10 keV. This is the case, for example, of two out of the three nearest AGNs, NGC 4945 (Guainazzi et al. 2000) and Circinus (Matt et al. 1999).
Recently, several new instruments increased our ability to perform such studies. In particular, Suzaku is equipped with the most sensitive instrument available in the 15-60 keV interval, while Integral-IBIS and Swift-BAT are performing all-sky surveys in the 15-150 keV band, providing good quality time-averaged spectra and positional accuracy of the order of few arcmin.
In this Letter we present the discovery of a new case of a strong excess in the 10 keV emission of an AGN, characterized by a so-far unique, puzzling property: the source showing this excess, NGC 1365, is not reflection-dominated in the 2-10 keV range. Instead, it is a well known Compton-thin source, intensively studied by our group for its extreme absorption variability, due to clouds with column density from a few 1023 to 1024 cm-2 covering and uncovering the X-ray source on timescales as short as 10 hours (Risaliti et al. 2009A, 2009B).
2 The Suzaku Observation
Suzaku observed NGC 1365 (in the XIS nominal position) on January 21-25, 2007 for an elapsed time of 3 days, and a net time of 150 ks.
Data Reduction. The spectra and calibrations were obtained following the standard procedure illustrated in the Suzaku reduction guide111http://heasarc.gsfc.nasa.gov/docs/suzaku/analysis/abc/, and using the most recent calibrations.
For the low-energy instruments (XIS) the source spectrum was extracted from a circular region with radius of 2.9 arcmin, centered on the source. The background was obtained from a free region in the same field of view. Calibration files were produced using the FTOOLS 6.6 package222http://heasarc.gsfc.nasa.gov/docs/software/ftools/ftools_menu.html. The spectra and calibrations from the two front-illuminated CCDs (XIS0 and XIS3) were merged, while the spectrum from the back-illuminated XIS1 detector has been treated separately in the subsequent spectral analysis. The soft (0.5-2.5 keV) emission of NGC 1365 is know to be dominated by a thermal component originating from the diffuse gas in the center of the galaxy (Wang et al. 2009).
For the HXD-PIN data, we used the rev2 data, which include all 4 cluster units, and the best available background (Fukazawa et al. 2009), which accounts for the instrumental background (NXB, Takahashi et al. 2007, Kokubun et al. 2007), and is affected by systematic uncertainties of about 1.3% (at 1 ). We then simulated a spectrum for the cosmic X-ray background counts (Boldt 1987, Gruber et al. 1999) and added it to the instrumental one. Using this background NGC1365 is detected in the 15–70 keV band at % above the background with a net count rate of (8.70.2)10-2 (a total of 12000 net source counts have been collected).
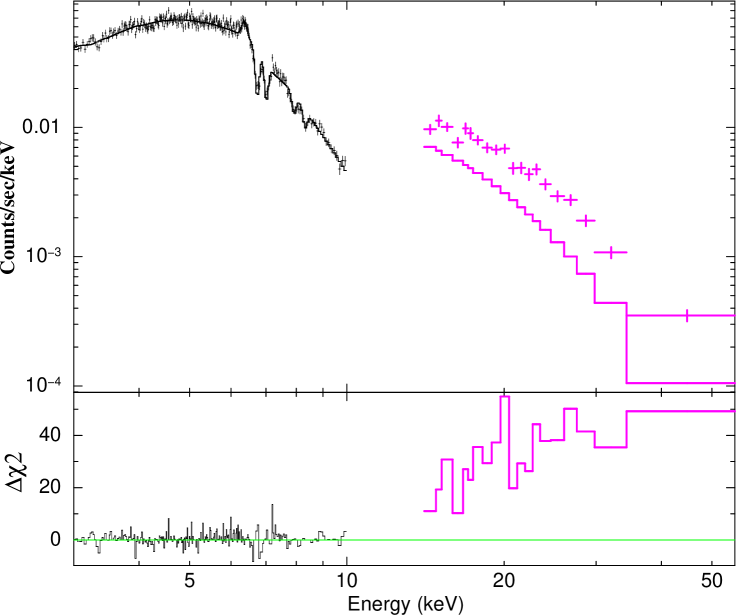
The total 3-10 keV and 15-60 keV spectra are shown in Fig. 1.
In the spectral analysis, we used a cross-calibration constant of 1.16 between
the HXD and XIS spectra, as suggested by the Suzaku-HXD calibration team333
http://www.astro.isas.jaxa.jp/suzaku/doc/suzakumemo/suzakumemo-2008-06.pdf.
Data analysis. A visual inspection of the low-energy spectrum suggests that the source is in a Compton-thin state, with a photoelectric cut-off at 3-4 keV, corresponding to an absorbing column density of the order of 1-2 cm-2. The spectral shape, and the value of the total flux, closely resembles the state observed during the XMM-Newton observation described in Risaliti et al. 2009B. We therefore used the same model developed to fit those data as a starting point for our spectral analysis. The model consists of the following components: a continuum, made by a power law absorbed by a double layer of gas, one layer completely covering the source, and one layer covering only a fraction of it; a cold reflection continuum, a relativistically broadened iron emission line, and a set of four absorption lines in the 6.7-8.3 keV range, due to Fe XXV and FeXXVI K and K transitions. A complete fit of the whole XIS band (0.5-10 keV) would also include a soft thermal component, dominant in the soft band (0.5-2 keV). This component has a diffuse origin, as shown by our high-resolution Chandra observations (Wang et al. 2009), and its contribution at E3 keV is completely negligible, so we did not include it in our model.
This model provided a good fit to the low-energy data (=1215/1182 d.o.f.) with no obvious residual features (Fig. 1). All the components listed above are statistically significant, with no redundancy. However, when compared with the high-energy spectrum, we find that the extrapolation of the 3-10 keV best fit model falls short by a factor of 3 in reproducing the 15-60 keV emission (Fig. 1).
A complete analysis of the 3-10 keV emission, focusing on the complex (and variable, see below) absorbing medium will be presented in a forthcoming paper (Maiolino et al. 2009, in prep.). Here instead we focus on the comparison between the low- and high- energy time-averaged spectra. As a consequence, our spectral analysis of the XIS spectrum is mainly aimed at determining the continuum parameters, in order to compare the high energy spectrum with the extrapolation of the emission below 10 keV.
We checked several possibilities in order to explain the discrepancy shown in Fig. 1:
1) Continuum slope and flux. We fitted the low- and high- energy simultaneously, in order
to search for an acceptable fit of both components. Qualitatively, we may expect that a
much flatter continuum, with a higher extrapolation at 15 keV, could reproduce the
high energy emission. No satisfactory solution can be found in this scenario: it is impossible
to obtain a good fit of the average continuum below 10 keV with any slope .
However, given the strong spectral variability below 10 keV, this result may change when the different spectral states are fitted separately. In particular, the work performed on the Compton-thin spectrum observed in January 2004 by XMM-Newton (Risaliti et al. 2009B) shows that an accurate, time-resolved analysis is necessary in order to correctly estimate the relevant parameters of several spectral components, such as the broad iron emission line, the reflection component, and the structure of the absorber. The Suzaku observation is no exception: a time resolved analysis reveals significant absorption variability. This issue is discussed in detail in Maiolino et al. 2009 (in prep.), where it is shown that a flatter photon index () can indeed reproduce the continuum if the absorption component is free to vary during the observation. However, even in this case, a strong high-energy excess is still present, with an observed 15-60 keV flux larger than the extrapolated lowe-energy emission by a factor of two.
2) Additional continuum component. A good fit of the high energy excess can be obtained adding a continuum component absorbed by a column density 1024 cm-2. We modeled this emission with a power law with the same spectral slope as the 3-10 keV primary component and, as a first step, with just photoelectric absorption. The best fit value for the column density is =3.81024 cm-2, while the flux of the extra component is a factor 3 higher than that of the low-energy component. All the best fit parameters of the other components remain the same as in the fit of the low-energy component only. This is also the case for the other models of high-energy absorption discussed below. Therefore, the parameters listed in the upper part of Table 1, regarding the low-energy components, are common for all the models discussed here.
A column density 41024 cm-2 corresponds to a Compton optical depth 2.5. Therefore, the effects of Compton scattering must be taken into account in order to estimate the correct intrinsic flux and column density. In particular, the intrinsic flux obtained in the previous fit, with the photoelectric absorption only, can be regarded as a lower limit of the actual emission of the high-energy component. We repeated the previous fit adding a Compton attenuation factor exp(-). Physically, this represents a scenario where every Compton-scattered photon is removed from the observed beam. This happens if the =3-41024 cm-2 gas is only along the line of sight, and covers a negligible fraction of the solid angle as viewed from the X-ray source. The results of the fit with this model are a huge intrinsic flux (about 30 times more than the low-energy component) and a column density consistent with the previous value. This shows that the determination of the flux level is critically dependent on the geometry of the absorber/scatterer, while the column density value is mainly constrained by the spectral curvature around 15-30 keV, and is therefore well determined independently from the assumed geometry. A more physical treatment of Compton scattering has been made by Matt, Pompilio & La Franca (1999) and Yaqoob et al. (1997), assuming a spherically symmetric, homogeneous gas around an X-ray source with a power law emission. The latter model is implemented in XSPEC, and provides a correct output in the range 12-19 keV. We therefore repeated our analysis using only the 14-19 keV high energy data, and freezing the column density to the value obtained in the previous fits. The result is an intermediate value of the intrinsic flux (about 7 times the low-energy component, Tab. 1). This, again can be regarded as a lower limit, since a smaller covering factor of the circumnuclear gas would imply a lower contribution from photons scattered to our line of sight.
2.34 F(OBS) 1.3 erg s-1 cm-2 F(INTR) 3.9 erg s-1 cm-2 F(EXTR) 2.2 erg s-1 cm-2 L(EXTR) 8.7 erg s-1 /d.o.f. 512/475 (high) 4.5 cm-2 F(OBS) 7.2 erg s-1 cm-2 F(INTR,=0) 70 erg s-1 cm-2 L(INTR,=0) 3.0 erg s-1 F(INTR,=4) 14 erg s-1 cm-2 L(INTR,=4) 6.1 erg s-1
3 BeppoSAX, Integral and Swift Observations
NGC 1365 has been observed in the hard (10 keV) range by other observatories, providing important complementary information.
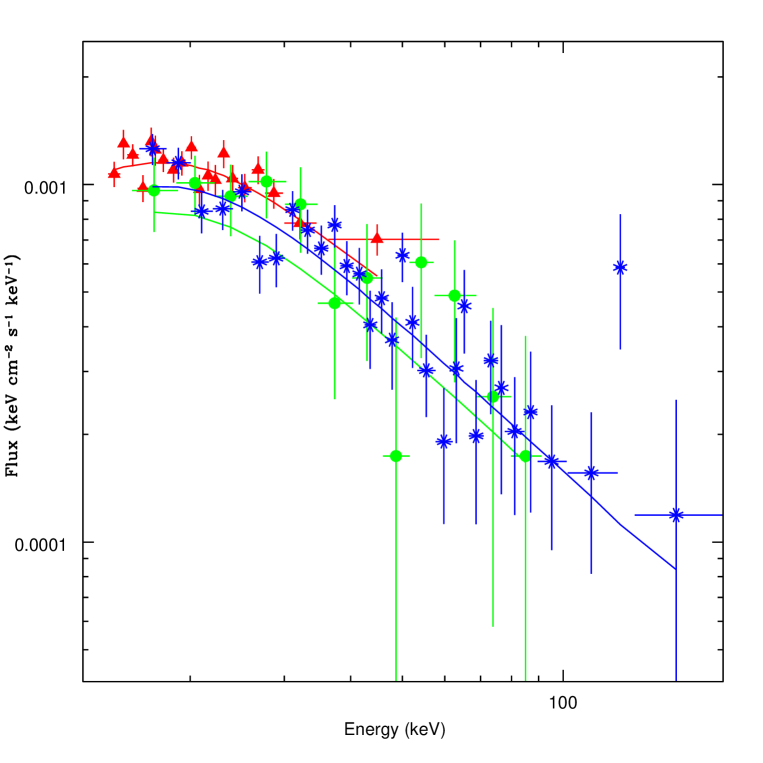
BeppoSAX. The first high-energy observation was performed by BeppoSAX in 1999. The 20-100 keV data were presented in Risaliti et al. 2000, but not discussed in detail, for two main reasons: the low S/N of the spectrum, which made the excess barely significant, and the large field of view of the PDS instrument (about 55 arcmin FWHM), which implies a non-negligible probability of a contribution of serendipitous sources (in this case, for example, the AGN in NGC 1386, at a distance of about 30 arcmin). However, the observed emission is roughly compatible with that observed with Suzaku, with an average flux 15% higher, but compatible within the BeppoSAX-PDS calibration uncertainties (Fig. 3).
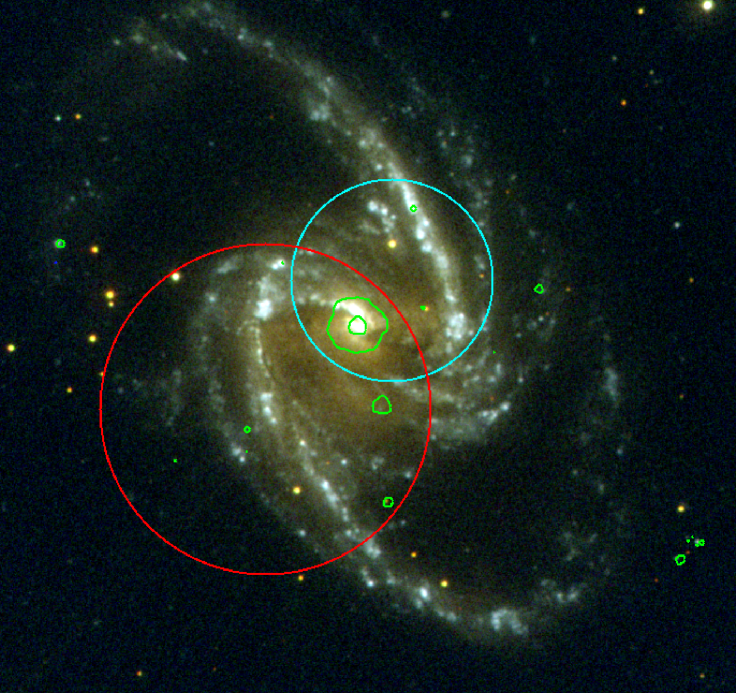
Integral. Up to now, the sky region of NGC 1365 has been little observed by Integral. For this reason, NGC 1365 is not in the catalog of Integral bright sources (Bird et al. 2007). However, it has been detected with a signal-to-noise S/N5 in the 15-195 keV range by Sazonov et al. 2007, with a flux level perfectly compatible with that measured by Suzaku, assuming the same spectral slope as obtained in our fits. The positional accuracy of the Integral observation is about 2.5 arcmin, and the source position is compatible with the nucleus of NGC 1365 (Fig. 2).
Swift. The Swift-BAT instrument observes about 1/6 of the sky continuously, in an almost random way. The 39-months Palermo-BAT catalog (Cusumano et al. 2009), provides a spectrum of NGC 1365 with S/N=28, and a positional accuracy of 1.5 arcmin (Fig. 3), compatible with the center of the galaxy. The average spectrum is shown in Fig. 3, and is compatible with the ones obtained with BeppoSAX and Suzaku in single observations. This suggests the absence of significant intrinsic variability in the high-energy emission. Moreover, by constraining the position of the high energy emission within 1.5 from the nucleus, the Swift-BAT data imply that contamination from hard X-ray bright sources is unlikely also for the Suzaku PIN data.
4 Discussion
The hard X-ray analysis of NGC 1365 shows a strong excess in the emission above 10 keV with respect to the extrapolated lower energy spectrum. The comparison between single Suzaku and BeppoSAX observations, and average Integral and Swift ones shows that this emission remains about constant (both in flux and shape, i.e. ) on time scales of a few years. The Swift-BAT observations constrain the high-energy source position within 1.5 arcmin from the nucleus.
The presence of the extra high-energy component in NGC 1365 is unique among known Compton-thin AGNs, and its interpretation is quite challenging.
Several AGNs are much brighter above 10 keV than expected from the extrapolation of their emission at lower energies. However, in all known cases this is due to a complete coverage of gas with column density in the range 1024-1025 cm-2, resulting in a reflection-dominated spectrum below 10 keV, and an intrinsic component showing up above 10 keV. NGC 1365 is instead clearly Compton-thin below 10 keV in the Suzaku observation. The most obvious explanation of the observed emission is therefore a partial covering by a 41024 cm-2 gas, with a fraction of this intrinsic emission not covered, and absorbed only by clouds with lower column density.
However, this simple scenario is challenged by the X-ray observational history of NGC 1365. The main two relevant facts are the
following:
1. NGC 1365 has been observed about 15 times in the 2-10 keV range, with all the main X-ray observatories.
The source was in a Compton-thin state in about 2/3 of the observations, and in Compton-thick, reflection dominated state
in the remaining 1/3. Column density variations, due to both Compton-thin and Compton-thick clouds have been observed
on time scales as short as a few hours. The Suzaku observation presented here is no exception, with
changes of a few 1023 cm-2 in a few hours (Maiolino et al. 2009, in prep).
2. In all the observations in a Compton-thin state, the measured intrinsic 2-10 keV flux is constant within a factor ,
between 2 and 4 erg s-1 cm-2.
In this range, the Suzaku observation caught the source at about its recorded maximum.
These data are impossible to reconcile with a single absorber made of clouds with different column densities: considering that the intrinsic high-energy flux is at least a few times larger than the one at low energy, we should have an absorber with cm-2 covering 85% of the source with very small variations in the covering factor, and at the same time producing the huge and rapid changes observed in the uncovered part.
We are currently developing simulations to reproduce the observed pattern observed in NGC 1365 through a clumpy absorber, allowing for different column density distributions for the absorbing clouds, different cloud sizes and variable number of clouds along the line of sight. Given the large number of free parameters, the results are still not unique (we expect to obtain tighter constraints from a forthcoming survey of 20 snapshot observations planned with Swift during 2009). However, it is clear that no single distribution of clouds can reproduce, through random variations, an almost constant covering of more than 85% of the source and strong and frequent variations in the remaining 15%.
These considerations imply that only more complex, fine-tuned scenarios are possible:
1. A second, independent absorber. The constant partial covering could be obtained through an absorber with
physical properties completely different from those of the one responsible for the variations.
A homogeneous screen external to the broad line clouds (most likely responsible for the
variable absorption, Risaliti et al. 2009B) requires an extreme fine tuning on the position with respect
to the observer: the linear dimensions of the X-ray source are of the order of a few 1013 cm, while
the broad line region at a distance from the center of the order of R=1016 cm. The external
absorber should therefore have a sharp edge, and
cover exactly 85-90% of the source, being at a distance at least 1000 times
larger than the source size. An alternative scenario is that of an absorber made of many small and dense clouds.
Each cloud should have a linear size , and the average number of clouds along the line of
sight should satisfy N(/)20.85-0.9 (in order to obtain the requested covering factor) and
1/5%, i.e. N400 (in order to have small fluctuations). Since 1014 cm, the
density of the single clouds should be n/ cm-3.
2. A warped disk. The above problems on the fine-tuning of the properties of a homogeneous absorber could be
less severe with an absorber located much nearer to the X-ray source. A warped disk, with one edge crossing
the line of sight to the X-ray source would be a geometrically acceptable solution.
With a column density
of 41024 cm-2, in order to have a complete absorption below 10 keV,
a ionization parameter 103 is needed. With a
ionizing luminosity L(1-100 keV)1043 erg s-1 and
a distance of the order of 1015 cm,
this implies a density n1010 cm-3, and a disk thickness R/R0.4.
This is a plausible geometry, which however requires a fine-tuned relative inclination
between the disk and the line of sight.
3. A double nucleus. A second, hidden X-ray source in the nucleus of NGC 1365 is in principle a possible explanation.
Given the high luminosity of the obscured source (L(2-10)21043 erg s-1) this would
be a second AGN. NGC 1365 is a prototype barred spiral, with no signs of recent mergers. This would be the first
case of a double AGN in a galaxy with a regular morphology. Chandra and HST observations (Wang et al. 2009)
do not reveal any indication of such a double nucleus in the X-rays and near-IR,
down to scales of 0.5 arcsec, corresponding
to 100 pc. For comparison, we note that NGC 6240, hosting a well known double AGN, is a merging system, with a
distance between the two nuclei of the order of 1 kpc (Komossa et al. 2003, Risaliti et al. 2006).
4. A serendipitous quasar. The uniqueness of the case under investigation prompted us to check the
probability of a serendipitous obscured quasar along the line of sight. Assuming the most recent X-ray
luminosity functions and estimates of the density of obscured quasars (Gilli et al. 2007) we obtain that
the probability of a serendipitous quasar with a 20-100 keV flux equal to, or higher than the one of the extra
component at high energy, at a distance higher than that of NGC 1365, in a circular
region with a radius 1.5 arcmin, is about 1.510-7.
Our conclusion is that the most likely scenario for a single X-ray source is that of two distinct absorbers, one made of broad line clouds with 1023-1024 cm-2, sizes of the order of 1013-1014 cm and densities n1011-1012 cm-3, and a second one with 41024 cm-2, consisting either of the outer region of a warped accretion disk, or of a large number of small, dense clouds with linear dimensions 1012 cm and densities n1012 cm-3.
References
- Arnaud (1996) Arnaud, K. A. 1996, Astronomical Data Analysis Software and Systems V, 101, 17
- Bird et al. (2007) Bird, A. J., et al. 2007, ApJS, 170, 175
- Boldt (1987) Boldt, E. 1987, Phys. Rep., 146, 215
- Cusumano et al. (2007) Cusumano, G., et al. 2009, arXiv:0906.4788
- Fukazawa et al. (2009) Fukazawa, Y., et al. 2009, PASJ, 61, 17
- Gilli et al. (2007) Gilli, R., Comastri, A., & Hasinger, G. 2007, A&A, 463, 79
- Gruber et al. (1999) Gruber, D. E., Matteson, J. L., Peterson, L. E., & Jung, G. V. 1999, ApJ, 520, 124
- Guainazzi et al. (2000) Guainazzi, M., Matt, G., Brandt, W. N., Antonelli, L. A., Barr, P., & Bassani, L. 2000, A&A, 356, 463
- Guainazzi et al. (2005) Guainazzi, M., Matt, G., & Perola, G. C. 2005, A&A, 444, 119
- Kokubun et al. (2007) Kokubun, M., et al. 2007, PASJ, 59, 53
- Matt et al. (1999) Matt, G., Pompilio, F., & La Franca, F. 1999, New Astronomy, 4, 191
- Matt et al. (1999) Matt, G., et al. 1999, A&A, 341, L39
- Risaliti et al. (1999) Risaliti, G., Maiolino, R., & Salvati, M. 1999, ApJ, 522, 157
- Risaliti et al. (2000) Risaliti, G., Maiolino, R., & Bassani, L. 2000, A&A, 356, 33
- Risaliti et al. (2009) Risaliti, G., et al. 2009A, ApJ, 696, 160
- Risaliti et al. (2009) Risaliti, G., et al. 2009B, MNRAS, 393, L1
- Wang et al. (2009) Wang, J., Fabbiano, G., Elvis, M., Risaliti, G., Mazzarella, J. M., Howell, J. H.,
- Sazonov et al. (2007) Sazonov, S., Revnivtsev, M., Krivonos, R., Churazov, E., & Sunyaev, R. 2007, A&A, 462, 57
- Takahashi et al. (2007) Takahashi, T., et al. 2007, PASJ, 59, 35
- Wang et al. (2009) Wang, J., Fabbiano, G., Elvis, M., Risaliti, G., Mazzarella, J. M., Howell, J. H., & Lord, S. 2009, ApJ, 694, 718
- Yaqoob (1997) Yaqoob, T. 1997, ApJ, 479, 184