Snapshot metallicity estimate of resolved stellar systems
through Lick Fe5270 diagnostic
Abstract
We outline a new method to derive a “snapshot” metallicity estimate of stellar systems (providing one resolves at least the brightest part of the CMD) just on the basis of low-resolution (i.e., 6–8 Å FWHM) spectroscopy of a small stellar sample. Our method relies on the Fe5270 Lick index measurements and takes advantage of the special behavior of this spectral feature, that reaches its maximum strength among the ubiquitous component of K-type giants. This makes the Fe5270max estimate a robust and model-independent tracer of cluster [Fe/H], being particularly insensitive to the age of the stellar population.
A comparison of the Fe5270max distribution derived from globular and open clusters, as well as from the field giant population in the Galaxy disk, confirms a tight correlation of the index maximum vs. cluster [Fe/H] allover the entire metallicity range for stellar population with [Fe/H] . Relying on a theoretical calibration of the feature, we trust to effectively infer cluster metallicity within a typical uncertainty of 0.1–0.2 dex, depending on RGB luminosity sampling of the observations.
A handful of stars (5–10 objects) is required for the method to be applied, with low-metallicity stellar populations more easily managed, being Fe5270max located within the few brightest RGB stars of the system. In any case, we show that even the observation of a coarse stellar set would allow us to place a confident lower limit to cluster metallicity.
Subject headings:
stars: abundances — globular clusters: general — open clusters and associations: general — Galaxy: disk1. Introduction
A fair estimate of metal abundance in stellar systems still remains a central issue for any detailed assessment of the other cluster distinctive properties. Metallicity modulates, in fact, both effective temperature and apparent colors of stars, while the internal composition affects the nuclear engine, and therefore stellar lifetime. Even in case of resolved stellar systems, this entangled behavior may lead to a biased interpretation of cluster age, based on the CMD morphology, an effect often referred to as the “age-metallicity dilemma” (Renzini & Buzzoni, 1986; Worthey, 1994). Such induced age uncertainty also reflects in the distance determination of star clusters, as far as one tries to compare the apparent magnitude of the Main Sequence Turn Off (TO) point with the appropriate theoretical luminosity to derive therefrom the distance modulus. One further difficulty also deals with the proper assessment of dust reddening, that may affect CMD morphology leading, in general, to an artificially enhanced value of [Fe/H].111In terms of color excess, this effect can be quantified in (Buzzoni, 1995a).
To overcome these problems, one would like to preliminarily derive the cluster metallicity from accurate abundance analysis of individual stars (typically red giants, due to their brighter intrinsic luminosity at optical wavelengths) through high-resolution spectroscopy (e.g., Carretta & Gratton, 1997; Kraft & Ivans, 2003). This delicate task, however, is extremely time consuming, and a far more straight shortcut is often pursued relying on integrated cluster spectroscopy, usually taken at much lower resolution. Narrow-band spectrophotometric indices, as derived from integrated low-res ( 6-8 Å FWHM) observations, usually provide the basic diagnostic scheme to match theoretical models from stellar population synthesis and derive therefrom cluster properties (e.g., de Freitas Pacheco et al., 1998; Beasley et al., 2002; Strader & Brodie, 2004). The Lick system (Burstein et al., 1984; Worthey et al., 1994; Trager et al., 1998) stands out as the widest and most popular reference, assuring a systematic coverage of the main spectral features across the 4100–6400 Å wavelength range, easily accessible from ground-based observations.
Besides the advantage of this strategy, one can still question whether it effectively allows us to disentangle any age-metallicity degeneracy. In fact, integrated indices are sensitive both to intrinsic elemental abundance and to the temperature distribution of the underlying stellar population, thus delivering a composite and likely non-univocal piece of information (see a discussion in Buzzoni, 1995b; Worthey et al., 1995; Tantalo & Chiosi, 2004).
An alternative, and possibly more proficient way out, at least for resolved stellar clusters, can be envisaged and will be explored in this paper. It relies on a minimal “tuned” sampling of individual red giant stars of a cluster, observed at low spectral resolution such as to derive the maximum strength for the Fe5270 index, which is by far the most popular one among the several Fe i features included in the Lick system. As we will see in Sect. 2, for their special physical properties, Fe i features prove to be ideal candidates for a reliable “snapshot” estimate of stellar system metallicity.
Our method complements previous studies in the same line. For example, by relying on low-resolution near-IR observations of the strong Ca ii triplet among RGB stars, Da Costa & Hatzidimitriou (1998) and Parisi et al. (2009) recently recovered the [Fe/H] value for the SMC and its cluster system within less than a 0.2 dex uncertainty compared, for instance, to the high-res analysis of Battaglia et al. (2008).
In the following discussion, we will outline our method in Sect. 3, and propose a plain theoretical calibration based on population synthesis models. Theoretical predictions will be compared with a grid of Galactic globular and open clusters spanning the whole range of metallicity. In Sect. 4 we will summarize our conclusions and also briefly outline further applications of the method, also in view of the deeper forthcoming surveys of external stellar systems (i.e., extragalactic star clusters around and within nearby galaxies in the Local Group, etc.) taken with the new-generation telescopes.
2. Narrow-band indices of stars
Extended grids of synthetic stellar spectra, from which to derive Lick-index behavior vs. , , and [Fe/H], have been computed, among others, by Mould (1978), Barbuy (1994), Tripicco & Bell (1995), Chavez et al. (1996), Barbuy et al. (2003), and Bertone (2002). In addition, semi-empirical calibrations based on more or less complete samples of disk stars are due, among others, to Buzzoni et al. (1992), Buzzoni et al. (1994), Gorgas et al. (1993), Worthey et al. (1994), Borges et al. (1995) and Franchini et al. (2004). The latter results are often summarized in analytical sets of so-called “fitting functions”.
Both approaches resulted in a complementary contribution as far as the physical behavior of the different spectral features vs. stellar fundamental parameters is concerned. In this respect, a recognized advantage of synthetic spectra is to directly explore index changes within a “controlled” grid of input parameters. However, models are still largely inadequate in their physical treatment of cool stars, (i.e., K, including late-K and M spectral types; see Bertone et al., 2004, 2008), when convection and the increasing effect of molecular opacity severely perturb the atmosphere structure and the emerging spectral energy distribution of stars at optical wavelength.
From its side, the empirical fitting-function technique has the advantage of giving a simple and accurate summary of index behavior across the full parameter domain of real stars. This partly overcomes any modeling uncertainty, and the analytical set of equations can easily be implemented in theoretical models of stellar populations to compute the integrated indices of a system without requiring any spectral input for individual stars (Buzzoni et al., 1992, 1994; Worthey, 1994; Maraston et al., 2001; Maraston, 2005). As a drawback of this approach, however, one has to remark the evident limitation of any empirical star sample (forcedly dominated by a component of solar neighbors) to properly probe the full metallicity scale outside the solar range.
2.1. Fe5270 diagnostic properties
Among the set of Lick indices in the optical wavelength range, the Fe i lines reveal potentially the most promising ones for the present analysis. This is especially true for the Fe5270 feature, that begins to appear in stars cooler than K and reaches a maximum equivalent width about 4200–4600 K (Buzzoni et al., 1994). The latter is the typical temperature of faint low-main sequence dwarfs and, most importantly, also of bright MK III giants, which populate the AGB/RGB region of the CMD diagram.
Although not so prominent, the Fe5270 feature (and its close neighbor Fe5335) can easily be recognized also in the integrated spectra of elliptical galaxies (Worthey et al., 1992; Trager et al., 1998), and its presence is known to trace the relative contribution of low-RGB stars in the galaxy stellar population Buzzoni (1995a).
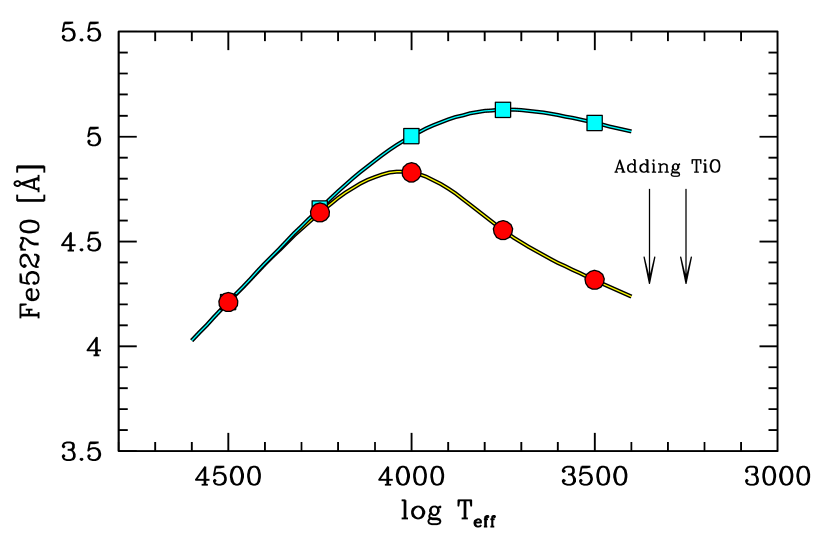
In Fig. 1 we explored in finer detail the Fe5270 diagnostic properties from the theoretical point of view, by means of an ad hoc grid of Bluered synthetic spectra (Bertone, 2002; Bertone et al., 2008). Spectral synthesis relied on Synthe code (Kurucz, 1993; Sbordone et al., 2004) and the grid of Atlas9 revised model atmospheres (Castelli & Kurucz, 2003) along the 3500–4500 K range. For K, the main contributor to line blanketing, along the three wavelength bands that define the index, is found to be Fe i, with a fine structure of more than 200 lines; particularly strong is, of course, the 5269.5 line. However, in this temperature regime, also important is the contribution of neutral Titanium and Chromium and, secondly, Calcium and Cobalt.
The TiO opacity becomes increasingly stronger with decreasing temperature, and becomes dominant for K. As a result, the prevailing effect of the TiO molecular bands on the Fe5270 index is in the sense of depressing the red-side pseudo-continuum, thus reducing the apparent strength of the index. According to the models, one may even conclude that the TiO molecule is actually the main responsible for constraining in temperature the Fe5270 peak value (see, again, Fig. 1).
We can probe index sensitivity also by means of empirical data. From the Buzzoni et al. (1994) fitting function we can write in fact:
| (1) |
that fairly well compares with the Bluered theoretical prediction,222The [Fe/H] dependence of the Bluered synthetic index has perhaps to be considered as an upper limit, as molecular absorption in the relevant wavelength range should likely be stronger than predicted by models at solar and super-solar metallicity. According to our experiments, this makes the current Bluered output to overestimate by 0.5 Å the real Fe5270 index strength as observed for metal-rich stars. namely
| (2) |
According to Worthey et al. (1994) models we have
| (3) |
while Gorgas et al. (1993) results provide333Note that the Worthey et al. (1994) and Gorgas et al. (1993) results are not completely independent as both rely on a largely overlapping stellar sample. One relevant difference, however, is that Gorgas et al. (1993) use the color instead of for their fitting functions.
| (4) | |||||
Note from the equations the weak index sensitivity to stellar surface gravity. For example, any change of one dex in only contributes at most by Å to the Fe5270max variation. In terms of overall properties of a stellar aggregate, this figure reflects in a change of TO stellar mass of roughly 0.3 dex, which implies a variation of nearly one order of magnitude in stellar lifetime. Therefore, as a major conclusion, we have that Fe5270max in a stellar population is nearly independent from age.
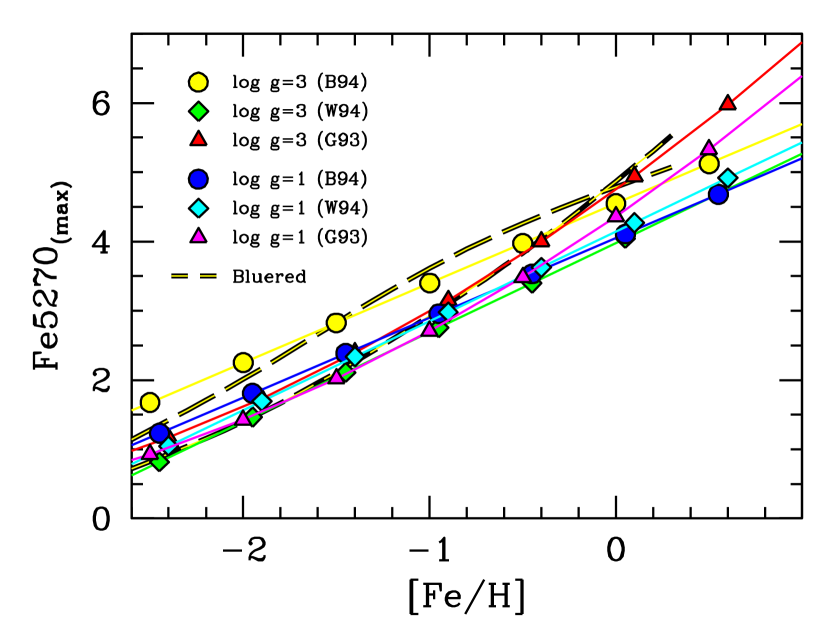
A comparison of the different calibrations is shown in Fig. 2, where we report the output index for two reference values of stellar gravity (namely, and 3 dex) appropriate for red giants. Within a remarkably good agreement among the different datasets, compared to Buzzoni et al. (1994) calibration, one notes from the plot that Worthey et al. (1994) fit displays an even lower dependence on , while Gorgas et al. (1993) fit stands out for its steeper trend with metallicity, especially at super-solar regimes. Overall, we can conclude that the direct Fe5270 dependence on Fe abundance turns out to be , with .
3. Tracing stellar populations
In addition to its direct sensitivity to [Fe/H], a major supplementary advantage of using Fe5270 feature as metallicity tracer in stellar populations resides in the special property of the index to always peak within the temperature range sampled by red giants in stellar systems richer than [Fe/H] dex.444Apart from Fe5270, two other Lick indices display a similar behavior: the G-band and the CN molecular indices (see Gorgas et al., 1993). For its atomic origin, however, Fe5270 should in principle be a more accurate and unbiased metallicity tracer.
Conversely, this is not the case, for instance, of other stronger features, used to derive popular indices like the Lick Mg2 or the near-IR CaT triplet index (Jones et al., 1984; Idiart et al., 1997; Cenarro et al., 2001). Both these features peak, in fact, among giants and dwarfs at the coolest temperature tail of each CMDs, and their dependence on SSP metallicity is, therefore, naturally prone to more entangled age effects and to other model-dependent features, such as convection and mass loss properties (both constraining the AGB/RGB tip location).
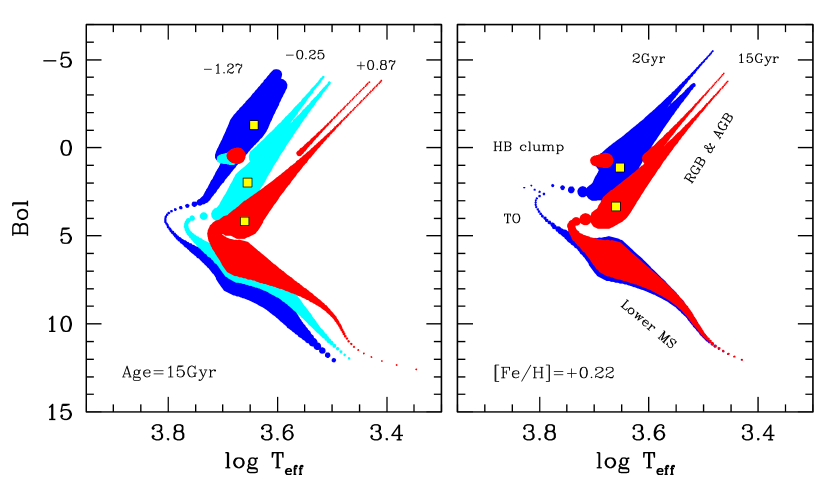
The Fe5270max location for the illustrative case of different simple stellar populations (SSPs), with varying either age or [Fe/H], is shown in Fig. 3. A glance to the figure makes clear that Fe5270 homogeneously probes the ubiquitous component of K1-K3 III stars within each stellar system.
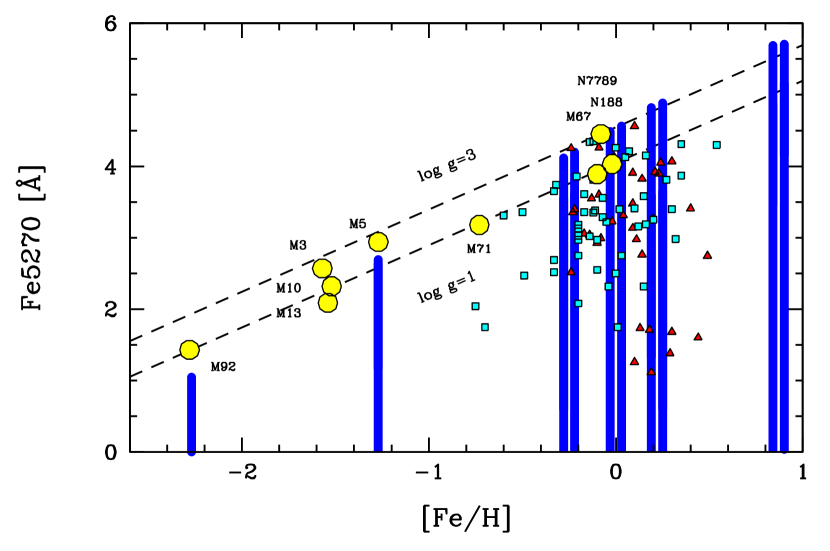
The collection of empirical estimates of Fe5270max for several open and globular clusters of the Galaxy, according to the Gorgas et al. (1993) database, is summarized in Fig. 4. These results are collected in Table 1, where we report for each cluster the strongest value reached by the Fe5270 index among the sampled stars, together with the sample size in each system, and the adopted cluster metallicity. Note that, as Fe5270 strength peaks among increasingly brighter red giants with decreasing metallicity (see left panel of Fig. 3), just a handful set of bright stars in metal-poor globular clusters is sufficient to suitably pick up Fe5270max. A slightly deeper spectroscopy is required, instead, for metal-rich systems, but even in this case a dozen of stars taken at low spectral resolution are fully sufficient to suitably constrain the index tip. As an interesting example, in this regard, we also overplot in Fig. 4 the full sample of field giants (class MK III or ) studied by Buzzoni et al. (1994), and Buzzoni et al. (2001); it is evident that the upper envelope of the Fe5270 distribution for the entire stellar dataset effectively matches the overall cluster trend.
The data of Fig. 4 are also compared with theoretical predictions from population synthesis models. The displayed models refer to 12.5 Gyr SSPs with different metallicity from Buzzoni (1989, 1995a). The case of younger (5 Gyr) populations is also accounted for the metallicity range of open clusters.555For young ( Gyr) and extremely metal-poor ([Fe/H] ) SSPs, however, models indicate that red giants are “too blue” (i.e., too warm) for the Fe5270 feature to span its full range and reach its maximum. In these case the Fe5270 index mat actually drop to nominal values and even remains undetected in the spectra of these stars.
| Name | Type(b) | [Fe/H] | Fe5270max | No. of |
|---|---|---|---|---|
| [Å] | sampled stars | |||
| NGC 188 | O | –0.02 | 4.03 | 24 |
| NGC 7789 | O | –0.08 | 4.45 | 12 |
| M67 | O | –0.10 | 3.89 | 20 |
| M71(c) | G | –0.73 | 3.18 | 36 |
| M5 | G | –1.27 | 2.94 | 5 |
| M10 | G | –1.52 | 2.32 | 4 |
| M13 | G | –1.54 | 2.09 | 3 |
| M3 | G | –1.57 | 2.57 | 3 |
| M92 | G | –2.28 | 1.43 | 4 |
4. Results and conclusions
A fit to all synthesis models of Fig. 4, excluding the [Fe/H] case, provides
| (5) |
with the displayed coefficient uncertainty at 1 level. Compared to the original stellar fitting function of eq. (1), we report here a slightly steeper slope (i.e., a more sensitive dependence) in the Fe5270 vs. [Fe/H] SSP relationship (namely here vs. 1.15 of eq. 1). This is due to the reinforcing effect of the variation, which increases among metal-rich giants, for fixed SSP age.
Entering eq. (5) with the cluster values for Fe5270max from Table 1 we could assess the statistical performance of our theoretical calibration as [Fe/H] predictor. One has to bear in mind, however, that this procedure is clearly biased toward underestimating cluster metallicity as we might be missing the real Fe5270 maximum. Of better interest may rather be to study the distribution of positive and negative residuals (in the sense “observed - predicted” [Fe/H]), separately. In summary, the relevant figures are the following:
| (6) |
where the rms for the total sample residuals (l.h. side of the equation) comes in fact from a skewed distribution of positive () and negative () residuals. For the previous arguments, the value may actually provide a more genuine estimate of the real method performance, once a fair spectroscopic sampling of cluster stellar population can be assured.
In conclusion, the claimed advantage of our diagnostic technique for a “snapshot” estimate of metal abundance in stellar systems (providing one resolves at least the brightest part of the CMD) can be briefly summarized as follows:
1) As Fe5270max is negligibly affected by stellar gravity, its value within a stellar population is virtually age independent, and may therefore provide an unbiased measure of metallicity within a 0.1–0.2 dex internal uncertainty. The Fe5270max vs. [Fe/H] correlation is expected to strictly hold for every stellar population with [Fe/H] .
2) As far as we know, within this framework, the Fe5270 index performance is definitely better than that of any other stronger feature. For instance, by relying on Mg2 or CaT∗ indices (see Cenarro et al., 2001), our procedure delivers cluster metallicity for the sample of Table 1 with a minimum666Because one should also account for an additional uncertainty in case of unknown cluster age) internal accuracy of dex and dex, respectively.
3) Compared to other spectroscopic methods, ained at deriving cluster metallicity from low-resolution spectra of their bright stars, our method has the superior advantage that it does not require any a priori assumption/inference about stellar temperature and gravity. It is distance and reddening independent, and uses an Iron-dominated feature (instead of any -element feature, as for Mg and Ca indices) to infer [Fe/H].
4) Low-resolution spectroscopy () is required for the method, planning just a “one-shot” observation of the brightest stars of a given cluster with a standard multi-object (MOS) instrumental setup. Compared to broad-band imaging, one could envisage to derive useful spectroscopic information for stars about 3–4 mag brighter than the imaging limit.
5) As an added value, in addition to the Fe5270 index, spectra would naturally deliver supplementary information on other popular Lick indices, like Mg2, H, etc., at close wavelength.
6) A minimal set of giant stars is required (5–10 objects), hopefully spanning the whole luminosity range. Low-metallicity stellar populations would be the favorite ones, as Fe5270max could easily be located among the very few outstanding stars of the cluster. Deeper observations (down to the base of the RGB) would be required, instead, for metal-rich populations. According to Renzini & Buzzoni (1986), however, the luminosity-specific full number of Post-MS stars in a SSP with TO mass, MTO, is
| (7) |
This means, for instance, that by sampling some in the uncrowded external region of a globular cluster one may successfully pick up Fe5270max among the few dozen brightest stars in the field. In any case, the observation of just the few outstanding members would confidently place a lower limit to cluster metallicity in lack of any other piece of information.
References
- Barbuy (1994) Barbuy B., 1994, ApJ, 430, 218
- Barbuy et al. (2003) Barbuy B., Perrin M.-N., Katz D., Coelho P., Cayrel R., Spite M., Van’t Veer-Menneret C., 2003, A&A, 404, 661
- Battaglia et al. (2008) Battaglia G., Irwin M., Tolstoy E., Hill. V., Helmi A., Letarte B., Jablonka P., 2008, MNRAS, 383, 183
- Beasley et al. (2002) Beasley M. A., Hoyle F., Sharples R. M., 2002, MNRAS, 336, 168
- Bertone (2002) Bertone, E., 2002, PhD Thesis, Univ. of Milan
- Bertone et al. (2004) Bertone E., Buzzoni A., Chávez M., Rodríguez-Merino L. H., 2004, AJ, 128, 829
- Bertone et al. (2008) Bertone E., Buzzoni A., Chávez M., Rodríguez-Merino L. H., 2008, A&A, 485, 823
- Borges et al. (1995) Borges A. C., Idiart T. P., de Freitas Pacheco J. A., Thevenin F., 1995, AJ, 110, 2408
- Burstein et al. (1984) Burstein D., Faber S. M., Gaskell, C. M., Krumm N., 1984, ApJ, 287, 586
- Buzzoni (1989) Buzzoni A., 1989, ApJS, 71, 817
- Buzzoni (1995a) Buzzoni A., 1995a, ApJS, 98, 69
- Buzzoni (1995b) Buzzoni A., 1995b, ASPC, 86, 189
- Buzzoni et al. (1992) Buzzoni A., Gariboldi G., Mantegazza L., 1992, AJ, 103, 1814
- Buzzoni et al. (1994) Buzzoni A., Mantegazza L., Gariboldi G., 1994, AJ, 107, 513
- Buzzoni et al. (2001) Buzzoni A., Chavez M., Malagnini M. L., Morossi C., 2001, PASP, 113, 1365
- Carretta & Gratton (1997) Carretta E., Gratton R. G., 1997, A&AS, 121, 95
- Castelli & Kurucz (2003) Castelli, F., & Kurucz, R. L. 2003, Modelling of Stellar Atmospheres, 210, 20P
- Cenarro et al. (2001) Cenarro A. J., Cardiel N., Gorgas J., Peletier R. F., Vazdekis A., Prada F., 2001, MNRAS, 326, 959
- Chavez et al. (1996) Chavez M., Malagnini M. L., Morossi C., 1996, ApJ, 471, 726
- Da Costa & Hatzidimitriou (1998) Da Costa G. S., Hatzidimitriou D., 1998, AJ, 115, 1934
- de Freitas Pacheco et al. (1998) de Freitas Pacheco J. A., Barbuy B., Idiart T., 1998, A&A, 332, 19
- Franchini et al. (2004) Franchini M., Morossi C., Di Marcantonio P., Malagnini M. L., Chavez M., Rodriguez-Merino L., 2004, ApJ, 601, 485
- Gorgas et al. (1993) Gorgas, J., Faber, S. M., Burstein, D., Gonzalez, J. J., Courteau, S., and Prosser, C. 1993, APJS, 86, 153
- Idiart et al. (1997) Idiart T. P., Thevenin F., de Freitas Pacheco J. A., 1997, AJ, 113, 1066
- Jones et al. (1984) Jones J. E., Alloin D. M., Jones B. J. T., 1984, ApJ, 283, 457
- Kraft & Ivans (2003) Kraft R. P., Ivans I. I. 2003, PASP, 115, 143
- Kurucz (1993) Kurucz, R. L. 1993, CD-ROM 13, Atlas9 Stellar Atmosphere Programs and 2 km/s Grid (Cambridge: Smithsonian Astrophys. Obs.)
- Maraston (2005) Maraston C., 2005, MNRAS, 362, 799
- Maraston et al. (2001) Maraston C., Greggio L., Thomas D., 2001, Ap&SS, 276, 893
- Mould (1978) Mould J. R., 1978, ApJ, 220, 434
- Parisi et al. (2009) Parisi M. C., Grocholski A. J., Geisler D., Sarajedini A., Clariá J. J., 2009, AJ, 138, 517
- Paunzen (2008) Paunzen, E. 2008, Contributions of the Astronomical Observatory Skalnate Pleso, 38, 435
- Renzini & Buzzoni (1986) Renzini A., Buzzoni A., 1986, in Chiosi C., Renzini A., eds., Spectral Evolution of Galaxies. Reidel, Dordrecht, p. 195
- Sbordone et al. (2004) Sbordone, L., Bonifacio, P., Castelli, F., & Kurucz, R. L. 2004, Mem.SAIt Suppl. Ser., 5, 93
- Strader & Brodie (2004) Strader J., Brodie J. P., 2004, AJ, 128, 1671
- Tantalo & Chiosi (2004) Tantalo R., Chiosi C., 2004, MNRAS, 353, 917
- Trager et al. (1998) Trager S. C., Worthey G., Faber S. M., Burstein D., Gonzalez J. J., 1998, ApJS, 116, 1
- Tripicco & Bell (1995) Tripicco M. J., Bell R. A., 1995, AJ, 110, 3035
- Worthey (1994) Worthey, G. 1994, APJS, 95, 107
- Worthey et al. (1992) Worthey, G., Faber, S. M., and Gonzalez, J. J. 1992, APJ, 398, 69
- Worthey et al. (1994) Worthey, G., Faber, S. M. , Gonzalez, J. J. , and Burstein, D. 1994, APJS, 94, 687
- Worthey et al. (1995) Worthey, G., Trager, S. C., and Faber, S. M. 1995 in Fresh Views of Elliptical Galaxies, ed. A. Buzzoni, A. Renzini and A. Serrano (San Francisco: ASP) p. 203