Recent results on two-photon physics at BABAR
Abstract:
We present measurements of the transition form factor for the momentum transfer range =4–40 GeV2 and the transition form factor for the range =2–50 GeV2. The results of the measurement of the mass, total and two-photon widths are also presented.
1 Introduction
The diagram for the process of the two-photon production of the pseudoscalar meson is shown in Fig. 1(left). The effect of strong interactions in this process is described only one form factor depending on the squared momentum transfers to the electrons.
The electrons in such process are scattered predominantly at small angle. Therefore, the two-photon processes are usually studied in so called no-tag mode with both final electrons undetected. In this case the virtual photons are practically real, the momentum transfers squared are close to zero. In no-tag mode the meson-photon transition form factor at zero ’s and the two-photon width of the meson are measured. In single tag-mode the one of the final electron is detected. The corresponding virtual photon is highly off-shell. From the measurement of the cross section we extract more rich information: the dependence of the meson form factor on .
At large perturbative QCD (pQCD) predicts that the transition form factor can be represented as a convolution of a calculable hard scattering amplitude for with a nonperturbative meson distribution amplitude (DA), [1]. The latter can be interpreted as the amplitude for the transition of the meson with momentum into two quarks with momenta and . The experimental data on the transition form factor can be used to test different phenomenological models for DA.
The cross section of the process falls very rapidly with increase of ( for ). Therefore, a precise measurement of the transition form factor can be performed only at high luminosity machines. We present the results of the measurements of the transition form factors for and mesons performed by the BABAR detector at the PEP-II collider. The results are based on data with integrated luminosity of about 450 fb-1 collected at the center-of-mass energy of 10.6 GeV. The single-tag events are selected with detected and identified electron and with fully reconstructed or . It is required that the transverse momentum of electron-plus-meson system be low and the missing mass in an event be close to zero.

2 Measurement of the transition form factor [2]
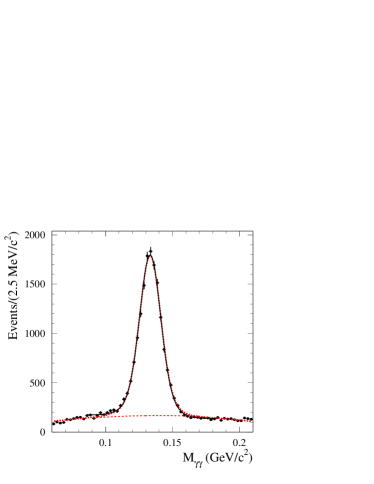
The meson is detected via its decay into two photons. The two-photon invariant mass spectrum for selected candidates is shown in Fig. 1(right). The clear peak is seen. The main non-peaking background process is so called virtual Compton scattering (VCS), the precess with one of the final electrons directed along the beam axis. The VCS photon together with a soft photon, for example from beam background, may give an invariant mass value close to the mass. The peaking background comes from the process of two-photon production of two ’s. This background is estimated from data and is about 10% of signal events. The total number of signal events determined from the fit to the mass spectrum in Fig. 1(right) is about 13000. This number is an order of magnitude large than the statistics of the previous measurement of the form factor by CLEO [3].
We measure the form factor in the region from 4 to 40 GeV2. The lower limit is determined by the detector acceptance for the electron. For GeV2 we do not see evidence of a signal over background. The data were divided into 17 intervals. For each interval the mass spectrum is fitted by a sum of signal and background distributions. From the measured spectrum we determine the differential cross section for and the transition form factor. The result for the form factor is shown in Fig.2. The errors shown are combined statistical and -dependent systematic. There is also -independent error equal to 2.3%. Main sources of the systematic uncertainties are background subtraction, data-MC simulation difference in the detector response, and the model uncertainty due to the unknown dependence of the form factor.
The comparison of our results with previous measurements [4, 3] is shown in Fig. 2(left). In the range from 4 to 9 GeV2 our results are in reasonable agreement with the measurements by the CLEO collaboration [3], but have significantly better precision.
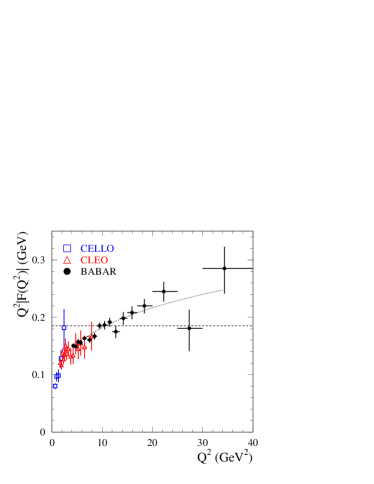
The horizontal dashed line indicates the asymptotic limit for the form factor. The value of the asymptotic limit ( GeV) is predicted by pQCD. The measured form factor exceeds the asymptotic limit at GeV2. This is an unexpected behavior; most models for the pion DA give form factor approaching the limit from below (see, e.g., Ref. [5] and references therein). Our data in the range from 4 to 40 GeV2 are well described by the function
| (1) |
with GeV and (dotted line in Fig. 2(left)). The effective dependence of the measured form factor is .
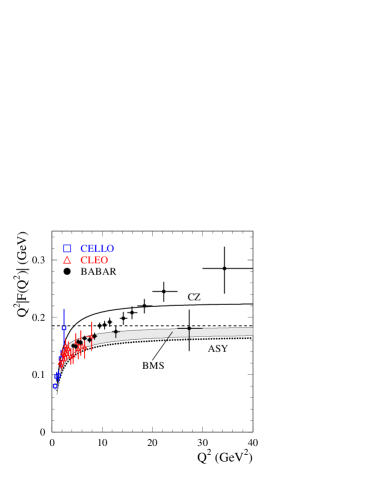
Fig. 2(right) demonstrates the comparison of our measurement with the result of the NLO QCD calculations performed by Bakulev, Mikhailov, and Stefanis [6] for the three models of the pion DA: asymptotic [7], Chernyak-Zhitnitsky (CZ) [8], and the DA derived from QCD sum rules with non-local condensates (BMS) [9]. There is a large difference between data and theory in dependence. We conclude that all these models are inadequate for GeV2. For GeV2 the theoretical uncertainties are expected to be smaller. In this region our data lie above asymptotic limit and are consistent with CZ model. It should be noted that the CZ DA is widest of the three DA’s discussed.
There are theoretical works which appeared after the publication of our result. Mikhailov and Stefanis [10] argue that the growth of form factor cannot be explained by higher-order pQCD and power corrections. Other works [11, 12, 13, 14] consider flat or very wide pion DA. With such distribution amplitude the dependence observed by BABAR is reproduced well.
3 Measurement of the transition form factor
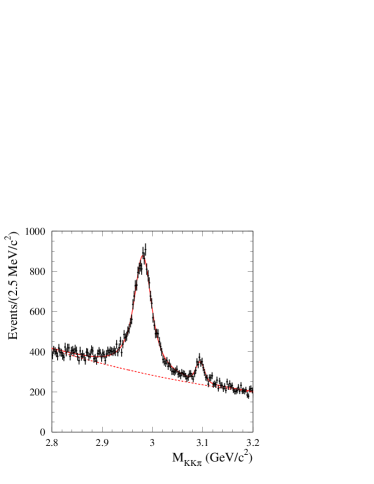
The two-photon production is studied both in no-tag and in single-tag modes. The is reconstructed via its decay to . The mass spectra for no-tag events is shown in Fig. 3(left) The and peaks are clearly seen. The ’s are produced in initial state radiation (ISR) process . From the fit to the mass spectrum we determine parameters:
These results are preliminary. Main sources of systematic uncertainties on the mass and width are unknown background shape and possible interference between and non-resonant two-photon amplitudes. The uncertainty on the detection efficiency dominates in the systematic uncertainty of . The results for the mass and width are in an agreement with the previous BABAR measurement [15]: MeV/ and MeV, obtained using 88 fb-1 data. The current PDG values for these parameters are MeV/ and MeV [16]. The obtained value of the product agrees with the PDG value keV [16], and also with the recent CLEO measurement keV [17].

We select single-tag events. This number can be compared with events selected in the previous single-tag measurement by L3 [18]. The single-tag data were divided into 11 intervals. For each interval we fit to the mass spectrum and determine number of events with . From the ratio of the measured spectrum to the number of the no-tag events we extract the normalized transition form factor shown in Fig. 3(right). The errors shown are combined statistical and -dependent systematic. There is also -independent error equal to 4.3%. Main source of the systematic error is the systematic uncertainty on detection efficiency.
The form factor data are fitted by the monopole function . The result of the fit is shown in Fig. 3(right) by solid line. The pole parameter is found to be . This value is in reasonable agreement with that expected from vector dominance, namely GeV2, and with the result of the lattice QCD calculation [19]. The dotted curve in Fig. 3(right) shows results of the leading-order pQCD calculation of Ref. [20]. The data lie systematically below this prediction.
4 Summary
The transition form factor has been measured for range from 4 to 40 GeV2. The unexpected -dependence for the form factor is observed for GeV2. The data lie above the asymptotic limit. This indicates that the pion distribution amplitude should be wide. The measurement stimulated development of new models for the form-factor calculation, in particular, with flat distribution amplitude [12, 13, 14].
The transition form factor has been measured for range from 2 to 50 GeV2. The form factor data are well described by the monopole form with pole parameter about 9 GeV2. The data are in reasonable agreement with both QCD and VDM predictions.
References
- [1] G. P. Lepage and S. J. Brodsky, Phys. Rev. D 22, 2157 (1980).
- [2] B. Aubert et al. [The BABAR Collaboration], Phys. Rev. D 80, 052002 (2009).
- [3] J. Gronberg et al. [CLEO Collaboration], Phys. Rev. D 57, 33 (1998).
- [4] H. J. Behrend et al. [CELLO Collaboration], Z. Phys. C 49, 401 (1991).
- [5] N. G. Stefanis, Nucl. Phys. Proc. Suppl. 181-182, 199 (2008).
- [6] A. P. Bakulev, S. V. Mikhailov, and N. G. Stefanis, Phys. Rev. D 67, 074012 (2003); Phys. Lett. B 578, 91 (2004).
- [7] G. P. Lepage and S. J. Brodsky, Phys. Lett. B 87, 359 (1979).
- [8] V. L. Chernyak and A. R. Zhitnitsky, Nucl. Phys. B 201, 492 (1982) [Erratum-ibid. B 214, 547 (1983)].
- [9] A. P. Bakulev, S. V. Mikhailov, and N. G. Stefanis, Phys. Lett. B 508, 279 (2001) [Erratum-ibid. B 590, 309 (2004)].
- [10] S. V. Mikhailov and N. G. Stefanis, Nucl. Phys. B 821, 291 (2009).
- [11] A. E. Dorokhov, arXiv:0905.4577 [hep-ph].
- [12] A. V. Radyushkin, arXiv:0906.0323 [hep-ph].
- [13] M. V. Polyakov, arXiv:0906.0538 [hep-ph].
- [14] H. Li and S. Mishima, arXiv:0907.0166 [hep-ph].
- [15] B. Aubert et al. [BABAR Collaboration], Phys. Rev. Lett. 92, 142002 (2004).
- [16] Particle Data Group, 2009 partial update for the 2010 edition, http://pdg.lbl.gov.
- [17] D. M. Asner et al. [CLEO Collaboration], Phys. Rev. Lett. 92, 142001 (2004).
- [18] M. Acciarri et al. [L3 Collaboration], Phys. Lett. B 461, 155 (1999).
- [19] J. J. Dudek and R. G. Edwards, Phys. Rev. Lett. 97, 172001 (2006).
- [20] T. Feldmann and P. Kroll, Phys. Lett. B 413, 410 (1997).