First redshift determination of an optically/UV faint submillimeter galaxy using CO emission lines
Abstract
We report the redshift of a distant, highly obscured submm galaxy (SMG), based entirely on the detection of its CO line emission. We have used the newly commissioned Eight-MIxer Receiver (EMIR) at the IRAM 30 m telescope, with its 8 GHz of instantaneous dual-polarization bandwidth, to search the 3-mm atmospheric window for CO emission from SMM J14009+0252, a bright SMG detected in the SCUBA Lens Survey. A detection of the CO(3–2) line in the 3-mm window was confirmed via observations of CO(5–4) in the 2-mm window. Both lines constrain the redshift of SMM J14009+0252 to , with high precision (). Such observations will become routine in determining redshifts in the era of the Atacama Large Millimeter/submillimeter Array (ALMA).
1 Introduction
Sensitive blank-field mm and submm continuum surveys have discovered hundreds of dusty, star-forming submm galaxies (SMGs) over the past decade (e.g. Smail, Ivison & Blain, 1997; Barger et al., 1999; Borys et al., 2003; Greve et al., 2004; Coppin et al., 2006). Determining their redshift distribution has been much slower, however, because the large dust content of SMGs means that they often have only weak (if any) counterparts in the rest-frame ultraviolet and optical, making spectroscopic redshift determinations extremely difficult (e.g. Smail et al., 2002; Dannerbauer et al., 2002). Furthermore, the poor spatial resolution of mm/submm continuum surveys (typically 11–19′′) means that several potential, faint optical/near-IR counterparts exist. This requires deep radio or Spitzer mid-IR images to pinpoint the most likely counterpart for optical spectroscopic follow-up observations (e.g. Ivison et al., 2002, 2004). The largest SMG redshift survey published so far was based on radio-identified SMGs (Chapman et al., 2005), which may bias the redshift distribution since radio emission may remain undetected even in the deepest radio maps for sources at .
A promising alternative route to determine the redshift of an SMG is through observations of CO emission lines at cm or mm wavelengths. These lines arise from the molecular gas, the fuel for star formation and can thus be related unambiguously to the submm continuum source. Therefore, these observations do not require any additional multi-wavelength identification and circumvent many of the problems inherent to optical spectroscopy of SMGs.
The narrow bandwidth of existing mm receivers, however, placed severe limitations on this approach as it was too time-consuming to search blindly for the CO lines in redshift space via multiple frequency tunings. In recent years, a lot of effort has been invested in overcoming this bandwidth limitation at various radio facilities (e.g. Naylor et al., 2003; Erickson et al., 2007; Harris et al., 2007). With the commissioning of the multi-band heterodyne receiver, EMIR, at the IRAM 30 m telescope, this situation has greatly improved. EMIR’s 8-GHz instantaneous, dual-polarization bandwidth in the 3-mm band provides the same spectral coverage as ALMA. Combined with the large collecting area of the 30 m telescope this allows for blind searches for high-redshift CO lines at mm wavelengths.
To demonstrate the capabilities of EMIR as a ‘redshift machine’, we targeted SMM J14009+0252. This source was discovered by the Submillimeter Common User Bolometer Array (SCUBA) in early 1998 and is one of the brightest SMGs discovered to date ( mJy, Ivison et al., 2000). Despite several attempts, and the availability of an accurate radio position, no spectroscopic redshift could be determined – mainly because of its faintness at near-IR/optical wavelengths. In this letter we report the results of our blind search for CO lines in this SMG.
2 Observing Strategy
The 3-mm (E090) set-up of EMIR provides 8 GHz of instantaneous, dual-polarization bandwidth. The entire accessible frequency range, GHz, can be covered with five tunings. This corresponds to 00.4 for CO(1–0) and 1.08.7 for the CO lines between () and (7–6), with only a small gap at 1.781.98. The gap can be covered by 2-mm observations, i.e. EMIR is a powerful instrument to search for high-redshift (1) CO emission.
Observations were made in July 2009 during average summer conditions (7 mm precipitable water vapor). Data were recorded using 16 units of the Wideband Line Multiple Autocorrelator (WILMA, 1 GHz of bandwidth each) to cover 8 GHz in both polarizations. WILMA provides a spectral resolution of 2 MHz which corresponds to 5-7 km s-1 for the 3-mm band. The observations were done in wobbler-switching mode, with a switching frequency of 1 Hz and an azimuthal wobbler throw of 100′′. Pointing was checked frequently on the nearby quasar J1226+023 and was found to be stable to within . Calibration was done every 12 min using the standard hot/cold-load absorber. The data were processed with the CLASS software. We omitted scans with distorted baselines and subtracted only linear baselines from individual spectra.
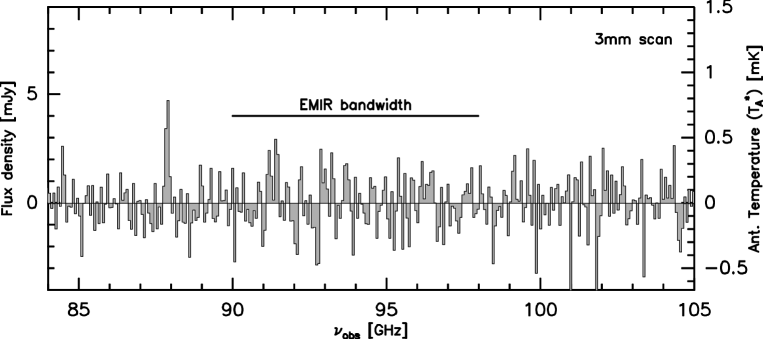
We first scanned the full 3-mm tuning range of EMIR with 2 hr of observing for each tuning. The tunings were spaced to provide 500 MHz overlap. Excellent receiver noise temperatures across the band (35-45 K) resulted in typical system temperatures of 100 K. The resulting spectrum had an r.m.s. noise level of 0.5 mK ( mJy) at a velocity resolution of 200 km s-1 but did not show clear evidence for CO line emission. We then increased the integration time for the lower part (105 GHz) of the 3-mm band until we reached an average r.m.s. noise level of 0.2 mK (1.2 mJy). The resulting spectrum, shown in Fig. 1, shows a line at 88 GHz.
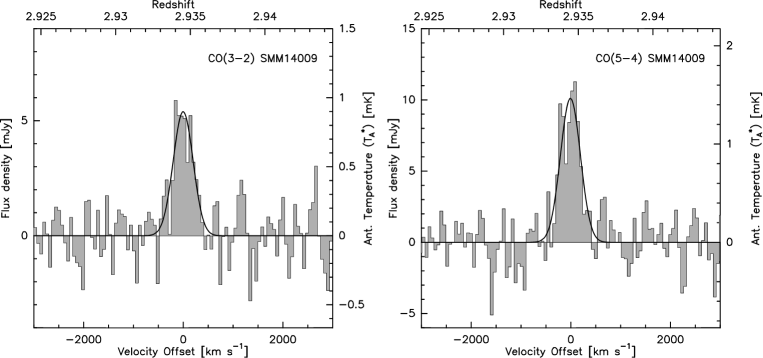
At this stage the source redshift was still not determined as it was not clear which CO transition was detected in the 3-mm scan. We therefore used the dual-frequency 3-/2-mm (E090/E150) set-up of EMIR to search for a second CO transition in the 2-mm band and to increase the signal-to-noise ratio of the 3-mm line. In this configuration, each frequency band has an instantaneous, dual-polarization bandwidth of 4 GHz. The 2-mm mixers were tuned to 146.5 GHz, under the assumption that the 3-mm line was the CO(3–2) transition at . At this frequency the receiver noise temperature was 30 K, yielding a system temperature of 120 K. SMM J14009+0252 was observed in the dual-frequency set-up for 5 hr and we clearly detected a second line in the 2-mm band (see Fig. 2). Additional 2-mm data were taken in an attempt to observe a third CO line in the 1-mm band (E150/E230 configuration). Given the relatively poor observing conditions, the 1-mm data did not yield a meaningful limit.
The beam sizes/antenna gains for the line frequencies at 3 and 2 mm are 28′′/6.0 Jy K-1 and 15′′/6.5 Jy K-1, respectively. We estimate the flux density scale to be accurate to 10–15%.
3 Results
The final 3- and 2-mm spectra are shown at a velocity resolution of 60 km s-1 in Fig. 2. The r.m.s. noise level () for both spectra is 160 K (1.0 mJy) and 180 K (1.3 mJy) at 3 and 2 mm, respectively. Both lines are detected at high significance (9 and 12 for the integrated intensities). The line profiles for both lines are very similar and well described by a single Gaussian with a FWHM of 470 km s-1. The parameters derived from Gaussian fits to both line profiles are given in Table 1. The frequencies unambiguously identify the lines as CO(3–2) and CO(5–4) (see our discussion below). Combining the centroids of both lines, we derive a variance-weighted mean redshift for SMM J14009+0252 of .
| Line | |||||||
|---|---|---|---|---|---|---|---|
| [GHz] | [mJy] | [ km s-1] | [Jy km s-1] | [1010 K km s-1pc2] | [10] | ||
| CO(3–2) | 87.888(8) | 2.93450(35) | |||||
| CO(5–4) | 146.469(9) | 2.93438(26) |
4 Discussion
At first glance the observed frequencies can not only be interpreted as CO(3–2) and CO(5–4) at but also as CO(6–5) and CO(10–9) at or even CO(9–8) and CO(15–14) at . The CO ladder, however, is not equidistant in frequency which results in small, but significant differences for the frequency separation of the line-pairs as a function of rotational quantum number. The frequency separation is 58.577, 58.532 and 58.458 GHz for the CO line-pairs at redshifts 2.93, 6.88 and 10.80, respectively. Our observations yield GHz which identifies the lines as CO(3–2) and CO(5–4) at . Our redshift confirms earlier photometric redshift estimates by Ivison et al. (2000, based on and based on the whole spectral energy distribution (SED)), Yun & Carilli (2002, based on the dust SED) and more recently by Hempel et al. (2008, based on optical/IR photometry).
With the precise redshift and the observed CO line luminosities in hand we can estimate the molecular gas content of SMM J14009+0252. The observed CO(5–4) to CO(3–2) line ratio (0.7) implies that the CO emission is sub-thermally excited, at least for the CO(5–4) line. This line ratio is identical to that observed for SMM J16359+6612 (Weiß et al., 2005) and we employ the large velocity gradient models discussed in that paper to estimate a CO(1–0) line luminosity of K km s-1 pc2. This translates into a molecular gas mass of using a standard ULIRG conversion factor of 0.8 M⊙ (K km s-1 pc2)-1 (Downes & Solomon, 1998). These numbers take the lens magnification of due to the foreground cluster, Abell 1835 at , into account (Ivison et al., 2000).
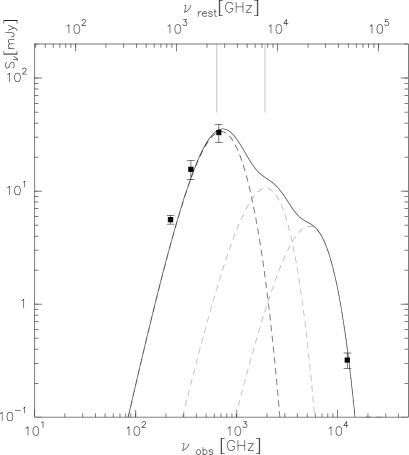
The large molecular gas mass is in line with estimates based on the dust continuum measurements. The 1350-, 850- and 450-µm observations (see Ivison et al., 2000, for a compilation of the observed flux densities) can be described by a dust temperature of K (similar to the kinetic temperature of the CO model) and a gas mass of using the dust model in Weiß et al. (2007) and a gas-to-dust mass ratio of 100. The implied far-IR luminosity (integral between 40-120µm, Helou et al. (1985)) of this model is which corresponds to a star-formation rate of M⊙ yr-1. These numbers classify SMM J14009+0252 as a ULIRG.
We note, however, that this model underestimates the observed 24-µm flux density and additional warmer dust components are required to fit the mid-IR data (see Fig. 3). Such a multi-component dust model predicts , although the lack of data between 24 and 450 µm means that the shape of the Wien tail of the dust SED is not well constrained. In any case the estimated far-IR luminosity is far () lower than estimates based on the radio/far-IR correlation (Condon, 1992) which supports the conclusion of Ivison et al. (2000) that SMM J14009+0252 contains a radio-loud active galactic nucleus.
References
- Barger et al. (1999) Barger, A.J., Cowie, L.L., Sanders, D.B., 1999, ApJ, 518, 5
- Borys et al. (2003) Borys, C., Chapman, S.C., Halpern, M., Scott, D., 2003, MNRAS, 334, 385
- Chapman et al. (2005) Chapman, S.C., Blain, A.W., Smail, I., & Ivison, R.J. 2005, ApJ, 622, 772
- Condon (1992) Condon, J.J. 1992, ARA&A, 30, 575
- Coppin et al. (2006) Coppin, K., et al. 2006, MNRAS 372, 1621
- Dannerbauer et al. (2002) Dannerbauer, H., Lehnert, M.D., Lutz, D., Tacconi, L., Bertoldi, F., Carilli, C., Genzel, R., Menten, K. 2002 ApJ, 573, 473
- Downes & Solomon (1998) Downes, D., & Solomon, P.M. 1998, ApJ, 507, 615
- Erickson et al. (2007) Erickson, N., Narayanan, G., Goeller, R., & Grosslein, R. 2007, ASPC, 375, 71
- Greve et al. (2004) Greve, T.R., Ivison, R.J., Bertoldi, F., et al. 2004, MNRAS, 354, 779
- Harris et al. (2007) Harris, A.I., et al. 2007 ASPC, 375, 82
- Helou et al. (1985) Helou, G., Soifer, B.T., & Rowan-Robinson, M. 1985, ApJ, 298, 7
- Hempel et al. (2008) Hempel, A., Schaerer, D., Egami, E., Pelló, R., Wise, M., Richard, J., Le Borgne, J.F., & Kneib, J.P. 2008, A&A, 477, 55
- Ivison et al. (2000) Ivison, R.J., Smail, Ian, Barger, A.J., Kneib,J.-P., Blain, A.W., Owen, F.N., Kerr, T.H.& Cowie, L.L. 2000, MNRAS, 315, 209
- Ivison et al. (2002) Ivison, R.J. et al. 2002, MNRAS, 337, 1
- Ivison et al. (2004) Ivison, R.J., Greve, T.R., Serjeant, S. et al. 2004 ApJS, 154, 124
- Naylor et al. (2003) Naylor, B.J., et al. 2003, SPIE, 4855, 239
- Smail, Ivison & Blain (1997) Smail, I., Ivison, R.J, & Blain, A.W., 1997, ApJ, 490, 5
- Smail et al. (2002) Smail, I., Ivison, R.J., Blain, A.W., & Kneib, J.P. 2002, MNRAS, 331, 495
- Spergel et al. (2003) Spergel, D.N., et al. 2003, ApJS, 148, 175
- Weiß et al. (2005) Weiß, A., Downes, D., Walter, F., & Henkel, C. 2005 A&A, 440, 45
- Weiß et al. (2007) Weiß, A., Downes, D., Neri, R., Walter, F., Henkel, C., Wilner, D.J., Wagg, J., Wiklind, T. 2007 A&A, 467, 955
- Yun & Carilli (2002) Yun, M.S., & Carilli, C.L. 2002, ApJ, 568, 88