The role of the synchrotron component in the mid infrared spectrum of M 87
Abstract
We study in detail the mid-infrared Spitzer-IRS spectrum of M 87 in the range 5 to 20 m. Thanks to the high sensitivity of our Spitzer-IRS spectra we can disentangle the stellar and nuclear components of this active galaxy. To this end we have properly subtracted from the M 87 spectrum, the contribution of the underlying stellar continuum, derived from passive Virgo galaxies in our sample. The residual is a clear power-law, without any additional thermal component, with a zero point consistent with that obtained by high spatial resolution, ground based observations. The residual is independent of the adopted passive template. This indicates that the 10m silicate emission shown in spectra of M 87 can be entirely accounted for by the underlying old stellar population, leaving little room for a possible torus contribution. The MIR power-law has a slope 0.77-0.82 (S), consistent with optically thin synchrotron emission.
Subject headings:
– galaxies: individual (M 87) – galaxies: elliptical and lenticular, cD – galaxies: active – galaxies: jets – Infrared: galaxies1. Introduction
Bressan et al. (2006) presented high signal-to-noise ratio Spitzer Infrared Spectrograph (IRS) observations of 18 Virgo early-type galaxies (ETGs hereafter), selected from those that define the color-magnitude relation of the cluster, with the aim of detecting the silicate emission of their dusty, mass-losing evolved stars. They found that 13 ETGs, i.e.76% of the sample, show a pronounced broad silicate feature that is spatially extended and likely of stellar origin, in agreement with model predictions of old populations (Bressan et al., 1998). The absence of any other feature in their spectra suggested that these galaxies could be considered as the prototype of passively evolving ETGs. In contrast, the IRS spectrum of the other four ETGs presented various levels of activity.
Among these, NGC 4486 (M 87), the well-known giant elliptical located at the cluster centre, stands out. Its mid-infrared (MIR hereafter) spectrum, besides narrow atomic emission lines, shows an excess of emission at longer wavelengths with respect to passive ETGs. The silicate emission at 10m is also evident in the spectrum, and since M 87 hosts a strong central radio source (Virgo A) and a jet, visible from radio to X-ray wavelengths, it could be an indication of possible torus emission, as already found in other AGNs (Siebenmorgen et al. 2005, Shi et al. 2006, Perlman et al. 2007).
The importance of the torus in the context of the AGN energetics makes the debate about the origin of the nuclear MIR emission in M 87 very intriguing. Early, high spatial resolution, ground-based MIR observations of M 87 (Perlman et al., 2001; Whysong & Antonucci, 2004) have shown that the emission from the nucleus is consistent with synchrotron emission. Both investigations have excluded the possibility that M 87 hosts a quasar-like nucleus similar to that at the center of Cen A. However, neither could exclude the possibility of a low-luminosity AGN. Indeed Perlman et al. (2001) detected a faint, extended, circum-nuclear component that could originate in a torus contributing 7% of the nuclear luminosity. Alternatively, they suggested that this extended component could be stellar emission from red giant stars. More recently, Perlman et al. (2007) reanalyzed this issue by means of high resolution ground based imaging and Spitzer spectroscopy. They confirmed the consistency with synchrotron emission for the MIR fluxes of the knot A/B complex in the jet. However, they measured a spectral index 0.41, much lower than before and different from that found in the nearby structures (e.g. Shi et al., 2007). They still noticed deviations from the pure synchrotron emission and speculated that, at least in the shorter wavelength range, this could be due either to contribution from M and K stars or contamination from the low frequency tail of the emission from knot HST-1, not resolved by Spitzer but also not apparent in the 11.7m SUBARU image of the nucleus.
We revisit here the nature of the MIR emission of M 87 exploiting our high signal-to-noise Spitzer spectra of passively evolving ETGs. Taking advantage of these data we have constructed very accurate MIR templates of the stellar populations in these galaxies (Valdes et al. 2009, in prep.).
These templates will be used to disentangle the nuclear non-stellar emission of M 87 by a proper subtraction process.
In section 2 we summarize our Spitzer IRS observations and data extraction as well as all supplementary data needed to perform the subtraction. In section 3 we describe the subtraction of the spectral energy distribution (SED) of a passive ETG from the IRS spectrum of M 87 while, in section 4 we discuss the properties of the residual component. Our conclusions are presented in section 5.
2. Observations
In this section we describe how we have obtained the NIR/MIR SEDs of M 87, and of three other elliptical galaxies, NGC 4365, NGC 4382 and NGC 4636. These were selected to be ”passive”, insofar as they show no evidence of either recent past star formation or AGN activity. They will be used as templates for the stellar component in our attempt to isolate the non stellar emission of the nucleus of M 87.
2.1. Spitzer IRS
Standard staring mode short (SL1 and SL2) and long (LL2) low resolution IRS spectral observations of M 87 and other selected Virgo cluster ETGs were obtained during the first Spitzer General Observer Cycle on 2005 June 1 as part of program ID 3419 (PI A. Bressan). The spectra were extracted in a fixed aperture (3.6”18” for SL and 10.2”10.4” for LL), using a purpose built program that allows the reconstruction of the intrinsic galaxy profile (Bressan et al., 2006).
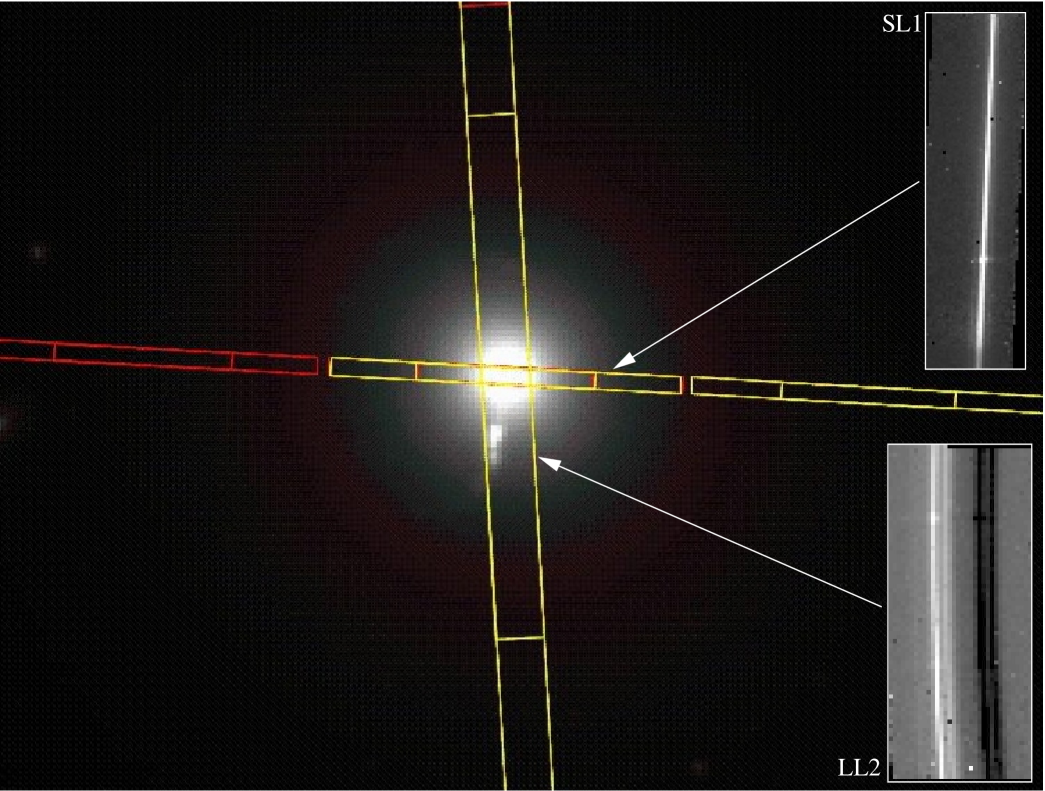
Position angles of the SL (3.6” wide) and LL (10.2” wide) IRS slits in the case of M 87, are shown superimposed to the MIPS 24m image, in Figure 1. At these wavelengths the emission of NGC 4486 appears quite complex even at the low resolution of MIPS 24m. Perlman et al. (2001) have provided a thorough description of the MIR spatial emission of the central regions of M87. Their 10.8 m image shows the “nucleus” and the D, F and A, B and C knots, whose fluxes are reported in their Table 1. To check which of these external components can affect our spectra we show the 2-D spectral images of of the LL2 and SL1 segments in the bottom and top panels of Figure 1, respectively. In the LL2 slit we can easily recognize both the spectra of the nucleus and that of the nearest bright A, B and C knots, whereas the SL1 slit is clearly not affected by these three components. Thus, the only extra-nuclear component that may contribute to our SL spectrum is knot D. However this feature is located 3” from the nucleus, has low level flux (7% of the nucleus, Perlman et al. 2001) and thus is likely to provide only a negligible contribution to the SL spectrum. The other components, located at greater distances, are well outside the SL slit. On the other hand our LL slit contains the strong knots A, B and C that are clearly visible in the spectral images. In this case the extraction is limited to a width of 10.4” in order to avoid these strong knots that are not present in SL. As we will see later our results are independent of the inclusion or exclusion of the LL segment from our analysis.
The estimate of the flux emitted by an extended source within a fixed slit aperture involves the deconvolution of the received flux with the PSF of the instrument. This correction is important to obtain the shape of the intrinsic spectral energy distribution (SED) of the galaxy, because from the slit loss correction we have estimated that for a point source the losses due to the PSF amount to 20% at 5m and to 40% at 15m. Conversely, a uniform source will suffer no net losses. In order to recover the intrinsic SED we have convolved a surface brightness profile model with the instrumental PSF, and we have simulated the corresponding linear profile along the slits, taking into account the relative position angles of the slits and the galaxy. The adopted intrinsic model profile is a wavelength dependent two dimensional modified King law (Elson at al. 1987):
| (1) |
where and are the coordinates along the major and minor axis of the galaxies, is the axial ratio taken from the literature. , and are free parameters that are functions of the wavelength and are obtained by fitting the observations with the simulated profile. In order to get an accurate determination of the parameters of the profiles several wavelength bins have been co-added. This procedure allows us (i) to recognize whether a particular feature is resolved or not, (ii) to reconstruct the intrinsic profile of the source and (iii) to account for the wavelength dependent PSF losses, in a more general way than for point like sources.
Examples of the fitting procedure for NGC 4486 at two selected wavelengths are shown in Fig.2. The dashed lines show the reconstructed one dimensional intrinsic spatial emission profiles (in electrons/s) sampled along the slit, while the solid lines represent the corresponding one dimensional PSF convolved models that are fitted to the data. The error bars in the figure show 1- uncertainties that were computed taking into account the Poissonian noise from the source and the background, the readout noise and dark current noise, as described in the Spitzer Observer Manual. The spatial emission parameters obtained for all the galaxies used in this paper are shown in Table 1.


At short IRS wavelengths the spatial emission of NGC 4486 appears complex. It is a superposition of an unresolved central component and an extended component. Indeed, in fitting only a single component to the data we find an unresolved central source with =0.1”. Nonetheless, there is an evident excess over this unresolved component beyond , that does affect our rectangular extraction, 18” long. The excess remains visible up to 14m beyond which the profile is clearly that of the PSF (=0.1”), and the excess in the wings is much less important. From this spatial analysis we conclude that NGC 4486 is progressively more dominated by un unresolved nuclear component as the wavelength increases. However, the presence of an underlying extended emission, evident at 5 m, can be detected even at 9m. Since we have shown that the external jet does not contribute to the SL segment, we argue that this emission is of stellar origin.
2.2. Other Observations
| 5.4m | 14.0m | |||
|---|---|---|---|---|
| GALAXY | ||||
| NGC 4486 | 0.1 | 0.5 | 0.1 | 0.7 |
| NGC 4365 | 3.5 | 2.0 | 4.0 | 2.2 |
| NGC 4382 | 1.3 | 1.4 | 1.6 | 1.3 |
| NGC 4636 | 3.7 | 0.8 | 3.5 | 0.9 |
IRAC fluxes were measured from archival “post basic calibrated data” images using a customized program written in IDL. Before flux measurements, the background in each image was determined as the modal sky value of the off-source portion of each image. Fluxes were then measured in circular apertures centred on each galaxy. The error on each flux measurement was calculated as the quadrature sum of the calibration error (taken to be 10%) and the standard deviation of the background value. The calibration error is the dominant term.
In order to place M 87 IRAC and IRS data on the same flux scale, we measured IRAC 5.8 m fluxes in the circular aperture containing the same flux sampled by IRS at the same wavelengths This aperture has a radius of 4″ and has been selected as the reference aperture for any band. Consequently, all broad band fluxes in all other galaxies were measured within the same aperture and their IRS spectra were normalized to their flux in IRAC channel 3.
In the case of M 87, we have also measured the emission at 24m from the MIPS image, which may serve as a useful check for our IRS extraction procedure. Since the IRS extraction procedure indicates that toward these wavelengths M87 is dominated by the nuclear component, we have taken into account the effects of the PSF to obtain the MIPS 24m flux. To this end we have divided the flux measured within the nuclear radius aperture with the fractional energy of the MIPS 24m PSF image, encircled by the same radius.
NIR images of the sample galaxies in the J, H and Ks bands were downloaded from the All-Sky Data Release from the Two Micron All Sky Survey. 111NASA/IPAC Infrared Science Archive for NASA Infrared and Submillimeter Data chartered to serve calibrated science products from NASA’s infrared and submillimeter missions. 2MASS Image Services provide the users calibrated images that contain photometric zero point information in their headers and are suitable for quantitative photometric measurements.
Using these data, in addition to our IRS spectra, we have obtained the NIR/MIR SED of M87 and of the other three ETGs that will be used as templates for the subtraction of the stellar component.
3. Stellar component subtraction
In order to disentangle the nuclear and the extended component we resort to the comparison of the high signal-to-noise spectral energy distribution (SED) of M 87 with that of the passive ellipticals we have also observed with Spitzer. Here we describe the process of subtraction of the stellar component.
Before subtraction, all the template galaxy SEDs were normalized to the flux of M 87 in the 2MASS Ks band. This band was selected because it is the nearest band to the IRS spectrum with a negligible non-stellar component. The NIR/MIR SED of M 87 and of the template ETGs, after this normalization, are shown in Figure 3.
We notice that all SEDs are very similar in the NIR bands. This similarity, that extends to optical wavelengths, indicates a uniformity of the underlying stellar populations. The SEDs of passive ETGs are very similar also in the MIR, especially where the integrated spectrum is dominated by the stellar photospheres, i.e. below 8m. At longer wavelengths some differences appear, likely caused by small differences in the average properties of circumstellar envelopes of mass loosing AGB stars (Bressan et al., 2006). This uniformity is strengthened by the recent comparison of the surface brightness distribution in the Ks and IRS Peak-up 16m bands, of bright ETGs in Virgo and Coma clusters (Clemens et al., 2009). NGC 4636 shows also narrow emission lines but its stellar continuum is that of a passive elliptical.
In contrast, M 87 shows a clear MIR excess which reaches about one order of magnitude at 20m (see also Perlman et al. 2007). An estimate of the quality of our IRS extraction process is provided by the independent measure of the 24m MIPS flux, plotted in the same figure.
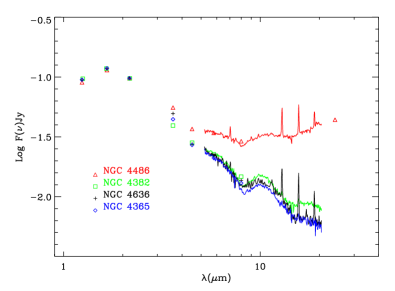
In summary, inspection of Figure 3 shows that M87 stands out in the MIR spectral window. In this region, we hypothesize that the stellar populations of M 87 and the other passive ETGs are similar, and we subtract the spectra of the passive ETGs from that of M 87.
| Galaxy | S/FKs | S3.6 | S11.7 | ||
|---|---|---|---|---|---|
| Template | mJy | mJy | |||
| NGC 4365 | 0.7660.004 | 0.7560.007 | 0.06 | 8.9 | 20.0 |
| NGC 4382 | 0.8070.005 | 0.8210.007 | 0.05 | 7.7 | 21.3 |
| NGC 4636 | 0.8170.005 | 0.7740.008 | 0.06 | 8.1 | 22.0 |
4. The residual component
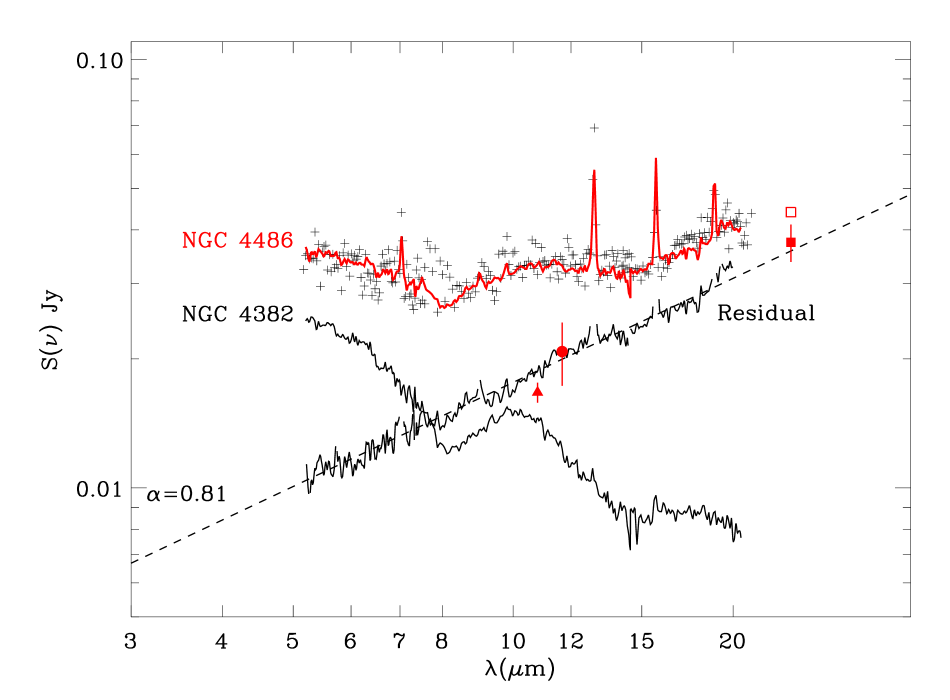
To highlight the nature of the MIR excess we simply subtract the SEDs of the passive ETGs from that of M 87. Figure 4 shows the results obtained using the SED of NGC 4382, but similar results are obtained adopting the other galaxies as templates for the stellar emission. The residual, without emission lines that have been masked out, is well-fitted with a power-law and does not show any evidence of other particular features reminiscent of additional emission components. This is even more surprising considering the prominent broad features visible in the stellar template and given the relative contribution of the stellar and non-stellar components. Table 2 summarizes the power-law exponents (S), the fractional contribution of the power-law in the Ks band, and its absolute flux at 3.6 and 11.7m, for the three templates adopted. Errors in the exponents are only formal errors of the fits and do not include errors from the normalizations involved in our procedure. A realistic uncertainty is provided by the range of slopes obtained with different galaxy templates.
Our residual flux (Table 2) is consistent with the high resolution, ground based nuclear values by Perlman et al. (2007) (Sν= 20.83.5 mJy at 11.67m, FWHM=, Figure 4 red dot) and Perlman et al. (2001) (S mJy at 10.8m, FWHM, Figure 4 red triangle). In the same Figure, we have also plotted the observed MIPS 24 m flux, before (open square) and after (filled square) a 15% correction due to the contribution of stars, estimated from the extrapolation of the passive elliptical template. The MIPS 24 m flux is also a time independent measure and falls on the same residual power-law
The power-law has a slope between 0.77-0.82, depending on the adopted stellar population template. This value is significantly larger than that found by Perlman et al. (2007) (0.41). They fitted different IRS observations (PID82, Rieke), within a lower extraction width and using the spectral range 7.5 to 15m, specifically selected to avoid the shorter wavelength region where the contamination from the stars could be significant. This large discrepancy could be real, for example due to a variability of the nuclear component, or could simply be due to the different method adopted for the analysis. To understand its origin we have re-analysed the IRS data set used by Perlman et al. (2007), with our extraction procedure. The resulting spectrum is plotted in Figure 4 (crosses). We notice that our flux values are larger than those published by Perlman et al. (2007), but this is due to the 2.5 times larger extraction width that we have adopted. Since, apart from this, the two IRS datasets are very similar, we argue that the different values of the slope arise from the different approach adopted. A crude fit to our M 87 SED, in the 7.5 to 15m region, gives a slope 0.17. But in our case the strength of the underlying stellar population is not negligible and changes from 70% at 5 m to 25% at 15 m. After the subtraction, the slope of the residual is 0.8. Within the smaller aperture used by Perlman et al. (2007) the contribution of the stellar population is certainly less severe than in our case, but not negligible, in particular around 7.5 m. The lack of this correction is most likely the cause of the different slope obtained.
Finally, we notice that the slope we derived is more consistent with the previous Perlman et al. (2001) analysis. Our slope is also similar to the value found for jet knots A/B and C/G by Shi et al. 2007, and to the slope found at radio wavelengths when the entire, extended radio source is measured.
5. Conclusions
Exploiting our high signal-to-noise Spitzer IRS spectra and broad band data from the literature, we have built template SEDs of the passive stellar populations in ETGs. After a passive stellar component is properly subtracted from our M 87 IRS spectrum, the residual, almost independent of the adopted template, is a power-law, and lacks any signature of the 10m feature. This suggests that the 10m bump observed in the IRS spectrum of M 87 can be entirely explained in terms of the underlying stellar population, typical of all other passively evolving Virgo ellipticals (Bressan et al. 2006). The residual intensity matches fairly well the high spatial resolution ground based SUBARU nuclear measurements at 10.8m and 11.67m, by Perlman et al. (2001) and Perlman et al. (2007), respectively. Since the contribution of stars at these wavelengths is not negligible, this indicates that our procedure, even if applied to a large aperture (r4″ corresponding to 300 pc at 16 Mpc) is accurate enough to reveal the emission from the 1″ core.
The slope of the power law is strikingly similar to that found for the nearby jet knots and for the large aperture radio data.
The above findings confirm, in a new independent way, that the inner (1”) core of M 87 is dominated by synchrotron emission, leaving little room for a torus component (Whysong & Antonucci, 2004; Perlman et al., 2007).
Since the signatures of MIR silicate emission have been detected in many AGN observed with Spitzer (Siebenmorgen et al., 2005; Shi et al., 2006), we suggest that, in some circumstances, the underlying stellar population may be an important component to be taken into consideration.
References
- Bower et al. (1992) Bower, R. G., Lucey, J. R., & Ellis, R. S. 1992, MNRAS, 254, 589
- Bressan et al. (1998) Bressan, A., Granato, G.L., & Silva, L. 1998, AA, 332, 135
- Bressan et al. (2006) Bressan, A., Panuzzo, P., Buson, L., Clemens, M., Granato, G. L., Rampazzo, R., Silva, L., Valdes, J. R., Vega, O., & Danese L. 2006, ApJ, 639, L55
- Clemens et al. (2009) Clemens, M. S., Bressan, A., Panuzzo, P., Rampazzo, R., Silva, L., Buson, L., & Granato, G. L. 2009, MNRAS, 392, 982
- Elson et al. (1987) Elson, R. A. W., Fall, S. M., & Freeman, K. C. 1987, ApJ, 323, 54
- Higdon et al. (2004) Higdon, S.J.U., Devost, D., Higdon, J. L., Brandl, B. R., Houck, J. R., Hall, P., Barry, D., Charmandaris, V., Smith, J. D. T., Sloan, G. C., & Green, J. 2004, PASP, 116, 975
- Perlman et al. (2001) Perlman, E. S., Sparks, W. B., Radomski, J., Packham, C., Fisher, R. S., Piña, R., & Biretta, J. A. 2001, ApJ, 561, L51
- Perlman et al. (2007) Perlman, E. S., Mason, R. E., Packham, C., Levenson, N. A., Elitzur, M., Schaefer, J.J., Imanishi, M., Sparks, W.B., & Radomski, J. 2007, ApJ, 663, 808
- Shi et al. (2006) Shi, Y., Rieke, G. H., Hines, D. C., Gorjian, V., Werner, M. W., Cleary, K., Low, F. J., Smith, P. S.,& Bouwman, J. 2006, ApJ, 653, 127
- Shi et al. (2007) Shi, Y., Rieke, G. H., Hines, D. C., Gordon, K. D., & Egami, E. 2007, ApJ, 655, 781
- Siebenmorgen et al. (2005) Siebenmorgen, R., Haas, M., Krügel, E., & Schulz, B. 2005, A&A, 436, L5
- Whysong & Antonucci (2004) Whysong, D., & Antonucci, R. 2004, ApJ, 602, 116