Low-velocity streams in the solar neighborhood caused by the Galactic bar
Abstract
We find that a steady state bar induces transient features at low velocities in the solar neighborhood velocity distribution due to the initial response of the disc, following the formation of the bar. We associate these velocity streams with two quasi-periodic orbital families, librating around the stable and orbits near the bar’s outer Lindblad resonance (OLR). In a reference frame moving with the bar, these otherwise stationary orbits precess on a timescale dependent on the strength of the bar, consistent with predictions from a simple Hamiltonian model for the resonance. This behavior allows the two orbital families to reach the solar neighborhood and manifest themselves as clumps in the u-v plane moving away from (), and toward () the Galactic center. Depending on the bar parameters and time since its formation, this model is consistent with the Pleiades and Coma Berenices, or Pleiades and Sirius moving groups seen in the Hipparcos stellar velocity distribution, if the Milky Way bar angle is and its pattern speed is , where is the angular velocity of the local standard of rest (LSR). Since the process is recurrent, we can achieve a good match about every six LSR rotations. However, to be consistent with the fraction of stars in the Pleiades, we estimate that the Milky Way bar formed Gyr ago. This model argues against a common dynamical origin for the Hyades and Pleiades moving groups.
Subject headings:
stellar dynamics, Galactic bar, solar neighborhood1. Introduction
The Milky Way bar is hard to observe directly due to our position in the Galactic disc. Thus, its parameters, such as orientation of its major axis with respect to the Sun-Galactocentric line and angular velocity, have been inferred indirectly from observations of the inner Galaxy (e.g., Blitz and Spergel 1991; Weinberg 1992).
However, numerical modeling suggests that the bar can also affect the local stellar velocity distribution. It has been found to account for the Hercules stream (Quillen, 2003; Fux, 2001; Dehnen, 2000), the vertex deviation (Mühlbauer and Dehnen, 2003), errors in the Oort constants (Minchev et al., 2007), and (in combination with spiral structure) the observed flatness in the age-metallicity relation (Minchev and Famaey, 2009). The bar angular velocity, or pattern speed, , has been well established to be such that the solar circle lies just outside the bar’s 2:1 outer Lindblad resonance (OLR). Dehnen (2000) found that in order to reproduce the Hercules stream, the bar pattern speed should be , where is the angular velocity of the local standard of rest (LSR), and the bar orientation with respect to the Sun-Galactocentric line is in the range . By accounting for trends seen on the Oort constant C, Minchev et al. (2007) found and . Such bar orientation is consistent with estimates derived from IR photometry () and OGLE-II microlensing observations of red clump giants in the Galactic bulge (, Rattenbury et al. 2007).
Recent analysis of the local velocity field show that the origin of the most prominent low-velocity moving groups in the solar neighborhood favor a dynamical origin (Famaey et al., 2008). While the bar has been shown to affect the u-v plane at higher velocities, spiral density waves have been found to create resonant structure in the lower velocity regions, such as the splitting of the Pleiades/Hyades and Coma Berenices moving groups (Quillen and Minchev, 2005). Is it really true that the bar is not effective at low velocities? Fux (2001) investigated the effect of the bar on the local velocity distribution, similarly to the work by Dehnen (2000), but for test particles integrated forward in time. The author reports time varying structure in the u-v plane following the growth of the bar. However, he did not investigate this further, being more interested in the effect of the bar once the disc has fully responded to the perturbation. To increase the particle statistics and reduce phase mixing, the u-v distributions presented in the work by Fux (2001) were averaged over 10 bar rotations and then smoothed.
However, it is possible that the effect of the initial response of the disc to the formation of a central bar can still be seen today in the solar neighborhood velocity distribution, provided the bar has formed or evolved recently. There are both observational and theoretical arguments suggesting such a scenario. By using data from the Two Micron All-Sky Survey (2MASS), Cole and Weinberg (2002) estimated that the Milky Way bar is likely to have formed more recently than 3 Gyr ago and suggested that this event could have been triggered by a now-merged satellite. Minchev et al. (2009) showed that phase wrapping in the thick disc caused by initial conditions which might have been left following a merger, can explain four observed high velocity streams. To match the locations of these streams, a strong perturbation of the MW disc is required about 2 Gyr ago. Such an event could have triggered the formation of the MW bar. In addition, cosmological simulations show that massive minor mergers are likely to have happened during the lifetime of Milky Way size system. For example, Kazantzidis et al. (2008) estimated that as many as five objects more massive than 20% could have been accreted since . All this evidence from observations and simulations calls for a detailed investigation of the effect of a young, or a recently evolved bar, on the solar neighborhood velocity distribution.
In this paper we examine the effect of a central bar on the local velocity distribution by simulating the time evolution of a barred stellar disc. Unlike in previous works, here we do not time average over particles positions, in order to investigate in detail the response of the disc. We explore the possibility that stellar streams in the u-v plane could be induced by a recent bar formation or evolution.
2. Simulation set up
We perform test-particle simulations of a stellar galactic disc with parameters consistent with Milky Way kinematics. The density distribution is exponential, , with a scale length , consistent with the 2MASS photometry (Ojha, 2001). We give particles an initial radial velocity dispersion in the form of a Gaussian distribution. The Milky Way disc is known to have a radial velocity dispersion which decreases roughly exponentially outwards: . In accordance with this we implement an exponential decrease in the standard deviation of the radial velocity dispersion of stars with radius, with a scale length (Lewis and Freeman, 1989). Since we are interested in the low-velocity regions of the u-v plane, we set km/s at .
To explore the time development of the system, we do not time-average over position and velocity vectors, as it is frequently done in test-particle simulations (e.g., Fux 2001; Minchev et al. 2007) where no dynamical development of the system is expected. For each simulation we integrate N= particles for 30 rotation at the solar radius, .
The background axisymmetric potential due to the disc and halo has the form , corresponding to a flat rotation curve. We model the nonaxisymmetric potential perturbation due to the Galactic bar as a pure quadrupole
| (1) |
Here is the bar’s gravitational potential amplitude, identical to the same name parameter used by Dehnen (2000); the strength is specified by from the same paper. The bar length is with the bar corotation radius. The pattern speed, is kept constant. The bar amplitude is initially zero, grows linearly with time at and transitions smoothly to a constant value after bar rotations. This insures a smooth transition from the axisymmetric to the perturbed state.
In our units the solar neighborhood (SN) radius is ; the circular speed is everywhere since the rotational curve is flat. To convert to real units we use Local Standard of Rest (LSR) tangential velocity of 240 km/s, and Galactocentric distance of 8 kpc. The 2:1 OLR with the bar is achieved when , where is the epicyclic frequency. For a flat rotation curve .
3. Results
For an axisymmetric disc the potential is independent of time, thus energy and angular momentum are conserved. In the case of a single periodic perturbation, which is stationary with time, there is still a conserved quantity in the reference frame rotating with the pattern. This is the Jacobi’s integral, , where is the energy of the particle, is its angular momentum, and is the pattern angular velocity. In such a system no time variations are expected in phase space. For example, Minchev and Quillen (2006) showed that no increase in velocity dispersion with time (disc heating) occurs once the pattern has been fully grown. Consequently, in previous such studies a time-averaging procedure of the particle positions has been employed in order to achieve better statistics and minimize computational time (Fux, 2001; Minchev and Quillen, 2007, 2008). Unlike in those works, here we look at the time evolution of the system by integrating a large number of particles and follow their evolution in phase space.
3.1. Time evolution of the plane
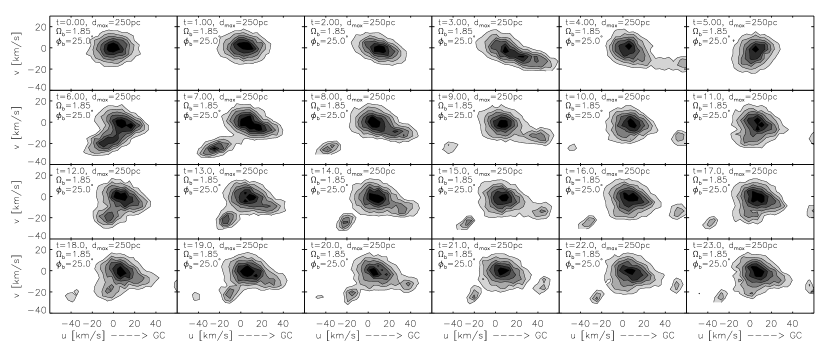
Figure 1 shows the time development of the plane for a simulation of a stellar disc with Milky Way kinematics perturbed by a steady state bar. The pattern speed is , the maximum sample depth is pc, and the bar orientation is (geometry as shown in figure 2). Shaded contours show the particle number density . Each panel is a snapshot of a particular time of the same simulation, in increments of rotation at , up to .
The bar is fully grown in four bar rotations, which corresponds to in the figure. Note that even though the perturbation is stationary, structure varies with time. At the distribution becomes bimodal, forming a strong feature at . During the next five rotations this clump moves toward more negative radial velocities, becomes weaker and eventually disappears at about . This process is repeated approximately every 6.5 rotations, starting at times and . In addition, there is a second feature forming at , which evolves with time to more positive radial velocity , and approximately constant km/s. This clump recurs on a slightly shorter timescale ( 5.5) than the one described above, as apparent from the two slopes formed by aligning the clumps at and , for example in the fifth column in figure 1. One should also note that the strength of the features diminishes at every period.
Note that the structure in velocity space seen in figure 1 is not due to our ICs as we initially integrate particles in the axisymmetric potential for 3 Gyr to insure the disc is relaxed before the bar is grown. The reason for this transient nature of velocity streams in the u-v plane is an effect caused by the initial response of the disc to the recent formation of the bar. To show this we next look at the time evolution of orbits near the 2:1 OLR.
3.2. Orbits near the 2:1 OLR of the bar
Linear theory predicts that the orientation of orbits shifts across the 2:1 OLR of the bar, from perpendicular to the bar major axis inside the OLR, to parallel with it outside the resonance (Binney and Tremaine, 2008). These are referred to as the and orbits, respectively (see, e.g., Quillen 2003; Fux 2001; Dehnen 2000). Near the peak of the resonance, both types of orbits can exist (Contopoulos, 1975; Weinberg, 1994). As suggested by Kalnajs (1991), for a SN location near the OLR and a bar angle in the range , the closed orbits from either side of the OLR would produce two streams; one moving inward () and the other outward (), which could be associated with he Hyades and Sirius stellar streams seen in the Hipparcos stellar velocity distribution. Is it possible that the two streams we observed in figure 1 above are somehow linked to these orbital families? To try to answer this question, let us look at how orbits evolve with time.
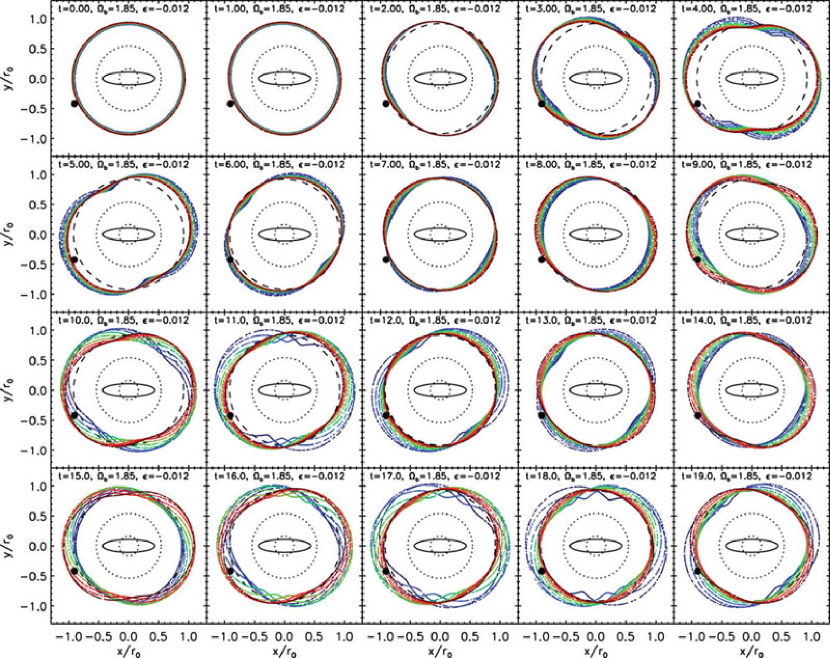
In figure 2 we show the time development of nine initially circular rings near the bar 2:1 OLR, in the bar reference frame. For each ring particles start at the same initial galactic radius and with a random distributed in azimuth. All simulation parameters are the same as in figure 1. Rotation is clockwise, thus in the reference frame of the bar particles move in the counterclockwise direction. The bar is represented by the ellipse in the center of each panel. The location of the 2:1 ILR and the CR are shown as dotted circles and the 2:1 OLR location is indicated by the dashed circle. The solar neighborhood is shown by a black dot, just outside the 2:1 OLR, for a bar angle of (as in figure 1). The initial radii are such that four rings lie just inside the OLR (blue end) and four are just outside the resonance (red end). One ring is situated right on the resonance (green).
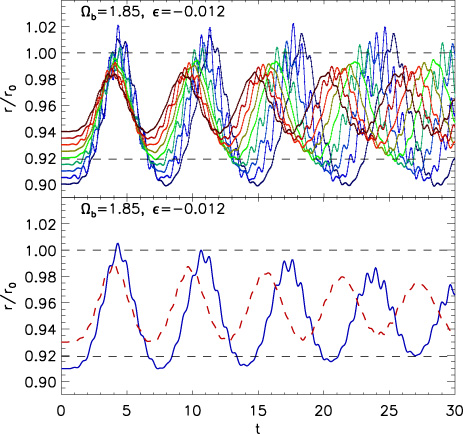
As the system develops with time, the inner and outer groups of rings tend to stay individually aligned and precess at different rates. Since these also exhibit radial oscillations, in order to see the timescale better we plotted the average radius of each ring as a function of time in figure 3, top panel. What we would actually see near the Sun is the average contribution from these orbits. Expecting that the ones just inside the OLR behave differently than those just outside the resonance, we want to know what is the frequency of oscillation for each group. By considering annuli of finite width (bottom panel of figure 3), we can now see that the timescales of precession inside and outside the OLR are about 5.5 and 6.5, respectively. These are consistent with the recurrence times of the velocity streams in figure 1. Thus, we can associate the stream at with a quasi-periodic family of orbits librating around the closed orbit. Similarly, the stream at originates from an orbital family librating around the close orbit.
The amplitudes of oscillation inside and outside the OLR seen in the bottom panel of figure 3 decay with time; in other words, the disc relaxes. This is consistent with the decrease in the fraction of particles in the streams in figure 1, as each cycle is repeated (see, e.g., and 20). However, stellar streams in the u-v plane remain quite strong until the end of the simulation at LSR rotations. This shows that the disc relaxation time is much longer than the age of the Galaxy. We also expect to see the effect of phase wrapping. For example, at times in figure 1 two steams are apparent at where the same orbital family is seen at the end and beginning of its precession around the orbit. However, in general it appears that phase wrapping effects are not important, unlike in Minchev et al. (2009).

3.3. Variation with bar pattern speed and orientation
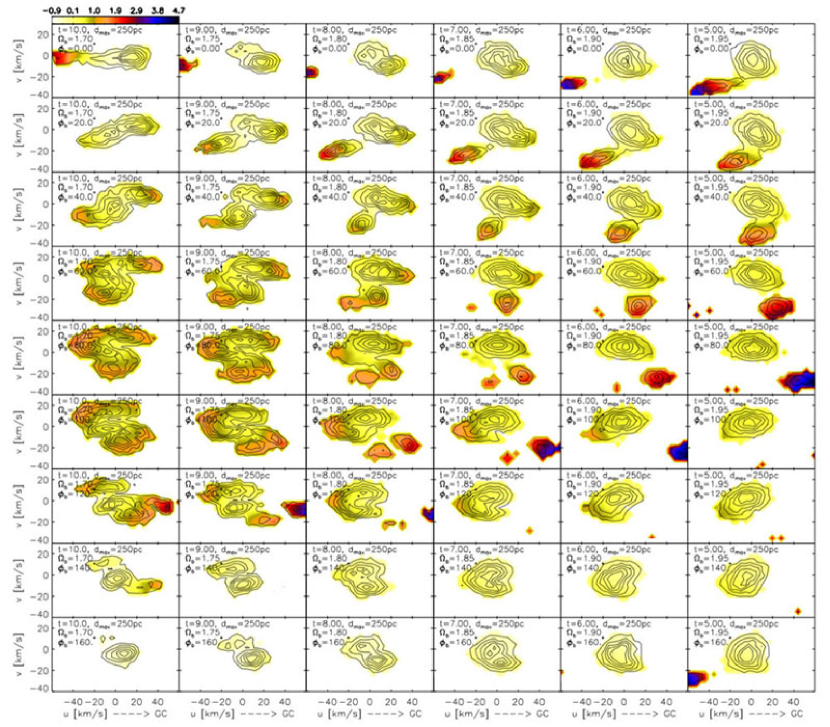
Figure 4 shows simulated SN velocity distributions similar to those shown in figure 1. Here however, while the contours still show the particle number density, the color levels show the change in angular momentum , where and are the current and initial angular momenta. The color levels are normalized for all panels, allowing one to see the relative change in angular momentum for the full range of parameters shown. The color bar values can be converted to (pc km/s) by multiplying by . From top to bottom changes from 0 to in increments of . Different columns show different pattern speeds ranging from (form left to right). The solar radius is at the bar’s OLR in the leftmost column. Particles are confined to a region of 250 pc from the Sun.
It is important to realize that for slower bars (SN closer to the resonance) structure develops later than for faster ones (see figure 5). Consequently, snapshots of the u-v plane at the same time since bar formation and different angular velocities will show different stages of the precession cycle. To approximately account for this, in figure 4 we show snapshots at earlier times as the pattern speed increases. For example, when we show a plot at , while for .
Note the strong variation with both pattern speed and orientation. We first look at the variation with angle for the same simulation as in figure 1, shown in the forth column of figure 4. The clump at which we associated with the orbital family just inside the OLR (see section 3.2), remains at a constant tangential velocity as changes, but shifts in the positive direction. It is intriguing that at angles this stream moves in the positive radial velocities region. At the same time the stream associated with the closed orbit shifts to negative . A similar behavior is observed for all other pattern speeds as well. This is easy to understand in view of the precession (in the reference frame of the bar) and pulsation of the orbital families just inside and just outside the OLR (see figure 2). By changing the SN angle, the two families of orbits reach the solar vicinity at different orientations, which results in sampling different subsets of the orbits in the u-v plane.
Examining a particular row in figure 4, we see that as increases the streams shift to more negative angular velocities. This is expected if the stars in the streams come from near the OLR radius, since the distance from the solar circle to the OLR circle increases with an increase in . We can see this also in the change in angular momentum shown by the color levels in figure 4. The largest occurs for , meaning that the guiding radius for these stars is smallest. Note that since the expected bar angle is in the range , possible matches to the observed velocity field will always have for the family and for the one.
As apparent form examining the fifth row in figure 4 we see that beyond phase wrapping is more efficient near the resonance and becomes unimportant away from it.
3.4. Variation with bar growth time
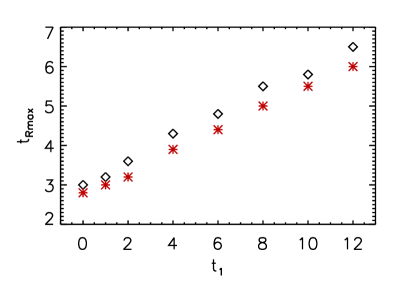
In this paper in all figures we grow the bar in four bar rotation. In order to see how our results would change with a change in the bar growth time , we ran simulations with different values in the range in units of bar rotation. We plot the results in figure 5. The y-axis shows , the time for which the functions in figure 3 peak for the first time. The x-axis shows the bar growth time used for that particular simulation. Red and blue symbols correspond to the orbital families just outside and just inside the bar’s OLR. The dependence is almost linear with . The relative phases of the functions in figure 3 remain the same for all values of , as do all our other results. We conclude that while this delay in structure formation as increases would introduce uncertainty in our prediction for the bar formation/evolution time, the general effect of bar growth time in unimportant.
3.5. Variation with bar strength
Our default value for the amplitude of the bar perturbation is . We would like to know how changing this will affect our results. We first derive an analytical expression for the orbital libration timescale , as a function of bar strength . Next we compare that to our results from simulations.
Contopoulos (1975, 1988) showed that the dynamics of stars confined to the Galactic plane in the case of an axisymmetric potential can be described by a Hamiltonian written in a third order post-epicyclic approximation. Taking it further, Quillen (2003) considered the dynamics of stars that are affected by perturbations from both spiral structure and the Milky Way bar. She constructed a simple one dimensional Hamiltonian model for the strongest resonances in the epicyclic action angle variables. We can use her equation 22 to describe the effect of the bar only, by neglecting the term related to spiral structure (last term on the right hand side). In a slightly different notation we can write
| (2) |
where is the action variable related to eccentricity and is the resonant angle. The coefficient (eq. 18 in Quillen 2003) is constant at the solar radius and sets the distance from resonance. For a flat rotation curve and is related to the bar amplitude through (eq. 7 in Dehnen 2000), where is the radius at which the bar ends (for ). By dimensional analysis from and we can derive a timescale for the resonance:
| (3) |
where we have divided by to put the expression in units of LSR rotations. This is the libration time around the fixed points associated with the and orbits. Note that the functional dependence of libration time on bar strength is
| (4) |
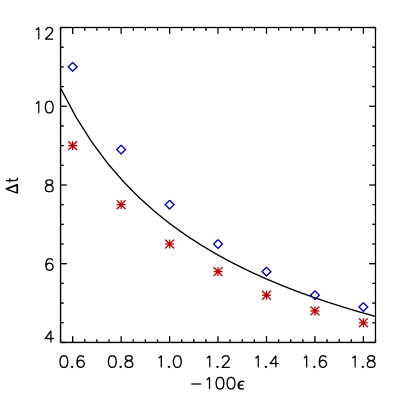
To compare to this analytical result we performed simulations with different perturbation strengths, in addition to the default value of . In figure 6 the open blue squares and the red star symbols show the precession time for the streams just inside and just outside the OLR for a bar pattern speed as in figures 1- 3 and different bar perturbation amplitude in the range . The solid line plots equation 3 scaled by a factor of 0.38 (estimates by Quillen 2003 are accurate to within an order of magnitude). We see excellent agreement in the functional behavior between our numerical and analytical results. Simulations with stronger bars result in shorter libration time. Features in the u-v plane remained of similar strength to those seen in figure 1.
4. Constraining the bar
As we showed in section 3.2, for a pattern speed consistent with expectation for the MW bar, we can associate two streams in velocity space with the quasi-periodic families of orbits librating around the and closed orbits. In section 3.3 we explored the variation of structure in the u-v plane with angular velocity and bar angle for a particular time. Now we would like to see how we can use this information to put constraints on bar parameters, such as pattern speed, orientation and formation time.
For a given time, the tangential velocity of resonant features in the u-v plane is set by the bar pattern speed as evident from figure 4. On the other hand, the radial velocity , is set by the bar’s orientation. Thus, assuming some features at low velocities in the Hipparcos velocity distribution are of resonant origin, we can match stream positions in the u-v plane and estimate and . In addition, structure varies with time due to the libration of the quasi-periodic orbits around the fixed points; this allows us to constrain the bar formation time. We need to compare our synthetic velocity distributions to the Hipparcos u-v plane corrected for the motion of the Sun. As recently discussed by McMillan and Binney (2010), the velocity of the Sun with respect to the LSR, velocity of the LSR and the Sun’s Galactocentric radius may be quite different than the currently accepted values. However, the LSR angular rotation rate is found to be well constrained in the range 29.9-31.6 km/s/kpc. sets the relative position of streams in the u-v plane. Therefore, as we consider possible matches to the observed velocity distribution we need to be most concerned with the relative orientation of streams. In this paper we use the values km/s and kpc resulting in km/s/kpc.
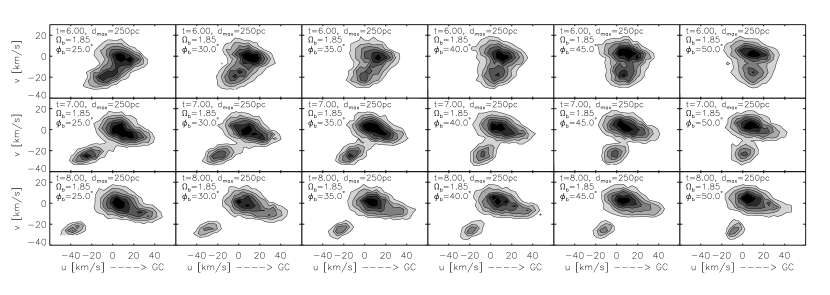
In figure 7 we show how structure in the u-v plane changes with bar angle and time, for the simulation in figure 1 (). While the pattern speed is kept fixed everywhere, different columns show variation with angle in the range in increments of . Rows show changes with time in units of rotations at for and 8. The clump at negative can be associated with the Pleiades moving group, while the one at at the beginning of its formation is consistent with the Coma Berenices stream.For this pattern speed, good matches are achieved for and . Since structure in the u-v plane is recurrent about every six LSR rotations (see figure 1), one would expect later times to be equally consistent. However, we require a sufficiently strong signal in order to account for the fraction of stars in the Pleiades, thus we reject later times.
In figure 8 we compare the observed velocity distribution to our simulations. We used the catalog from Holmberg et al. (2009) to plot the u-v distribution of Hipparcos stars in the top left panel of figure 8. To subtract the Solar motion we used the values by Dehnen and Binney (1998). In the top right panel we show a simulation with parameters as indicated in the figure. Note that here we start with a radial velocity dispersion km/s in order to populate the Hercules stream at km/s. The two clumps in the top right panel are consistent with the Pleiades and Sirius groups. For a change in bar orientation and half a rotation at we can associate these groups of stars with the Pleiades and Coma Berenices streams (bottom right). Finally, the bottom left panel in figure 8 shows the orbital families giving rise to the streams in the u-v plane.
Similar inspection of the u-v plane for pattern speeds in the range reveal that, depending on the bar parameters and time since bar formation, we can obtain a match to either the Coma Berenices or Sirius moving groups in addition to the Pleiades stream. We conclude to be consistent with structure in the observed u-v velocity distribution our model requires the bar angle to be in the range and its pattern speed to be . This is in very good agreement with previous estimates of these bar parameters. For example, by a quantitative comparison of the observed with the simulated position of the Hercules stream, Dehnen (2000) deduced the MW bar pattern speed to be and the bar angle . By relating the dynamical effect of the bar to the derivatives of the velocities via the Oort constant C, an additional constraint on bar parameters was provided by Minchev et al. (2007), where they estimated and . Our result is also in agreement with the estimate by Debattista et al. (2002), based on OH/IR star kinematics.
To account for the strength of the Pleiades, we find that the bar formation time has to be between 7 and 9 rotations at , which corresponds to 1.75-2.25 Gyr.
4.1. Relating to other work
Previous works have also reported features (or not reported but are identifiable in their figures) in their barred disc simulations, which we can now explain as the initial response of the disc to bar formation.
One example is the work by Bagley et al. (2009) who investigated the effect of a central bar on disc morphology. In their figure 3 they present number density plots of the time evolution of a barred galactic disc, similar to our figure 2, but showing the extent of the full disc. In addition to the asymmetries in the ring (associated with the orbit) reported by the authors, it is easy to identify also a second ring at smaller radius and different orientation relative to the outer one ( orbit). Even at the last three time outputs (figure ends at in our units) where the outer ring appears stable, close inspection of the region between the two rings reveals misaligned features similar to those seen in our figure 2.
A second example is the work by Fux (2001), where the author investigated the effect of the bar on the u-v plane. The second row of his figure 12 presents simulated local velocity distributions for a ratio of solar to OLR radius (or equivalently, ) and different bar angles. Due to the time-averaging procedure (from 13 to 19 rotations in our units) used by Fux we can compare a particular u-v plot from his figure to the time average of all panels in our figure 1. For an angle of (second row, second column in figure 12 of Fux 2001), we can see two features stretching from the central clump to radial velocities of km/s. Just as expected from our results, the feature at positive (corresponding to negative in our plots) reaches more negative tangential velocities than the one moving away from the galactic center. Similar structure is apparent for other pattern speeds and angles as well. In contrast, in figure 13 of the same paper, where the velocity distributions are time averaged between 55 and 65 bar rotations, the features we described above are almost not apparent, as the disc is more relaxed at later times.
A third example can be found in Antoja et al. (2009), who examined the effect of the Galactic bar and spiral structure. Similarly to the present study, they did not time-average over particle orbits. Although no time development of the u-v plane was presented, it is easy to identify some structure at low velocities in their Fig. 1(f). Note also that their discs were unrelaxed, similar to those of Minchev et al. (2009), which is probably the reason for the extended feature (in the u direction) at km/s.
5. Discussion and conclusions
In this paper we have examined the effect of a central bar on the structure in the stellar velocity distribution in the solar neighborhood. Unlike in previous works, here we do not time average over particle positions but follow the time evolution of the system. We find that in addition to the central clump in the u-v plane, two strong features appear after the formation of the bar, which shift with time toward more positive and more negative radial velocities (see figure 1). This is surprising since a system subjected to a steady state periodic perturbation must not evolve with time due to the presence of an isolating integral of motion (the Jacobi’s integral). We explain these results as the initial response of the disc following the bar formation. We associate the streams in the u-v plane with two quasi-periodic orbital families precessing around the and closed orbits near the 2:1 OLR of the bar. The timescale of this libration is dependent on the bar’s strength as , consistent with a simple Hamiltonian model for the resonance (eq. 3). We find that phase wrapping timescales are longer than libration timescales thus the disc takes a long time to relax near the 2:1 OLR of the bar.
We have shown for the first time that the Milky Way bar could be responsible for low-velocity structure in the solar neighborhood velocity field. The stream caused by the orbital family just inside the OLR of the bar (figure 8) can be associated with the Pleiades moving group seen in the Hipparcos velocity distribution. Similarly, the orbital family just outside the OLR can account for either the Coma Berenices or the Sirius velocity stream, depending on the bar parameters and time since its formation. We note that the position of the Hercules stream (figure 8) does not change with time as in the case of the lower velocity streams. This model requires a bar pattern speed of and a bar orientation . Since the process is recurrent, we achieve a good match to the velocity distribution about every six rotations of the LSR. However, in order to be consistent with the fraction of stars in the Pleiades velocity stream, we favor a bar formation time 1.75-2.25 Gyr ago. This is consistent with the observational results by Cole and Weinberg (2002), who estimated that the Milky Way bar is likely to have formed more recently than 3 Gyr ago. In addition, the recent work by Minchev et al. (2009) in which the authors considered the effect of a Milky Way merger on the kinematics of stars in the SN, estimated that the Galactic disc was strongly perturbed about 2 Gyr ago. Such a merger could have triggered bar formation.
With the upcoming data from the Gaia mission,it will become possible to see how the positions of the streams we here attribute to the effect of the Milky Way bar, change with Galactic azimuth and Galactocentric distance, and thus test our model. Furthermore, it might be possible to identify the and orbital families in pencil-beam surveys such as ARGOS, BRAVA, and APOGEE by observing, for example, in the low absorption window at a Galactic longitude of (Carraro and Costa, 2009), and identifying structure in the way suggested by Minchev and Quillen (2008).
This work confirms that resonant features in velocity space can provide tight constraints on nonaxisymmetric disc structure parameters, as shown by Quillen and Minchev (2005) for the case of spiral density waves. We expect that spiral structure can also cause precession of resonant orbital families in the reference frame of the perturber as seen here, and thus provide an insight on spiral structure formation. Preliminary results from spiral density wave simulations show that this is indeed true (Minchev et al. 2010 , In preparation). However, due to the more narrow resonant widths compared to the case of the bar, this effect might not be as important unless the solar radius is almost at the exact resonance with spirals.
Decreasing the pattern speed moves the bar’s resonances outwards, causing orbits to be captured into resonance (e.g. Romero-Gómez et al. 2006; Bagley et al. 2009). Therefore, it is likely that the features in the u-v plane will remain strong for longer periods of time than what is inferred from figure 1. Consequently, the model presented here might also be consistent with an old bar, provided the bar pattern speed is changing. Further investigation exploring this problem is necessary. An additional perturbation from the Milky Way spiral structure will change the dynamics as well (Quillen and Minchev, 2005; De Simone et al., 2004; Antoja et al., 2009). Models incorporating both spiral and bar structure, as the one considered by Chakrabarty (2007) but without suppressing the effects of the initial disc response, are needed as well. We have recently shown that such a configuration provides a very powerful stellar radial migration mechanism (Minchev and Famaey, 2009), however, the effect on the u-v plane is yet to be explored. We note that the parameter space in the case of two perturbations becomes enormous, considering the timescales of each perturbing agent associated with the initial response of the disc, in addition to the relative orientation and individual time evolution of spirals and bar. Thus a thorough investigation of the effect of spiral structure (including transient spirals) and transient bars is required before a superposition of these is considered. Even more complications to the disc dynamics will be added if the effect of an orbiting satellite is considered (Quillen et al., 2009).
The model in this paper argues against a common dynamical origin for the Hyades and Pleiades moving groups, in agreement with the results of analysis of the Hipparcos catalogue (Famaey et al., 2008; Bovy and Hogg, 2009). This raises the question of whether it is the MW spiral structure responsible for the Hyades as expected from the work by Quillen and Minchev (2005). A work investigating this problem is underway (Minchev et al. 2010, In preparation).
References
- Antoja et al. (2009) Antoja, T., Valenzuela, O., Pichardo, B., Moreno, E., Figueras, F., and Fernández, D.: 2009, ApJ 700, L78
- Bagley et al. (2009) Bagley, M., Minchev, I., and Quillen, A. C.: 2009, MNRAS 395, 537
- Binney and Tremaine (2008) Binney, J. and Tremaine, S.: 2008, Galactic Dynamics: Second Edition, Princeton University Press
- Blitz and Spergel (1991) Blitz, L. and Spergel, D. N.: 1991, ApJ 379, 631
- Bovy and Hogg (2009) Bovy, J. and Hogg, D. W.: 2009, ArXiv e-prints
- Carraro and Costa (2009) Carraro, G. and Costa, E.: 2009, A&A 493, 71
- Chakrabarty (2007) Chakrabarty, D.: 2007, A&A 467, 145
- Cole and Weinberg (2002) Cole, A. A. and Weinberg, M. D.: 2002, ApJ 574, L43
- Contopoulos (1975) Contopoulos, G.: 1975, ApJ 201, 566
- Contopoulos (1988) Contopoulos, G.: 1988, A&A 201, 44
- De Simone et al. (2004) De Simone, R., Wu, X., and Tremaine, S.: 2004, MNRAS 350, 627
- Debattista et al. (2002) Debattista, V. P., Gerhard, O., and Sevenster, M. N.: 2002, MNRAS 334, 355
- Dehnen (2000) Dehnen, W.: 2000, AJ 119, 800
- Dehnen and Binney (1998) Dehnen, W. and Binney, J. J.: 1998, MNRAS 298, 387
- Famaey et al. (2008) Famaey, B., Siebert, A., and Jorissen, A.: 2008, A&A 483, 453
- Fux (2001) Fux, R.: 2001, A&A 373, 511
- Holmberg et al. (2009) Holmberg, J., Nordström, B., and Andersen, J.: 2009, A&A 501, 941
- Kalnajs (1991) Kalnajs, A. J.: 1991, in B. Sundelius (ed.), Dynamics of Disc Galaxies, pp 323–+
- Kazantzidis et al. (2008) Kazantzidis, S., Bullock, J. S., Zentner, A. R., Kravtsov, A. V., and Moustakas, L. A.: 2008, ApJ 688, 254
- Lewis and Freeman (1989) Lewis, J. R. and Freeman, K. C.: 1989, AJ 97, 139
- McMillan and Binney (2010) McMillan, P. J. and Binney, J. J.: 2010, MNRAS 402, 934
- Minchev and Famaey (2009) Minchev, I. and Famaey, B.: 2009, arXiv:0911.1794v1
- Minchev et al. (2007) Minchev, I., Nordhaus, J., and Quillen, A. C.: 2007, ApJ 664, L31
- Minchev and Quillen (2006) Minchev, I. and Quillen, A. C.: 2006, MNRAS 368, 623
- Minchev and Quillen (2007) Minchev, I. and Quillen, A. C.: 2007, MNRAS 377, 1163
- Minchev and Quillen (2008) Minchev, I. and Quillen, A. C.: 2008, MNRAS 386, 1579
- Minchev et al. (2009) Minchev, I., Quillen, A. C., Williams, M., Freeman, K. C., Nordhaus, J., Siebert, A., and Bienaymé, O.: 2009, MNRAS 396, L56
- Mühlbauer and Dehnen (2003) Mühlbauer, G. and Dehnen, W.: 2003, A&A 401, 975
- Ojha (2001) Ojha, D. K.: 2001, MNRAS 322, 426
- Quillen (2003) Quillen, A. C.: 2003, AJ 125, 785
- Quillen and Minchev (2005) Quillen, A. C. and Minchev, I.: 2005, AJ 130, 576
- Quillen et al. (2009) Quillen, A. C., Minchev, I., Bland-Hawthorn, J., and Haywood, M.: 2009, MNRAS 397, 1599
- Rattenbury et al. (2007) Rattenbury, N. J., Mao, S., Sumi, T., and Smith, M. C.: 2007, MNRAS 378, 1064
- Romero-Gómez et al. (2006) Romero-Gómez, M., Masdemont, J. J., Athanassoula, E., and García-Gómez, C.: 2006, A&A 453, 39
- Weinberg (1992) Weinberg, M. D.: 1992, ApJ 384, 81
- Weinberg (1994) Weinberg, M. D.: 1994, ApJ 420, 597