SWIFT monitoring of Cygnus X-2: investigating the NUV-X-ray connection
Abstract
The neutron star X-ray binary (NSXRB) Cyg X-2 was observed by the Swift satellite 51 times over a 4 month period in 2008 with the XRT, UVOT, and BAT instruments. During this campaign, we observed Cyg X-2 in all three branches of the Z track (horizontal, normal, and flaring branches). We find that the NUV emission is uncorrelated with the soft X-ray flux detected with the XRT, and is anticorrelated with the BAT X-ray flux and the hard X-ray color. The observed anticorrelation is inconsistent with simple models of reprocessing as the source of the NUV emission. The anticorrelation may be a consequence of the high inclination angle of Cyg X-2, where NUV emission is preferentially scattered by a corona that expands as the disk is radiatively heated. Alternatively, if the accretion disk thickens as Cyg X-2 goes down the normal branch toward the flaring branch, this may be able to explain the observed anticorrelation. In these models the NUV emission may not be a good proxy for in the system. We also discuss the implications of using Swift/XRT to perform spectral modeling of the continuum emission of NSXRBs.
Subject headings:
stars: neutron — X-rays: binaries — X-rays: individual: Cygnus X21. Introduction
The nature of near-ultraviolet (NUV) emission from neutron star low-mass X-ray binaries (LMXBs) is not well understood. The NUV emission provides essential information in the broadband spectral energy distribution (SED) of the LMXB. The NUV emission may be direct flux from the accretion disk; it may be hard X-ray emission reprocessed by the accretion disk; or it may be dominated by jet emission. Russell et al. (2006) have analyzed an ensemble of black hole LMXBs (BHXRBs) and neutron star LMXBs (NSXRBs) to determine whether the NIR/optical emission is more consistent with synchrotron (jet) emission or reprocessed X-ray emission. They point out that if the optical/NIR (and by extension the NUV) spectrum is jet dominated, then it should be flat from the radio regime through the optical, and . One can also make predictions for whether the NUV light is consistent with X-ray emission reprocessed by the outer accretion disk. van Paradijs & McClintock (1994) show that under simple geometric assumptions, reprocessed emission should be proportional to , where is the orbital separation of the system. Finally, if the NUV emission is direct emission from the accretion disk, we might naively expect the to track directly. In a study of an ensemble of 13 NSXRBs observed over many orders of magnitude of X-ray luminosity, Russell et al. (2006) have shown that the optical/NIR emission is more consistent with the prediction of reprocessed X-ray emission. Moreover, Hynes et al. (2006) have seen evidence for reprocessed emission in Type-I X-ray bursts from the neutron star LMXB EXO 0748676.
The Swift Gamma-Ray Burst Explorer (Gehrels et al., 2004) is dedicated to the discovery and follow-up of gamma-ray bursts. It also is able to perform new multi-wavelength studies of variable X-ray objects, revealing the nature of accretion disks around compact objects. On board Swift is the X-ray Telescope (XRT, Burrows et al., 2005), an imaging CCD spectrometer with energy coverage from 0.3-10 keV. In addition, the Swift UV/optical telescope (UVOT, Roming et al., 2005) can monitor the NUV emission in NSXRBs, and the Swift Burst Alert Telescope (BAT, Barthelmy et al., 2005) can trace hard X-ray emission (14-300 keV) for bright sources.
Using 21 short Swift monitoring observations of the black hole LMXB XTE J1817330, Rykoff et al. (2007) were able to show that the NUV flux tracks closely with the 2-10 keV X-ray emission, with a best-fit slope of . As the 2-10 keV X-ray emission is an effective proxy for the hard X-ray emission detected by the BAT (see Section 4), this is consistent with the hypothesis that the NUV emission is reprocessed hard X-ray emission. This was the first time that the NUV emission was definitively shown to be reprocessed hard X-ray emission for a single black hole LMXB source over a wide range of X-ray and NUV luminosities. This is consistent with the observations of an ensemble of black hole LMXBs in Russell et al. (2006). Thus, while it appears that reprocessing is important for black hole LMXBs, the origin of the NUV emission in neutron star LMXBs is still uncertain.
In order to investigate both the origin and evolution of UV and X-ray emission in NSXRBs we have monitored the Z source Cyg X-2 approximately 50 times over a 4-month period using short 1 ksec observations with Swift. Cyg X-2 is a well known NSXRB, and has been used to define one of the types of Z track observed (the so-called Cyg-like Z tracks). It is well-suited to UV and X-ray observations due to the low Galactic absorption in its direction ( cm-2), thus it has been the subject of several previous joint UV/X-ray monitoring campaigns (Vrtilek et al., 1990; Hasinger et al., 1990; Vrtilek et al., 2003).
During June and October 1988, Vrtilek et al. (1990) monitored Cyg X-2 with the International Ultraviolet Explorer (IUE). For seven of these IUE observations, they also had simultaneous X-ray observations using Ginga. Over these 7 observations, Cyg X-2 was seen in all three branches of the Z track: horizontal branch (HB), normal branch (NB) and flaring branch (FB). From these observations Vrtilek et al. (1990) conclude that both the NUV continuum and line emission increase monotonically along the Z track, with the least emission in the HB, and the most in the FB. They model the NUV emission as a combination of reprocessed X-rays from the disk, along with a small (at most 20%) contribution from the X-ray heated surface of the companion star. In addition, they find no direct correlation between the NUV (continuum or line) flux and X-ray (1-14 keV) flux from the observations. Hasinger et al. (1990) also discuss this joint X-ray/NUV monitoring campaign of Cyg X-2. As the shape of the X-ray spectrum changes over the Z track, they argue that the accretion disk is a superior bolometer than our X-ray detectors because it is insensitive to bandpass effects. Assuming the NUV emission is dominated by reprocessed hard X-ray emission, and thus the NUV emission tracks the total X-ray emission, Hasinger et al. (1990) argue the NUV emission tracks the mass accretion rate, . Combined with the hint that the UV continuum increases along the Z track, they conclude that the mass accretion rate increases along the Z track from HB-NB-FB. Note, however, that Church et al. (2006) suggest that the UV increase from HB-NB-FB is not conclusive and does not imply an increase of mass accretion rate.
Even after many decades of observations of the X-ray spectra of NSXRBs, there is still not a clear consensus as to the spectral model to use, as a wide variety of different spectral models often fit equally well (e.g. Barret, 2001). This has led to two classes of models being developed to fit the spectra during the soft state: the Eastern model (Mitsuda et al., 1989) comprised of a disk blackbody and a weakly Comptonized blackbody; and the Western model (White et al., 1988) comprised of a single-temperature blackbody from the boundary layer and Comptonized emission from the disk. In contrast, the hard state is dominated by a hard component, with the addition of a soft component which can either be a blackbody or a disk blackbody (e.g. Barret et al., 2000). Given the spectral ambiguities, color-color diagrams have been most frequently used to describe the behavior of NSXRBs. In fact, these sources are classed as either atoll or Z sources depending on the shape they trace out on the color-color diagrams (Hasinger & van der Klis, 1989).
Nevertheless, a recent study by Lin et al. (2007) using RXTE spectra of the transient sources Aql X1 and 4U 160852 has provided progress on the ‘correct’ choice of spectral model. These authors test all the commonly used models and find that during the soft state the only model where the measured temperature follows the luminosity as is the one comprised of two thermal components, a disk blackbody and a single-temperature blackbody, in addition to a broken power-law. In this case, both the thermal components follow . This provides compelling physical motivation to use such a model, which can be interpreted as emission from the accretion disk and from a small boundary layer. However, the bandpass of RXTE/PCA is restricted to above 3 keV, while the temperature of these components lies below 3 keV. This can lead to inaccuracies in modeling, and these findings should be confirmed by an instrument such as XRT with lower energy coverage.
How these sources progress around their tracks on the color-color diagram, and what drives the changes, is still a matter of debate. Recently, the transient source XTE J1701462 has shown some unique properties which have important ramifications. It displayed both Z and atoll tracks, with the Z tracks (both Cyg-like and Sco-like) occurring when the source was at its highest luminosity and evolving into an atoll track as it decreased in luminosity (Lin et al., 2009; Homan et al., 2010). While it has long been known that Z sources are more luminous than the atoll sources, this is the first time a single source has been seen to evolve from a Z to an atoll, indicating that mass accretion rate must drive the overall shape of the color-color diagram. Nevertheless, it still remains unclear as to what drives the state changes on the Z or atoll track. Lin et al. (2009) suggest that the accretion disk evolves from a thin disk to a slim disk, while others have previously suggested that small changes in mass accretion rate change the source state though there is disagreement as to which direction along the Z track mass accretion rate increases (e.g. Hasinger et al., 1990; Migliari et al., 2007; Church et al., 2006).
In this paper, we present the results of our UV/X-ray monitoring campaign of Cyg X-2. Section 2 describes the observations and data reduction. Section 3 we present the analysis and results, including the surprising finding that, contrary to expectations from the reprocessing model, the NUV and BAT X-ray flux are anticorrelated. Finally, we discuss the implications of our results in Section 4.
2. Observations and Data Reduction
Swift visited Cyg X-2 for 51 observations between 2008 June 30 and 2008 November 11, comprising observations 00090045001 through 00090045056. XRT observations were taken in windowed timing (WT) mode due to the high count-rate. The UVOT exposures were taken in two filters (, ), and BAT data was taken in standard survey mode. Table 1 describes the observations, exposure times, and rates for the XRT, , and BAT detections described in this section.
2.1. XRT Data Reduction
The XRT observations were processed using the packages and tools available in HEASOFT version 6.6.1111See http://heasarc.gsfc.nasa.gov/docs/software/lheasoft. Initial event cleaning was performed with “xrtpipeline” using standard quality cuts, and event grades 0-2 in WT mode. For the WT mode data, source extraction was performed with “xselect” in a rectangular box 20 pixels wide and 60 pixels long. Background extraction was performed with a box 20 pixels wide and 60 pixel long far from the source region. Several Swift observations contain multiple pointings separated by more than an hour. For these observations, each individual pointing was processed separately, as the detector response varies depending on the location of the source in the field of view, as well as the fact that Cyg X-2 may vary significantly on these timescales.
Several individual XRT pointings have been rejected for further analysis for two reasons. First, we demand that each orbital good time interval (GTI) has over 100 seconds of continuous observations. Second, we rejected 5 pointings where Cyg X-2 is at the edge of the WT mode field of view and the source extraction region is truncated. In all there are 83 epochs used in this analysis with exposure times ranging from 100 s to 1463 s, with a median exposure time of .
After event selection, exposure maps were generated with “xrtexpomap”, and ancillary response function (arf) files with “xrtmkarf”. The latest response files (v011) were used from the CALDB database. All spectra considered in this paper were grouped to require at least 20 counts per bin using the ftool “grppha” to ensure valid results using statistical analysis. The spectra were analyzed using XSPEC version 11.3.2ag (Arnaud, 1996). Fits were restricted to the 0.6-10 keV range due to calibration uncertainties at energies less than 0.6 keV. The uncertainties reported in this work are errors, obtained by allowing all fit parameters to vary simultaneously.
The observations were affected by pile-up, as the observed count rate varied from (0.6-10 keV). To correct for pile-up, we followed the spectral fitting method described in Romano et al. (2006) and Rykoff et al. (2007): using various exclusion regions centered on the source, we refit the continuum spectrum until the fit parameters did not vary significantly. We found that a 10 pixel exclusion region was sufficient to correct pile-up in the brightest epochs. For simplicity, we use the same exclusion region for all of the observations. We then calculate the conversion factor to determine the non-piled-up equivalent count rate. This is obtained from the ratio of the arf (at 1.5 keV) calculated with and without PSF correction. We note that this correction is only applied when estimating the source intensity, and is not necessary when calculating colors, which are count rate ratios.
| NumberaaThe full observation number is given by prepending 00090045. | Orbit | XRT | XRTbbIn the 0.6-10 keV range. | BAT | BATccIn the 14-24 keV range. | ||
|---|---|---|---|---|---|---|---|
| Exp. Time (s) | Rate | Exp. Time (s) | Magnitude | Exp. Time (s) | Rate | ||
| 001 | 1 | 1192 | 584 | 1200 | |||
| 002 | 1 | 1183 | 584 | 1211 | |||
| 003 | 1 | 337 | 199 | 350 | |||
| 2 | 439 | 230 | 460 | ||||
| 004 | 1 | 912 | 584 | 300 | |||
| 005 | 1 | 1077 | 525 | 1091 | |||
| 2 | 771 | 348 | 860 | ||||
| 006 | 2 | 806 | 436 | 844 | |||
| 007 | 1 | 850 | 436 | 864 | |||
| 2 | 909 | 466 | 924 | ||||
| 3 | 529 | 289 | 564 | ||||
| 008 | 1 | 358 | 200 | 372 | |||
| 2 | 418 | 230 | 432 | ||||
| 3 | 718 | 377 | 732 | ||||
| 4 | 514 | 289 | 552 | ||||
| 009 | 1 | 1068 | 554 | 1109 | |||
| 010 | 1 | 1079 | 584 | 1100 | |||
| 011 | 1 | 1136 | 584 | 1165 | |||
| 012 | 1 | 976 | 495 | 1009 | |||
| 013 | 1 | 648 | 318 | 663 | |||
| 2 | 402 | 199 | 425 | ||||
| 015 | 1 | 1055 | 525 | 1090 | |||
| 016 | 1 | 1032 | 525 | 1062 | |||
| 017 | 1 | 1324 | 673 | 1362 | |||
| 018 | 1 | 929 | 495 | 942 | |||
| 2 | 897 | 494 | 903 | ||||
| 019 | 1 | 1183 | 612 | 1200 | |||
| 020 | 1 | 1095 | 554 | 1129 | |||
| 022 | 1 | 1009 | 525 | 1024 | |||
| 2 | 1108 | 584 | 1144 | ||||
| 023 | 1 | 1020 | 525 | 1034 | |||
| 2 | 132 | – | – | 170 | |||
| 025 | 1 | 671 | 348 | 684 | |||
| 026 | 1 | 946 | 495 | 975 | |||
| 027 | 1 | 1463 | 731 | 1200 | |||
| 028 | 1 | 1354 | 671 | 1384 | |||
| 029 | 1 | 143 | 136 | 157 | |||
| 2 | 456 | 258 | 487 | ||||
| 030 | 1 | 225 | 217 | 213 | |||
| 2 | 297 | 286 | 310 | ||||
| 5 | 298 | 310 | 332 | ||||
| 6 | 374 | – | – | – | – | ||
| 7 | 302 | – | – | – | – | ||
| 031 | 1 | 1417 | 702 | 600 | |||
| 032 | 1 | 437 | 230 | 450 | |||
| 2 | 442 | 230 | 474 | ||||
| 033 | 1 | 647 | 318 | 666 | |||
| 2 | 643 | 318 | 662 | ||||
| 034 | 1 | 795 | 407 | 818 | |||
| 036 | 1 | 756 | 377 | 770 | |||
| 2 | 738 | 377 | 770 | ||||
| 037 | 1 | 798 | 406 | 830 | |||
| 038 | 1 | 1109 | 553 | 1150 | |||
| 039 | 1 | 1052 | 524 | 1086 | |||
| 041 | 1 | 142 | – | – | 156 | ||
| 2 | 142 | – | – | 156 | |||
| 3 | 142 | – | – | 153 | |||
| 4 | 142 | – | – | 156 | |||
| 5 | 254 | 111 | 268 | ||||
| 6 | 262 | 140 | 276 | ||||
| 7 | 143 | – | – | 156 | |||
| 8 | 142 | – | – | 156 | |||
| 9 | 143 | – | – | 157 | |||
| 10 | 131 | – | – | 156 | |||
| 042 | 1 | 409 | 199 | 422 | |||
| 2 | 471 | 230 | 485 | ||||
| 4 | 471 | 230 | 485 | ||||
| 044 | 2 | 211 | 220 | 241 | |||
| 045 | 2 | 336 | 171 | 349 | |||
| 3 | 249 | 141 | 265 | ||||
| 046 | 1 | 498 | 258 | 511 | |||
| 2 | 417 | 229 | 451 | ||||
| 047 | 1 | 378 | 199 | – | – | ||
| 2 | 784 | 406 | 811 | ||||
| 048 | 1 | 465 | 230 | 479 | |||
| 049 | 1 | 465 | 230 | 478 | |||
| 2 | 465 | – | – | 478 | |||
| 3 | 445 | 229 | 478 | ||||
| 053 | 1 | 493 | 259 | 505 | |||
| 2 | 478 | 259 | 505 | ||||
| 055 | 1 | 947 | – | – | – | – | |
| 056 | 1 | 548 | – | – | – | – | |
| 2 | 408 | – | – | – | – |
2.2. UVOT Data Reduction
The UVOT analysis we performed is similar to that of Rykoff et al. (2007). The UVOT images were initially processed at HEASARC using the standard Swift “uvotpipeline” procedure, with standard event cleaning. The initial astrometric solution of UVOT images is typically offset by up to 5-10″. We corrected for this offset by matching stars with the USNO B1.0 catalog, improving the aspect solution to better than 1″. Our procedure is similar to the ftool “uvotskycorr”. Due to the relatively rapid variation of Cyg X-2, observations with more than one exposure were analyzed independently.
The UVOT images are not very crowded, in spite of the relatively low Galactic latitude (), although a bright star just outside the field of view created a noticeable blaze in the images. Initial photometry was performed using “uvotdetect” with the calibration option set to perform coincidence loss correction and calibration to standard UVOT photometry (Poole et al., 2008). We then perform relative photometry using 36 template stars that are well measured and brighter than 17.5 mag in the filter. The rms error for the relative photometry correction is typically , and we confirm that the corrected light curves of the comparison stars are stable within . At this step we remove bad observations where fewer than 3 template stars are detected. These are typically observations with exposure times less than . After rejecting 10 bad observations, we observed Cyg X-2 for a total of 68 epochs in the filter. There were fewer (46) good observations with the filter. Therefore, we concentrate our further analysis on the broad filter, although we have confirmed that our results are identical for , which has a substantial wavelength overlap with .
2.3. BAT Data Reduction
The Swift/BAT analysis was performed with the ftool “batsurvey,” which takes as input the BAT detector plane histograms (DPHs) assembled in survey mode, and outputs background subtracted flux values. We ran “batsurvey” in SNAPSHOT mode to combine all DPHs from each individual orbit, and set the binning to the standard 8 energy channels (14-20,20-24,24-35,35-50,50-75,75-100,100-150,150-195 keV). An input source catalog containing the location of Cyg X-2 was created to ensure that the flux would be estimated even when it was not detected at a level. Similar to the analysis for the XRT and UVOT data, we demanded a minimum exposure time of , which yields 77 epochs. The spectrum of Cyg X-2 is very soft in the BAT band, and it is generally not detected in the hardest X-ray channels. By summing over energy channels, we were able to determine that the BAT flux in the 14-24 keV range provides the maximum signal-to-noise for the majority of the BAT measurements. Finally, we convert the “batsurvey” output rates to .
3. Analysis & Results
3.1. Color-Color Diagram
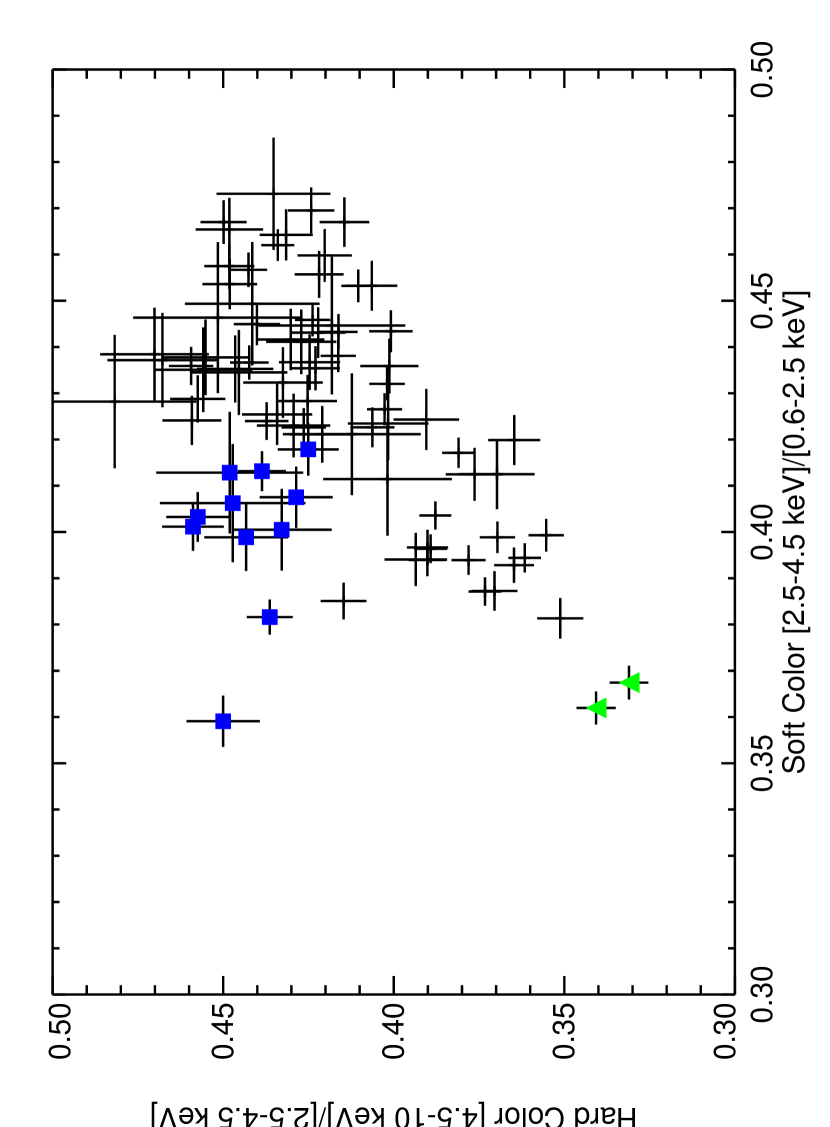
The most useful method of displaying the variability of Z-sources such as Cyg X-2 is with a color-color diagram. The bandpass of Swift/XRT is narrower and softer than other X-ray detectors such as RXTE/PCA, so we are unable to use the color definitions commonly applied to RXTE data. We follow the color definitions of Schulz et al. (2009), who defined colors appropriate to Chandra/HETGS, which has a similar soft bandpass as Swift/XRT. The three color bands we define are 0.6-2.5 keV (soft), 2.5-4.5 keV (middle), and 4.5-10 keV (hard), such that the soft (hard) color is defined as the ratio of the count rate in the middle-to-soft (hard-to-middle) bands.
The resulting color-color diagram is shown in Figure 1. Most of our observations are along the NB or the vertex of the NB and the HB. For visual reference in the succeeding figures, we have marked the observations along the HB based on soft color (sc) and hard color (hc), using an arbitrary definition of and . The two observations that have the softest colors are clearly on the FB. In addition to being outliers in the color-color plot, the light curves of these observations show strong variability characteristic of the FB. A sample light curve from observation 002 in the FB is shown in Figure 2. Thus, over the course of 83 epochs we have snapshots scanning the entire Z-track of Cyg X-2.

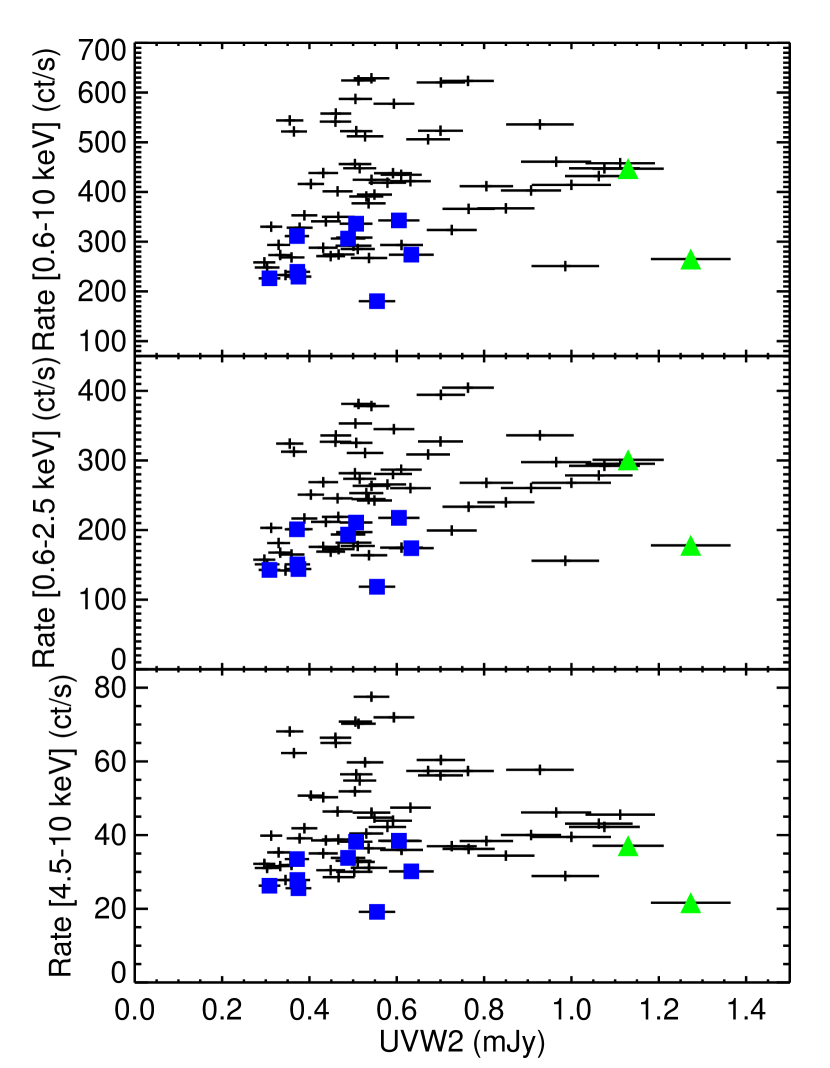
3.2. Simultaneous Soft X-ray and NUV Observations
The multi-wavelength Swift observatory allows us to easily obtain simultaneous observations of Cyg X-2 in both X-ray and NUV wavelengths. If the NUV emission is reprocessed X-ray emission, we may expect the NUV flux to track the X-ray flux, as described in § 1. Figure 3 shows the XRT rate in the “soft”, “medium”, and “hard XRT” energy bands as a function of flux density. We do not observe an obvious correlation between the NUV and the X-ray flux for energies less than . However, we do notice the Z-track apparent in the figure, especially for the bottom panel which shows the hard X-ray band vs. . Particularly notable is the fact that the FB observations correlate with the brightest NUV observations, and the HB observations correlate with some of the dimmest NUV observations. A similar trend was noted with 7 simultaneous observations using Ginga and IUE (Vrtilek et al., 1990). Those authors concluded that the NUV flux is brightest on the FB and dimmest on the HB.
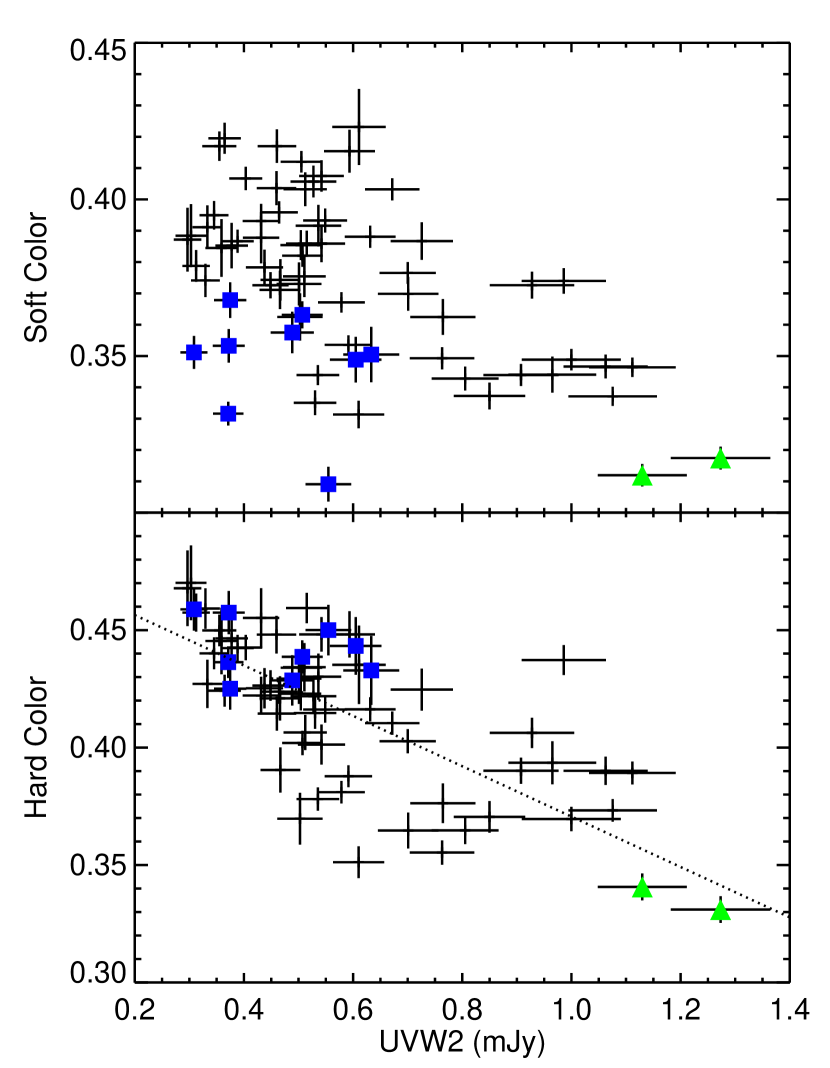
We next investigate if there is any correlation between X-ray color and NUV flux. Figure 4 shows the hard and soft X-ray color vs. the flux density. Although there is no strong correlation between the soft X-ray color and the NUV, there is a strong anticorrelation between the hard X-ray color and the NUV. That is, as the hard X-ray color decreases, the NUV flux increases and vice-versa. This anticorrelation drives the apparent correlation between NUV flux and Z-track location observed by Vrtilek et al. (1990): the FB has the softest X-ray color and highest NUV flux, and the HB has a harder X-ray color and lower NUV flux. However, our complete coverage of the Z-track of Cyg X-2 reveals that it is the hard color, not the position along the Z-track, that is anticorrelated with the NUV flux. Otherwise, we would observe the NUV flux to vary along the HB, rather than to vary with hardness.
We have fit the hard color– relation with the functional form using the linmix linear regression package (Kelly, 2007). We find that and , with the best-fit slope less than 0 at the level. We further confirm the significant anticorrelation by calculating the Spearman correlation coefficient, such that . Finally, looking at the bottom panel of Figure 3, we can see a hint of this anticorrelation, as the NUV flux density is noticeably anticorrelated with the 4.5-10 keV flux when Cyg X-2 is observed in the NB and FB.
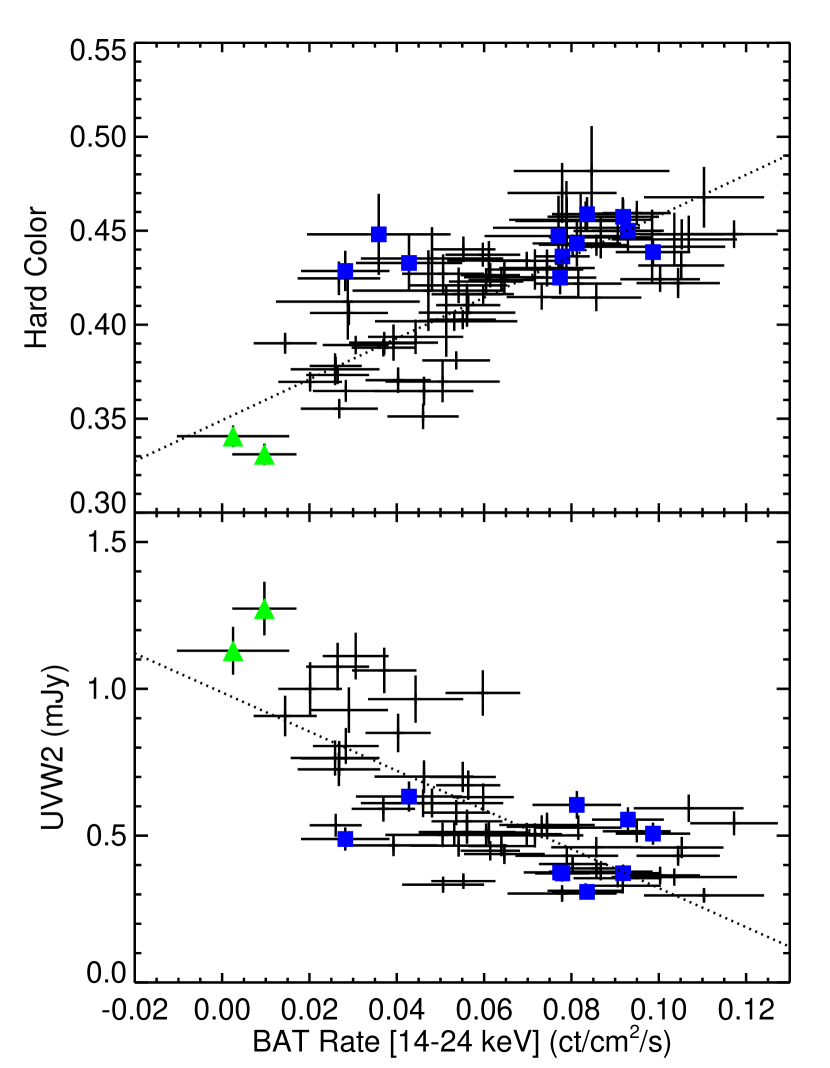
3.3. Simultaneous Soft and Hard X-ray and NUV Observations
We now compare the XRT and NUV data with the hard X-ray observations of Cyg X-2 obtained with BAT. As discussed in § 2.3, Cyg X-2 has a relatively soft spectrum and is only significantly observed in first two channels, corresponding to the 14-24 keV energy band, which we refer to as “BAT X-rays”. The top panel of Figure 5 shows the hard X-ray color (as measured by the XRT) against the BAT rate. These two quantities are very strongly correlated, with a Spearman coefficient of . Fitting to the functional form , where is the BAT rate measured in , we find and . This strong correlation shows that the hard X-ray rate is dominated by the spectral index in the 2.5-10 keV band – a steeper spectral index yields a softer color and a lower hard X-ray rate. We have also confirmed that the BAT rate also depends on the XRT rate in the 4.5-10 keV band, although the hard color is the dominant driver.
The bottom panel of Figure 5 shows the flux density against the BAT rate. As with the flux density and the hard X-ray color, these two quantities are strongly anticorrelated, with a Spearman coefficient of . The best-fit line to the functional form yields and . As with the anticorrelation between the hard color and the NUV flux, there is no indication that the NUV flux varies along the HB. It is difficult to reconcile the observed anticorrelation with a simple model in which the NUV emission is hard X-ray emission reprocessed by the accretion disk. We discuss these implications in Section 4.
3.4. Spectral evolution
As described in Section 1, the spectral evolution of sources along their Z track is of great interest, and it is still not entirely clear as to the mechanism that drives these spectral changes. Cyg X-2 has been the focus of several previous investigations into Z track spectral evolution (e.g., Hasinger et al., 1990; Vrtilek et al., 1990; Done et al., 2002; Piraino et al., 2002; Di Salvo et al., 2002; Vrtilek et al., 2003). These previous observations have been performed with a variety of X-ray missions including Ginga, RXTE, and BeppoSAX. These three missions, in particular had/have quite broad energy coverage from a few keV to greater than 20 keV, allowing for a good characterization of the continuum, though lacking the spectral resolution to study any line features in detail. These previous studies find that the spectrum of Cyg X-2 can be fit by a variety of different models (as is usual for Z sources). For instance, Hasinger et al. (1990) fit the Eastern model to Ginga data and find temperatures for the single-temperature blackbody component of 2.2-2.7 keV, and temperatures for the disk blackbody of 1.5-1.9 keV. Di Salvo et al. (2002) fit a disk blackbody plus a Comptonized component (XSPEC model “comptt”) to BeppoSAX observations and found disk temperatures from 0.8-1.7 keV and plasma temperatures upwards of 3 keV.
The observations of Hasinger et al. (1990) cover all three spectral states (HB, NB, and FB). They note that the largest change in spectral shape is seen as the source goes from the NB to the FB, where the disk temperature and luminosity increase significantly when modeled by the Eastern model. The observations of Di Salvo et al. (2002) cover mostly the HB and the NB. These authors suggest that the inner rim of the accretion disk approaches the neutron star surface as the source moves from the HB to the NB.
In an attempt to further understand the continuum spectral evolution of Cyg X-2, we examined the Swift/XRT spectra from our monitoring campaign. In the 0.6-10 keV band, a good fit to the XRT data can be achieved using a two thermal component model (disk blackbody and a blackbody). For this energy range, no additional power-law component is required. For the photoelectric absorption, we fix the column density to cm-2. This is consistent with values determined from both HI observations222using the HEASARC tool: http://heasarc.gsfc.nasa.gov/cgi-bin/Tools/w3nh/w3nh.pl, and from previous fits to the X-ray spectra (e.g. Di Salvo et al., 2002). With this model, we consistently find temperatures for the disk blackbody and blackbody components of around and keV respectively. Note that these temperatures are significantly lower than seen by the previous spectral studies of Cyg X-2 discussed above.
In order to address this issue, we searched for any RXTE observations that were simultaneous with any of our XRT observations. We found that our Swift observation 002, orbit 1 was overlapping with RXTE observation 93443-01-01-15. The XRT observation was performed on 2008-07-02 from 23:26 to 23:46, whereas the RXTE observation ran from 23:00 to 23:38 on the same date. We extracted the RXTE/PCA spectrum from PCU 2 only (the most reliable PCU), using the standard goodtime filtering and deadtime corrections. We use the Standard 2 mode data, applying a systematic error of 0.6% to each channel of the spectrum (we follow the same method as Cackett et al., 2009b, for the RXTE data reduction).
First, we have fit the two thermal component model to the XRT data in the 0.6-10 keV energy range. We find an inner disk temperature of keV and blackbody temperature of keV (all errors at the level). However, when fitting the same model333We add a Gaussian to model the Fe K line not detectable in the XRT spectrum. to the RXTEspectrum in the 3-23 keV band, we find keV and keV, similar to what has been observed in previous studies of Cyg X-2. The higher energy coverage of RXTE/PCA is much better suited to constrain these thermal components which have a peak energy of and respectively.
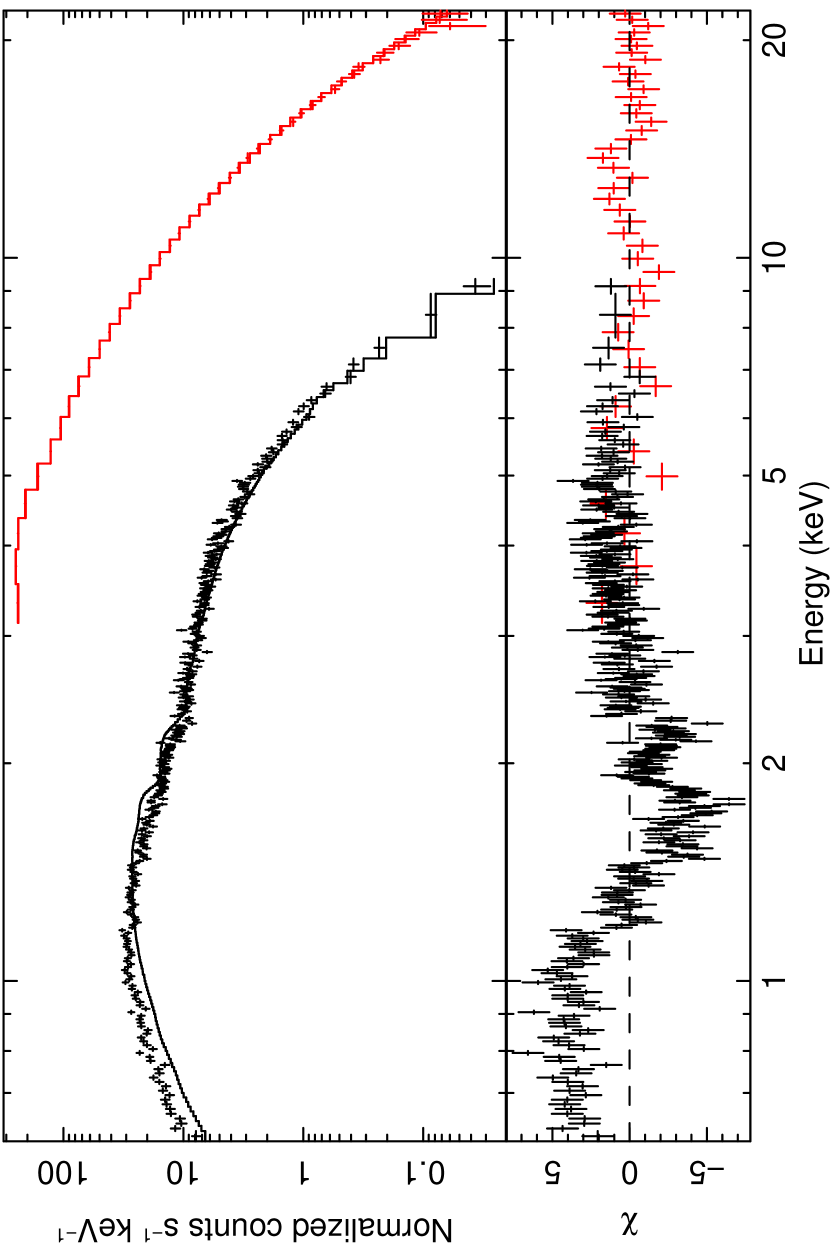
To test the source of this discrepancy, we have fit the XRT and RXTE spectra jointly in the 0.6-23 keV range. We tie all model parameters in the absorbed two thermal component model between the two data sets. We also add a constant factor to allow for any absolute flux calibration mismatch. The resulting spectral fit is shown in Figure 6, and is clearly a bad fit, with a reduced of 3.5. The best-fitting model returns temperatures consistent with the parameters we find when fitting the RXTE data alone, and the spectra match nicely where they overlap in the 3-10 keV range. However, there are large residuals present below 3 keV. After trying a wide range of other models (including combinations of disk blackbody, blackbody, power-law and Comptonization) we were unable to find a good fit. Allow to float as a free parameter did improve the fit, but not to an acceptable level, and also returned a very low value ().
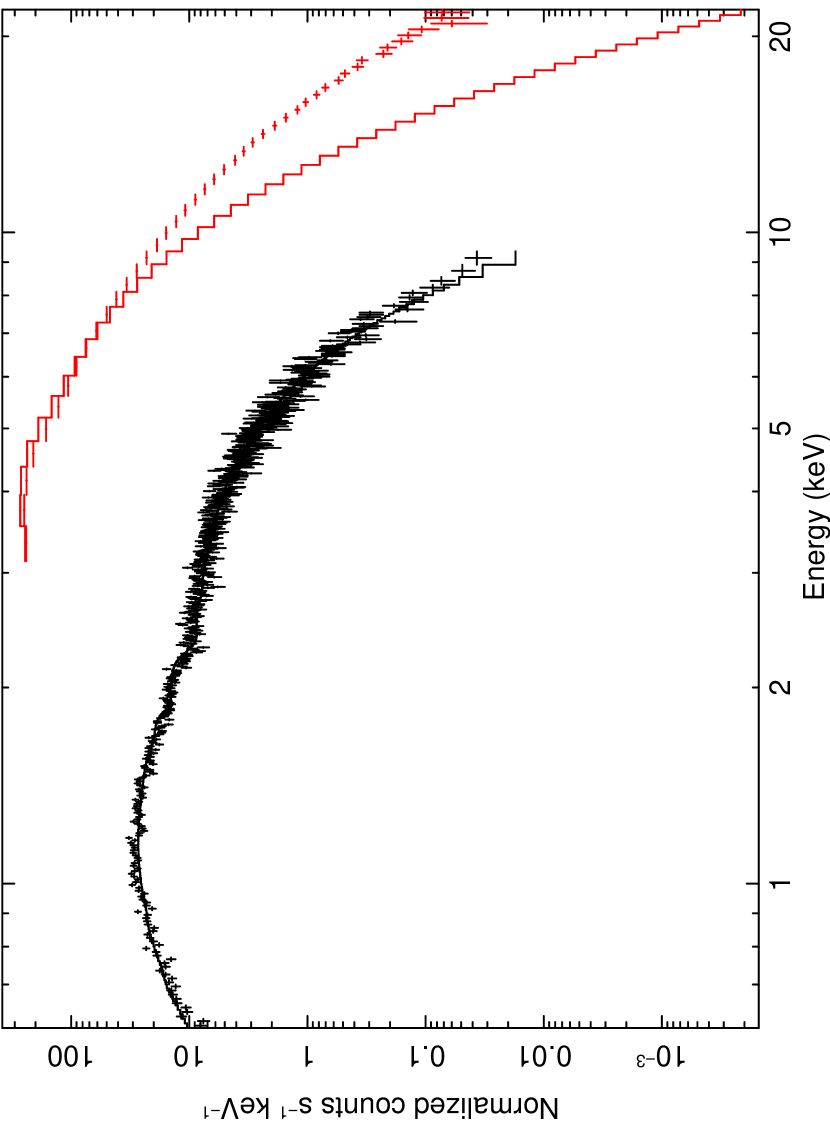
By fitting the XRT data alone we are able to minimize the residuals below 3 keV. However, an extrapolation of the XRT spectrum to higher energies significantly underpredicts the hard X-rays, as shown in Figure 7. In general, the 10-20 keV spectrum of NSXRBs can be well described by a 2-3 keV blackbody (Cackett et al., 2009a). The XRT fit is dominated by the spectral shape of the soft X-rays, where the response function peaks. Therefore, the fit to the XRT spectrum alone, in which the temperature of the blackbody component is grossly underestimated, cannot be properly extrapolated to the 10-20 keV range.
We have checked that the difference between the XRT and RXTE spectra does not appear to be a cross-calibration issue between the two instruments. As a confirmation, we analyzed several near-simultaneous XTE and RXTE observations of the black hole candidate LMXB XTE J1817330 during its 2006 outburst (see Rykoff et al., 2007, for details on all Swift observations). The Swift/XRT spectra of this object can be fit by a simple disk blackbody plus a power-law over a wide range in luminosity (Rykoff et al., 2007). When looking at near-simultaneous RXTE observations, we find that apart from a slight offset in absolute flux calibration, the spectra have the same shape – the power-law index and disk temperature recovered from fitting them separately and jointly are consistent. In the case of the neutron star binary Cyg X-2, the spectral decomposition is much more complicated than that for black hole binaries. Therefore, it seems likely that the difficulties in using the XRT spectrum alone arises due to the multi-component spectrum of Cyg X-2, rather than cross-calibration issues.
A Gaussian feature at around 1 keV has been reported by previous studies of Cyg X-2 (e.g. Di Salvo et al., 2002), and including a Gaussian at around 1 keV in the model does improve the fit. The origin of such a spectral feature is unclear, but recently Schulz et al. (2009) very briefly note that there is a complex line blend around 1 keV in their Chandra gratings spectra, the study of which will be the focus of their future work. However, even with the inclusion of a Gaussian in our fit, from fitting the XRT data alone, we still recover low temperatures. Therefore, we chose not to investigate the spectral evolution of Cyg X-2 along the Z track with the current Swift data set.
3.5. Periodicity
Using long baseline observations of Cyg X-2 with RXTE, Wijnands et al. (1996) detected a day period in the 1.5-12 keV light curve. At different times, a similar period of days has been detected in Vela 5B, Ariel 5, and RXTE-ASM data in addition to a shorter day period (Paul et al., 2000; Clarkson et al., 2003). The present set of Swift observations, spanning , is sufficiently long to confirm the ephemeris presented in Wijnands et al. (1996). Unfortunately, the Swift coverage is not long enough to independently measure the ephemeris.
The best-fit ephemeris from Wijnands et al. (1996) is:
Figure 8 shows the phased light curve using this ephemeris for Cyg X-2 for two XRT energy ranges (0.6-2.5 keV; 4.5-10 keV), BAT X-rays (14-24 keV), and UVW2. The count rate in each energy band has been scaled to the same amplitude, and offset for clarity. The true fractional amplitude for each energy range is 55% (0.6-2.5 keV); 60% (4.5-10 keV); 96% (14-24 keV); and 65% (UVW2).
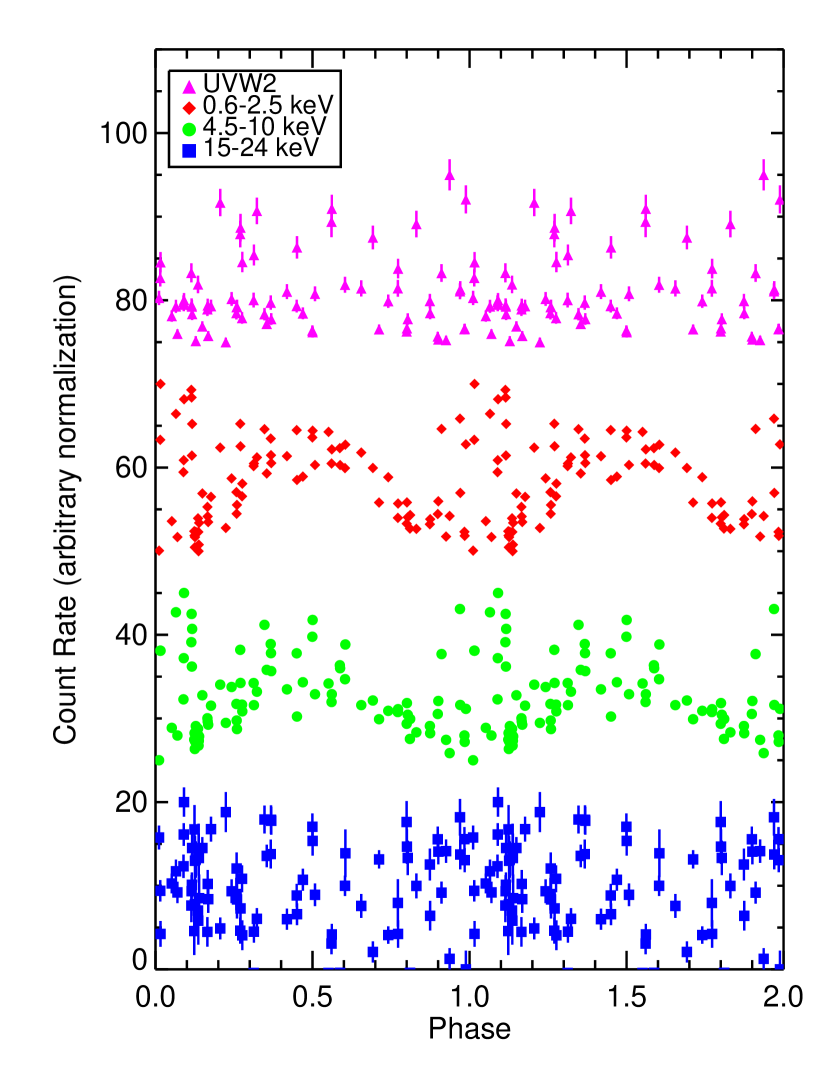
The phased light curve for the soft X-rays (0.6-2.5 keV; red diamonds) shows that the period and zero-point for the ephemeris, which was measured over 13 years ago, are well-matched to the current data set. Although there is significant variability in addition to the underlying periodicity, we observe a maximum at a phase of 0.5 and a minimum at a phase of 1.0. The minimum is consistent with previous observations, although we do not observe a less prominent secondary minimum at a phase of 0.5 (Wijnands et al., 1996). The periodicity is most prominent in the soft (0.6-2.5 keV) X-rays, and is less prominent in the harder (4.5-10 keV; green circles) X-rays, and is not apparent in either the BAT X-rays (14-24 keV; blue squares) or UVW2 (magenta triangles) data.
While the day period is readily apparent in the present soft X-ray data, we have not been able to confirm the day period observed at different times by other satellites (e.g. Paul et al., 2000; Clarkson et al., 2003). Clarkson et al. (2003) have suggested that the day and day periods are harmonics, with the day period as more stable. By studying Cyg X-2over a longer time baseline than Wijnands et al. (1996), they find that the dominant period changes, and suggest that the long-term ephemeris is not the reliable clock of Wijnands et al. (1996). Our Swiftdata provides more evidence that the dominant period changes over time. In addition, as our present data is consistent with the ephemeris of Wijnands et al. (1996), suggesting some long-term stability of this underlying mode.
Wijnands et al. (1996) attribute the observed superorbital periodicity to precession of a tilted accretion disk observed from a relatively high inclination angle, while Clarkson et al. (2003) attribute it to a precessing warped accretion disk. Our present observations are consistent with either interpretation: the accretion disk should dominate the spectrum in the soft X-rays, while the blackbody emission from the boundary layer dominates the BAT X-rays. Thus, we do not expect to observe this periodicity in the 14-24 keV range, which is dominated by blackbody emission (e.g., Cackett et al., 2009a).
4. Discussion
Hasinger et al. (1990) studied Cyg X-2 with a joint X-ray/NUV monitoring campaign, and concluded that the NUV emission is an indirect but superior measure of bolometric flux. They argue that the accretion disk is a better bolometer than our X-ray detectors because it is insensitive to bandpass effects. Assuming the NUV emission is dominated by reprocessed hard X-ray emission, it is then a good proxy for the total X-ray flux. With seven simultaneous X-ray/NUV observations, there was a hint that the UV continuum flux increases along the Z track. They therefore conclude that increases along the Z track from the FB through the NB to the HB.
However, our current observations tend to contradict the interpretation of Hasinger et al. (1990). First, we observe a strong anticorrelation between the NUV flux and 14-24 keV BAT X-ray flux, which is difficult to explain in the context of a simple reprocessing model. Second, there is no evidence in the X-rays that the bolometric luminosity is increasing as the BAT X-ray luminosity is decreasing. We observe no correlation between the XRT (0.6-10 keV) flux and the BAT flux, even after correcting for the observational phase. Third, with 68 epochs of simultaneous NUV and X-ray observations of Cyg X-2, we can demonstrate that the NUV does not vary monotonically along the Z-track, but rather varies inversely with the BAT X-ray emission and hard color.
The observed anticorrelation is in stark contrast to the strong correlation observed between the NUV flux and the 2-10 keV X-ray emission observed for the BHXRB XTE J1817330 (Rykoff et al., 2007). The most obvious difference between these two systems is the existence of the neutron star surface and boundary layer in Cyg X-2 which is not present in XTE J1817330. This issue is addressed in greater detail below. Another difference is the observed energy range. We have newly analyzed the 14-24 keV BAT observations of XTE J1817330, which was detected at the level during the first epochs. We have confirmed that the 2-10 keV flux detected with the XRT is a good proxy for the BAT X-ray emission. The simple spectral decomposition of the BHXRB makes this possible: while the softer X-ray emission is dominated by flux from the accretion disk, this provides the seed photons for the hard Comptonized component. It is this hard component that is reprocessed by the disk into the NUV emission that we observe.
As we have discussed in Section 3.4, the spectral decomposition of a NSXRB like Cyg X-2 is much more complicated. The hard X-ray emission above 10 keV is well described by a blackbody potentially from the NS boundary layer (e.g., Cackett et al., 2009a; Revnivtsev & Gilfanov, 2006). The emission from the boundary layer is not directly correlated with the softer emission from the accretion disk, and therefore the 2-10 keV flux is not a good proxy for the hard 14-24 keV BAT flux in this case. It is this hard X-ray emission that fluoresces the iron line (Cackett et al., 2009a) and should be reprocessed into NUV emission. The more complicated spectral decomposition of the NSXRB explains why we see a different relationship between XRT-NUV and BAT-NUV. However, it does not explain the anticorrelation between the BAT and NUV flux.
A possible explanation of the large difference between the NUVhard X-ray correlation in Cyg X-2 and XTE J1817330 is geometric. Although we do not have any constraints on the inclination of XTE J1817330, there is a large amount of evidence that we are observing Cyg X-2 at a high inclination angle. First, the short duration dips in the X-ray light curve imply a high inclination angle (Vrtilek et al., 1988). In addition, the periodicity in the optical light curve has been fit with an ellipsoidal model which constrains the inclination angle (Orosz & Kuulkers, 1999). Finally, the long period in the soft X-ray light curve can be attributed to the precession of a tilted accretion disk only if we are observing the source relatively edge-on (Wijnands et al., 1996; Clarkson et al., 2003).
Modeling the accretion disk atmosphere and corona of a NSXRB, Jimenez-Garate et al. (2002) have shown that the atmosphere and corona expands as the disk is radiatively heated. As the corona expands, more of the reprocessed NUV flux will be scattered out of the line-of-sight of an observer at a high inclination angle. The effect of the scattering may be larger than the increase in reprocessed emission as the disk is heated by the hard X-rays. Thus, we can observe an anticorrelation between NUV flux and BAT X-rays in one source and a correlation in another depending on inclination angle.
We can compare our present observations to those of the BHXRB GX3394, which was observed simultaneously in the optical and X-rays (Motch et al., 1983). They observe an anti-correlation between the softer X-rays (1-13 keV) and the optical, which is qualitatively different than observed for the NUV/X-ray observations of both Cyg X-2 (uncorrelated) and XTE J1817330 (correlated). However, the hard X-rays (13-20 keV) were observed to have a significantly different behavior, in that they were slightly correlated with the optical emission. As GX3394 is observed at a relatively low inclination angle (Cowley et al., 2002), these observations are generally consistent with our geometric interpretation.
There are some remaining issues with this simple picture. The dips in the X-ray light curves occur primarily in the FB when the NUV emission is brightest. This may be explained by a cooling and condensing corona which begins to clump as it cools. The dips would then be a signature of this cool, clumpy corona. When the corona is heated and starts to puff up along the NB and HB, we scatter more NUV emission but the soft X-rays are no longer absorbed. Another issue is that the boundary layer could potentially be blocked by the high inclination.
Recently, Schulz et al. (2009) obtained long Chandra gratings spectra of Cyg X-2 throughout the Z track. They find a variety of broad emission lines in the spectra, and discovered that the line fluxes increase along the Z track (lowest on the HB, highest on the FB). They suggest that this implies the average heating luminosity of the accretion disk therefore increases from HB to NB to FB. However, if the line emission is not fluorescent, but rather recombination emission, we may only be able to see the lines when the heating and ionization level of the gas is reduced. Further work will have to be done to fully develop this model.
Another possible explanation of the NUVhard X-ray anti-correlation is given by the spectral modeling of Revnivtsev & Gilfanov (2006), applied to several Z-track NSXRBs. Using frequency resolved spectroscopy to decompose the spectral components (Gilfanov et al., 2003), they were able to separate the component varying on s-ms timescales, which has a harder spectrum and is consistent with the boundary layer, from the stable component, which has a softer spectrum and is consistent with the accretion disk. At the HB/NB transition, the geometry of the accretion flow appears to change, and we begin to lose the clear distinction between the boundary layer and the accretion disk. At the FB, the thickening accretion disk may encompass the whole NS.
In this model, as the geometry changes over the Z-track, the nature of the reprocessed emission will also change. As the source goes down the NB to the FB and we lose sight of the boundary layer, the hard X-ray flux decreases. At the same time, we observe more of the thickening accretion disk, and as this is the source of the reprocessed emission the NUV flux will increase. This model may also be consistent with the interpretation of the line fluxes by Schulz et al. (2009), and an increase of over the Z-track. Furthermore, in this model the boundary layer is still visible in the HB/NB, in spite of the large inclination angle.
As discussed above, the present observations are a challenge to the simple interpretation of Hasinger et al. (1990) where increases monotonically along the Z-track of Cyg X-2 from HB-NB-FB. If changes in lead directly to changes the the temperature of the blackbody component, as may be suggested by some models (Popham & Sunyaev, 2001), then it may be that increases as the hard color increases. On the other hand, Lin et al. (2009) and Homan et al. (2010) have suggested that Z sources have roughly constant , but that different mechanisms, possibly related to the size of the boundary layer and inner disk radius, are responsible for changing the spectrum along the Z-track. The model of Revnivtsev & Gilfanov (2006), with a thickening accretion disk that encompasses the NS boundary layer, is nominally consistent with many of these interpretations. Without sufficient spectral coverage of the hard X-rays in the 10-20 keV range to consistently track the blackbody component, our present observations are insufficient to improve on the present uncertain state of affairs.
The question of whether viewing geometry or a thickening accretion disk is the source of the anticorrelation between NUV and hard X-ray flux is easily testable with further observing campaigns of sources at different inclination angles. Unfortunately, most known NSXRB systems are too extincted in the NUV for such a study. However, other sources such as 4U 0614+09 have sufficiently low column density and large variability to be good targets for follow-up work.
References
- Arnaud (1996) Arnaud, K. A. 1996, in ASP Conf. Ser. 101: Astronomical Data Analysis Software and Systems V, ed. G. H. Jacoby & J. Barnes, 17–+
- Barret (2001) Barret, D. 2001, Advances in Space Research, 28, 307
- Barret et al. (2000) Barret, D., Olive, J. F., Boirin, L., Done, C., Skinner, G. K., & Grindlay, J. E. 2000, ApJ, 533, 329
- Barthelmy et al. (2005) Barthelmy, S. D. et al. 2005, Space Science Reviews, 120, 143
- Burrows et al. (2005) Burrows, D. N. et al. 2005, Space Science Reviews, 120, 165
- Cackett et al. (2009a) Cackett, E. M. et al. 2009a, ArXiv e-prints, astro-ph/0908.1098
- Cackett et al. (2009b) —. 2009b, ApJ, 690, 1847
- Church et al. (2006) Church, M. J., Halai, G. S., & Bałucińska-Church, M. 2006, A&A, 460, 233
- Clarkson et al. (2003) Clarkson, W. I., Charles, P. A., Coe, M. J., & Laycock, S. 2003, MNRAS, 343, 1213
- Cowley et al. (2002) Cowley, A. P., Schmidtke, P. C., Hutchings, J. B., & Crampton, D. 2002, AJ, 123, 1741
- Di Salvo et al. (2002) Di Salvo, T. et al. 2002, A&A, 386, 535
- Done et al. (2002) Done, C., Życki, P. T., & Smith, D. A. 2002, MNRAS, 331, 453
- Gehrels et al. (2004) Gehrels, N. et al. 2004, ApJ, 611, 1005
- Gilfanov et al. (2003) Gilfanov, M., Revnivtsev, M., & Molkov, S. 2003, A&A, 410, 217
- Hasinger & van der Klis (1989) Hasinger, G., & van der Klis, M. 1989, A&A, 225, 79
- Hasinger et al. (1990) Hasinger, G., van der Klis, M., Ebisawa, K., Dotani, T., & Mitsuda, K. 1990, A&A, 235, 131
- Homan et al. (2010) Homan, J. et al. 2010, ArXiv e-prints, astro-ph/1005.3210
- Hynes et al. (2006) Hynes, R. I., Horne, K., O’Brien, K., Haswell, C. A., Robinson, E. L., King, A. R., Charles, P. A., & Pearson, K. J. 2006, ApJ, 648, 1156
- Jimenez-Garate et al. (2002) Jimenez-Garate, M. A., Raymond, J. C., & Liedahl, D. A. 2002, ApJ, 581, 1297
- Kelly (2007) Kelly, B. C. 2007, ApJ, 665, 1489
- Lin et al. (2007) Lin, D., Remillard, R. A., & Homan, J. 2007, ApJ, 667, 1073
- Lin et al. (2009) —. 2009, ApJ, 696, 1257
- Migliari et al. (2007) Migliari, S. et al. 2007, ApJ, 671, 706
- Mitsuda et al. (1989) Mitsuda, K., Inoue, H., Nakamura, N., & Tanaka, Y. 1989, PASJ, 41, 97
- Motch et al. (1983) Motch, C., Ricketts, M. J., Page, C. G., Ilovaisky, S. A., & Chevalier, C. 1983, A&A, 119, 171
- Orosz & Kuulkers (1999) Orosz, J. A., & Kuulkers, E. 1999, MNRAS, 305, 132
- Paul et al. (2000) Paul, B., Kitamoto, S., & Makino, F. 2000, ApJ, 528, 410
- Piraino et al. (2002) Piraino, S., Santangelo, A., & Kaaret, P. 2002, ApJ, 567, 1091
- Poole et al. (2008) Poole, T. S. et al. 2008, MNRAS, 383, 627
- Popham & Sunyaev (2001) Popham, R., & Sunyaev, R. 2001, ApJ, 547, 355
- Revnivtsev & Gilfanov (2006) Revnivtsev, M. G., & Gilfanov, M. R. 2006, A&A, 453, 253
- Romano et al. (2006) Romano, P. et al. 2006, A&A, 456, 917
- Roming et al. (2005) Roming, P. W. A. et al. 2005, Space Science Reviews, 120, 95
- Russell et al. (2006) Russell, D. M., Fender, R. P., Hynes, R. I., Brocksopp, C., Homan, J., Jonker, P. G., & Buxton, M. M. 2006, MNRAS, 371, 1334
- Rykoff et al. (2007) Rykoff, E. S., Miller, J. M., Steeghs, D., & Torres, M. A. P. 2007, ApJ, 666, 1129
- Schulz et al. (2009) Schulz, N. S., Huenemoerder, D. P., Ji, L., Nowak, M., Yao, Y., & Canizares, C. R. 2009, ApJ, 692, L80
- van Paradijs & McClintock (1994) van Paradijs, J., & McClintock, J. E. 1994, A&A, 290, 133
- Vrtilek et al. (2003) Vrtilek, S. D., Raymond, J. C., Boroson, B., McCray, R., Smale, A., Kallman, T., & Nagase, F. 2003, PASP, 115, 1124
- Vrtilek et al. (1990) Vrtilek, S. D., Raymond, J. C., Garcia, M. R., Verbunt, F., Hasinger, G., & Kurster, M. 1990, A&A, 235, 162
- Vrtilek et al. (1988) Vrtilek, S. D., Swank, J. H., Kelley, R. L., & Kahn, S. M. 1988, ApJ, 329, 276
- White et al. (1988) White, N. E., Stella, L., & Parmar, A. N. 1988, ApJ, 324, 363
- Wijnands et al. (1996) Wijnands, R. A. D., Kuulkers, E., & Smale, A. P. 1996, ApJ, 473, L45+