Discovery of Strong Radiative Recombination Continua from
The Supernova Remnant IC 443 with Suzaku
Abstract
We present the Suzaku spectroscopic study of the Galactic middle-aged supernova remnant (SNR) IC 443. The X-ray spectrum in the 1.75–6.0 keV band is described by an optically-thin thermal plasma with the electron temperature of keV and several additional Lyman lines. We robustly detect, for the first time, strong radiative recombination continua (RRC) of H-like Si and S around at 2.7 and 3.5 keV. The ionization temperatures of Si and S determined from the intensity ratios of the RRC to He-like K line are keV and keV, respectively. We thus find firm evidence for an extremely-overionized (recombining) plasma. As the origin of the overionization, a thermal conduction scenario argued in previous work is not favored in our new results. We propose that the highly-ionized gas were made at the initial phase of the SNR evolution in dense regions around a massive progenitor, and the low electron temperature is due to a rapid cooling by an adiabatic expansion.
Subject headings:
ISM: individual (IC 443) — supernova remnants — radiation mechanisms: thermal — X-rays: ISM1. Introduction
IC 443 (G189.1+3.0), a Galactic supernova remnant (SNR) at a distance of 1.5 kpc (Welsh & Sallmen 2003), is located near the Gem OB1 association and a dense giant molecular cloud (Cornett et al. 1977) with OH maser emission (Claussen et al. 1997). These facts strongly suggest that the remnant originated from a collapse of a massive progenitor. Braun & Strom (1986) proposed that the shock wave has expanded into the pre-existing wind-blown bubble shell. This was confirmed by a kinematical study of the optical filaments (Meaburn et al. 1990). A comprehensive X-ray study of IC 443 was first made with the Einstein and HEAO-A2 satellites (Petre et al. 1988). They estimated the SNR age to be 3000 yr. Recently, Troja et al. (2008) derived the age of 4000 yr from the morphologies of the shocked ejecta and interstellar medium (ISM) revealed by XMM-Newton. Thus, IC 443 is a middle-aged SNR.
Using ASCA, Kawasaki et al. (2002) found that the ionization degrees of Si and S were significantly higher than those expected from the electron temperature of the bremsstrahlung continuum. Therefore, it was argued that the plasma is in overionization ( , where and are ionization and electron temperatures, respectively). On the other hand, Troja et al. (2008) found that the plasma is in collisional ionization equilibrium (CIE), or the overionization is only marginal based on XMM-Newton data. These two controversial results hinge upon small differences, if any, between the estimated electron and ionization temperatures.
In this letter, we investigate whether the overionized plasma is really present or not, by utilizing the superior spectral capabilities for diffuse sources of X-ray Imaging Spectrometers (XIS: Koyama et al. 2007) aboard the Suzaku satellite (Mitsuda et al. 2007). If present, we will study the plasma condition quantitatively to discuss the possible origin of the overionization.
2. Observation and Data Reduction
The northern part of IC 443 was observed with Suzaku on 2007 March 6 (Observation ID = 501006010). Three XISs located at the foci of the independent X-Ray Telescopes (XRT: Serlemitsos et al. 2007) were operating111Suzaku carried four XISs, but one is now out of operation due to a damage possibly by an impact of a micro-meteorite. Two of the XISs are Front-Illuminated (FI) CCDs and the other is a Back-Illuminated (BI) CCD. The XIS was operated in the normal full-frame clocking mode with a spaced-row charge injection technique (Uchiyama et al. 2009) during the observation. For the data reduction and spectral analysis, we used the HEADAS software package of version 6.5 and XSPEC version 11.3.2, respectively. The XIS data of revision 2.0 were employed, but reprocessed using the xispi software and the latest calibration database released on 2009 February 3. After the screening with the standard criteria222http://heasarc.nasa.gov/docs/suzaku/processing/criteria_xis.html, an effective exposure of 42 ksec was obtained.
3. Analysis and Results
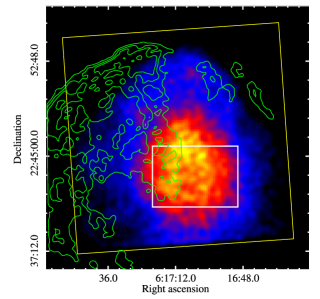

Figure 1 shows the vignetting-corrected XIS image in 1.75–3.0 keV, the energy band including the major lines of K-shell emissions from Si and S. We extracted the spectrum from the brightest region, the rectangular with an angular size of (see Fig. 1). This approximately corresponds to the “Center” region of Kawasaki et al. (2002). The XIS spectra of the two FIs in the entire energy range were made by subtracting the non X-ray background (NXB) constructed with the xisnxbgen software. The spectra were merged to improve the statistics, because the response functions are almost identical each other. Figure 2 shows the resultant spectrum. We can see several prominent lines of K emission from He- and H-like ions (hereafter, He and Ly). The centroids of the Ly lines were measured with a Gaussian line model, and compared with the canonical values of the Astrophysical Plasma Emission Database (APED: Smith et al. 2001). The averaged center energy difference was +4 eV. Therefore, we added a 4 eV offset in the FI spectrum. The BI spectrum was made with the same procedure as the FIs, but an offset of eV was added to correct the energy scale. In order to examine the ionization states of Si and S, we hereafter focus on the spectrum in the energy range above 1.75 keV (Fig. 3). Detailed studies including the lower energies will be reported in a separate paper.
We first fitted the spectrum with a model of a thin-thermal plasma in CIE state (a VAPEC model). The abundances (Anders & Grevesse 1989) of Si, S, and Ar were free parameters, while the Ca abundance was tied to Ar. Interstellar extinction was fixed to a hydrogen column density of = cm-2 with the solar elemental abundances, following Kawasaki et al. (2002) and Troja et al. (2008). The cosmic X-ray background (CXB) spectrum was approximated by a power-law model with photon index of = 1.412 and the surface brightness in the 2–10 keV band of erg cm-2 s-1 sr-1 (Kushino et al. 2002). Since IC 443 is located in the anti-Galactic center direction, contribution of the Galactic ridge X-ray emission was ignored. In the initial fit, we found a significant inconsistency between the FI and BI data around the energy of neutral Si K-edge (1.84 keV). This is due to the well-known calibration issue of the XIS. Since the calibration for the FI CCDs is currently far better than the BI, we decided to ignore the energy band below 1.9 keV in the BI spectrum. This fit leaved further large residuals, in both spectra, at the energies of S and Ar Ly lines, and hence was rejected with the /dof of 935/270.
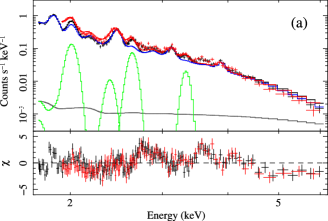
We, therefore, applied a model of one-temperature VAPEC (CIE plasma) plus narrow Gaussian lines at 2006, 2623, and 3323 eV, the Ly energies of the Si, S, and Ar, hydrogenic ions, respectively. This process is essentially the same as Kawasaki et al. (2002). Ly lines of the same elements were also added, but they were not significant except for Si (2377 eV). The result is shown in Figure 3a, with the best-fit CIE plasma temperature of 0.94 keV. Although the /dof value was significantly reduced to 657/266, the model was still unacceptable. In fact, apparent hump-like residuals are found around 2.7 keV and 3.5 keV, in addition to the systematic model excess in the continuum at the energies above 4.5 keV.
We checked systematic error due to the CXB fluctuation by allowing the CXB intensity as a free parameter. The fit, however, did not improve at all. We also tried two-component VAPEC models with independent temperatures and abundances, but these were rejected with /dof = 737/265. The results were essentially the same as figure 3a; the hump-like residuals remained at 2.7 keV and 3.5 keV. No additional CIE component nor non-equilibrium ionization (NEI) plasma model removed the hump-like residuals with significant improvement of the value.
| Component | Parameter | Value | |
| CIE (VAPEC) | (keV) | 0.61 (0.59–0.64) | |
| (solar) | 0.82 (0.78–0.85) | ||
| (solar) | 1.7 (1.6–1.8) | ||
| (solar) | 2.5 (2.2–2.8) | ||
| VEMaafootnotemark: ( cm-5) | 6.4 (6.3–6.6) | ||
| Additional components | |||
| (keV)bbfootnotemark: | Fluxccfootnotemark: | ||
| Line | Si Ly | 2.006 | 2.8 (2.7–2.9) |
| Si Ly | 2.377 | 0.21 (0.14–0.29) | |
| S Ly | 2.623 | 0.84 (0.79–0.90) | |
| Ar Ly | 3.323 | 0.11 (0.085–0.14) | |
| RRC | H-like Mg | 1.958 | 1.2 (1.0–1.5) |
| H-like Si | 2.666 | 2.2 (2.0–2.3) | |
| H-like S | 3.482 | 0.46 (0.41–0.51) | |
At the energies of the humps, no emission line candidate from an abundant element is found. However, the energies are consistent with the K-shell binding potentials () of the H-like Si (2666 eV) and S (3482 eV). Therefore, the humps are likely due to the free-bound transitions to the K-shell of the H-like Si and S. A formula for the spectrum of radiative recombination continuum (RRC) is found in equation (21) of Smith & Brickhouse (2002)333http://cxc.harvard.edu/atomdb/physics/plasma/plasma.html. When the electron temperature is much lower than the K-edge energy ( ), this formula is approximated as;
| (1) |
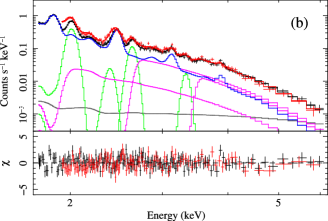
Thus, the width of the RRC structure depends on the electron temperature. We added the RRC of Equation 1 for H-like444“H-like RRC” refers to the free-bound emission due to electron captures by fully-ionized ions into ground state of H-like ions Si and S. The values of the RRC were linked to that of the VAPEC component. Then, the fit was dramatically improved to an acceptable /dof of 290/264. Although the hump-like residuals were completely removed by this fit, we further added the RRC model of H-like Mg. This step is reasonable because Mg is more abundant than Si and S in the solar abundance ratio of Anders & Grevesse (1989) and the K-edge energy of H-like Mg ( = 1958 eV) falls into the analyzed band. The /dof value was significantly reduced to 267/263, which gives an -test probability of . The best-fit parameters and model are given in Table 1 and Figure 3b, respectively. The spectrum was also fitted with the independent electron temperatures for the VAPEC and RRC components, but the values are consistent with each other within their statistical uncertainties.
4. Discussion and Conclusion
We have found that the 1.75–6.0 keV spectrum cannot be represented with CIE nor NEI plasma alone, but need the additional fluxes of the Lyman lines and the H-like RRC of Si and S (and possibly Mg). This is the first detection of clear RRC emissions in an SNR. In the following, we quantitatively discuss the implications of our spectral results.
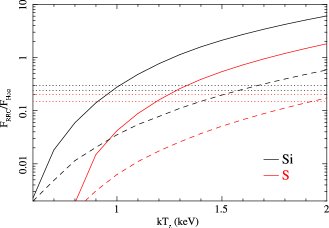
From the best-fit model in Table 1, the flux ratios of H-like RRC to He-like K (He) line () are given to be 0.28 (0.24–0.30) and 0.18 (0.15–0.20) for Si and S, respectively. These are compared, in Figure 4, with the modeled emissivity ratios by the plasma radiation code of Masai (1994) for the electron temperature of 0.6 keV. We find that the large observed ratios of are significantly above those in the CIE case ( = ), but can be reproduced in the overionization case ( ). The ionization temperatures of Si and S are determined to be keV and keV, respectively. This is, therefore, the firm evidence of the overionized (recombining) plasma.
The overionization claim for IC 443 was first argued by Kawasaki et al. (2002). Using ASCA data, they derived to be keV from the S Ly/He flux ratio compared with the predicted emissivity ratio in the CIE plasma code. Troja et al. (2008) adopted the same analysis procedure to the XMM-Newton spectrum, and claimed that obtained from the line flux ratio was nearly same as the bremsstrahlung temperature (). However, since the RRC process is accompanied with electron captures to the excited levels, as given in Equation 3 below, the resulting cascade decay to the ground state contributes the line emission. In a CIE plasma, on the other hand, origins of the line emissions are more dominated by the collisional excitation. Therefore, a determination done by comparing with a CIE plasma code is not a proper method. Also, the previous works assumed that the continuum spectrum purely consists of bremsstrahlung emission, and determined to be keV. This value has been reduced owing to the discovery of the strong RRC emissions.
It should be noted that the elemental abundances in Table 1 are determined as the parameters of the 0.6 keV VAPEC (CIE) component, and hence should be modified in the real case of the overionized plasma. The intensity of the Si-He line is given as , where and are, respectively, emissivity coefficient for electron temperature and fraction of He-like ion for ionization temperature . The abundance, therefore, can be modified by the fraction ratio of He-like ions, . According to the ionization population calculations by Mazzotta et al. (1998), the ion fractions of He-like, H-like, and fully-ionized Si (, , ) are estimated to be (0.83, 0.15, 0.01) for = 0.6 keV and (0.37, 0.43, 0.19) for = 1.0 keV, respectively. Then, the modified is solar. For S, (, , ) are (0.91, 0.02, 0) for = 0.6 keV and (0.59, 0.32, 0.06) for = 1.2 keV. Thus, we similarly modified to be solar.
Using the measured RRC flux, we can independently determine the volume emission measure, VEM = , from a following equation:
| (2) |
where and are K-shell RRC rate coefficient for electron temperature and number density of element , respectively. According to Badnell (2006), we find total radiative recombination rate for fully-ionized Si, at = 0.6 keV, is cm3 s-1. Since the rate of the recombination into a level of principal quantum number is described as;
| (3) |
(e.g., Nakayama & Masai 2001), we obtain = 0.65, for = 0.6 keV and = 2.666 keV. Thus, the VEM is calculated to be cm-5. Similarly, at 0.6 keV for fully-ionized S is derived to be cm3 s-1. Therefore, the RRC flux of S corresponds to the VEM of cm-5. These values are almost consistent with that of the VAPEC component (Table 1).
The rectangular region in Figure 1 corresponds to pc2 at = 1.5 kpc. Assuming the plasma depth of 3 pc, the emitting volume is estimated to be cm3. Therefore, the VEM of cm-5 is converted to the uniform electron density of cm-3.
As the mechanism to form the overionized plasma, Kawasaki et al. (2002) proposed that the SNR consists of a central hot ( 1.0 keV) region surrounded by a cool ( 0.2 keV) outer shell, and interpreted that the hot interior cooled down via thermal conduction to the cool exterior. Under the several reasonable boundary conditions, they estimated the cooling time from = 1.5 keV to 1.0 keV is about (3–10) yr, roughly the same as the SNR age (4000 yr: Troja et al. 2008). However, this scenario cannot work on our new results. According to equation (5) of Kawasaki et al. (2002), the conduction timescale is estimated to be
| (4) |
if the similar boundary condition is assumed. Thus, cooling via conduction requires far longer time than the SNR age. Photo-ionization is also unlikely because no strong ionizing source is found. Furthermore, the temperature of 0.6 keV is significantly higher than that of a typical photo-ionization plasma (0.1 keV: e.g., Kawashima & Kitamoto 1996).
Since the progenitor of IC 443 has been suggested to be a massive star with strong stellar wind activity (Braun & Strom 1986; Meaburn et al. 1990), we propose another possibility that the rapid and drastic cooling is due to a rarefaction process, as discussed by Itoh & Masai (1989). If a supernova explodes in a dense circumstellar medium made in the progenitor’s super giant phase, the gas is shock-heated to high temperature and significantly ionized at the initial phase of the SNR evolution. Subsequent outbreak of the blast wave to a low-density ISM caused drastic adiabatic expansion of the shocked gas and resultant rapid cooling of the electrons. The lifetimes of the fully-stripped ions are roughly estimated to be = yr for Si and yr for S, respectively. Note that these values are underestimated compared to the actual timescale for the plasma to reach CIE, because the contribution of collisional ionization processes is ignored. Nevertheless, the estimated lifetimes are longer than the age of IC 443. The overionized plasma can, therefore, still survive at present.
Future observations with very high energy resolution like the Astro-H mission will give firm evidence for the RRC structure not only on Si and S but also on the other major elements. This will provide more quantitative study on the peculiar SNR IC 443.
References
- Anders & Grevesse (1989) Anders, E., & Grevesse, N. 1989, Geochim. Cosmochim. Acta, 53, 197
- Badnell (2006) Badnell, N. R. 2006, ApJS, 167, 334
- Braun & Strom (1986) Braun, R., & Strom, R. G. 1986, A&A, 164, 193
- Claussen et al. (1997) Claussen, M. J., Frail, D. A., Goss, W. M., & Gaume, R. A. 1997, ApJ, 489, 143
- Cornett et al. (1977) Cornett, R. H., Chin, G., & Knapp, G. R. 1977, A&A, 54, 889
- Itoh & Masai (1989) Itoh, H., & Masai, K. 1989, MNRAS, 236, 885
- Kawashima & Kitamoto (1996) Kawashima, K., & Kitamoto, S. 1996, PASJ, 48, L113
- Kawasaki et al. (2002) Kawasaki, M. T., Ozaki, M., Nagase, F., Masai, K., Ishida, M., & Petre, R. 2002, ApJ, 572, 897
- Koyama et al. (2007) Koyama, K., et al. 2007, PASJ, 59, 23
- Kushino et al. (2002) Kushino, A., Ishisaki, Y., Morita, U., Yamasaki, N. Y., Ishida, M., Ohashi, T., & Ueda, Y. 2002, PASJ, 54, 327
- Masai (1994) Masai, K. 1994, ApJ, 437, 770
- Mazzotta et al. (1998) Mazzotta, P., Mazzitelli, G., Colafrancesco, S., & Vittorio, N. 1998, A&AS, 133, 403
- Meaburn et al. (1990) Meaburn, J., Whitehead, M. J., Raymond, J. C., Clayton, C. A., & Marston, A. P. 1990, A&A, 227, 191
- Mitsuda et al. (2007) Mitsuda, K., et al. 2007, PASJ, 59, 1
- Nakayama & Masai (2001) Nakayama, M., & Masai, K. 2001, A&A, 375, 328
- Petre et al. (1988) Petre, R., Szymkowiak, A. E., Seward, F. D., & Willingale, R. 1988, ApJ, 335, 215
- Serlemitsos et al. (2007) Serlemitsos, P. J., et al. 2007, PASJ, 59, 9
- Smith et al. (2001) Smith, R. K., Brickhouse, N. S., Liedahl, D. A., & Raymond, J. C. 2001, ApJ, 556, L91
- Troja et al. (2008) Troja, E., Bocchino, F., Miceli, M., & Reale, F. 2008, A&A, 485, 777
- Uchiyama et al. (2009) Uchiyama, H., et al. 2009, PASJ, 61, 9
- Welsh & Sallmen (2003) Welsh, B. Y., & Sallmen, S. 2003, A&A, 408, 545