Studies of reversible capsid shell growth
Abstract
Results from molecular dynamics simulations of simple, structured particles capable of self-assembling into polyhedral shells are described. The analysis focuses on the growth histories of individual shells in the presence of an explicit solvent and the nature of the events along their growth pathways; the results provide further evidence of the importance of reversibility in the assembly process. The underlying goal of this approach is the modeling of virus capsid growth, a phenomenon at the submicroscopic scale that, despite its importance, is little understood.
pacs:
81.16.Fg, 87.16.Ka, 02.70.Ns1 Introduction
The growth of viral capsids – the polyhedral shells of capsomer particles enclosing the genetic package of spherical viruses [1, 2] – is one of the more familiar examples of supramolecular self-assembly. The fact that assembly also occurs in vitro, in the absence of genetic material [3, 4, 5], simplifies the overall assembly problem and makes it an ideal candidate for simulation. A further reduction in complexity arises from the fact that icosahedral symmetry is ubiquitous among spherical viruses, where capsid shells are formed from an appropriate number of copies of just one or a small number of distinct capsomers; this implies that as an initial approximation, the molecular details of the capsomer proteins can be expressed in a highly reduced, nonspecific form. Molecular dynamics (MD) simulation employing simplified models of this kind ought to be capable of examining the existence and nature of universal organizational principles governing capsid self-assembly.
Simulation has an especially important role in the study of assembly pathways given that nonequilibrium systems are involved and, as a consequence, very little direct experimental evidence is available. Refs. [6, 7] describe MD modeling of capsid self-assembly based on simplified structural models in which the particle representation retains sufficient detail to ensure meaningful behaviour. The principal characteristics of the model are (a) an effective molecular shape formed out of rigidly packed soft spheres that enables particles to fit together in a closed shell, and (b) multiple interaction sites located to ensure that the minimal-energy structures, both intermediate and final, have the desired forms. The pathways themselves were not considered in the initial work, since the emphasis was on demonstrating the feasibility of assembly, and computational limitations required omission of an explicit solvent.
In a more recent study [8], self-assembly in the presence of an explicit atomistic solvent was described. Again there were computational limitations, in this case the limitation to icosahedral shells constructed from triangular particles, rather than the previously considered shells of size 60, and larger, formed from more elaborate trapezoidal particles, but there is no reason to question the generality of the observed behaviour. The presence of a solvent aids the breakup of partially assembled shells without subassemblies needing to collide directly, weakens the ballistic contribution to particle movement, and serves as a heat bath to absorb energy released during exothermal bond formation while helping to ensure conditions closer to thermal equilibrium. The results described in Ref. [8] lead to the conclusion that self-assembly consists of a cascade of reversible stages, in which low-energy, maximally bonded intermediate states are strongly preferred, a process that eventually yields a high proportion of completely assembled shells. Despite the apparent paradox, the efficiency of the overall assembly process depends on reversibility, one of whose contributions is to help avoid the consequences of trapped states.
There have been other studies that address the dynamics of capsid assembly. An alternative particle-based, solvent-free MD simulation involved quasi-rigid bodies formed from hard spheres [9]. More highly simplified capsomer representations have been based on spherical particles, instead of extended capsid shapes, with either directional interactions [10] whose range exceeds the particle size, or bonding energies determined by local neighborhood rules [11]; in these simulations the solvent is represented implicitly by stochastic forces. A further alternative involves Monte Carlo simulation of patchy spheres [12], but here the dynamics of assembly are of course absent. At the other extreme on the complexity scale are the folded proteins of real capsomers, although MD simulations employing all-atom models [13] are limited to short trajectories for testing the stability of prebuilt shells. A variety of theoretical methods have also been harnessed to study capsid structure [14, 15, 16, 17, 18], while concentration kinetics have been used for interpreting experiments [4, 19]; discrete particle dynamics are not involved in such approaches.
The present paper extends the analysis of the simulations initially described in Ref. [8]. An alternative approach to probing the evolution of partially assembled structures will be introduced that is able to provide additional details about events occurring along the assembly pathways. The method is based on establishing the identity of each partial assembly at any given stage on the pathway by referring to the complete shell that eventually forms containing a majority of its current member particles. This permits monitoring the evolution of individual clusters of particles as each develops into a closed shell, allowing for addition and loss of members along the pathway.
2 Methodology
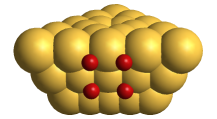
The simulations [8] involve particles whose effective shape is the truncated triangular pyramid shown in Figure 1 designed to self-assemble into icosahedral shells. The larger, slightly overlapping spheres that provide the overall shape occupy multiple planes, while the interaction sites, represented by small spheres for visual convenience, determine the locations and orientations of the the three lateral faces; these are inclined at to the normal. Each lateral face contains four interaction sites that can bond to matching sites on adjacent particles; the reason for multiple sites is that they help maintain correct alignment, a feature that is particularly important for partial assemblies in which particle attachment is incomplete. The particle structure and interactions are based on the model introduced in Ref. [7]. This highly simplified representation can be contrasted with real capsomers [20] that consist of intricately folded proteins whose exposed surfaces form relatively complex landscapes.
The same spheres responsible for the shape of the particle also represent the solvent atoms. All spheres experience a (short-range) soft-sphere repulsion based on the truncated Lennard-Jones potential; the parameters of the potential determine the dimensionless MD length and time units [21] used in the simulations. The attractive force between bond-forming interaction sites is derived from the potential
| (1) |
This interaction is harmonic at distances below and inverse-square above , with range ; its overall strength is governed by the parameter that distinguishes the different runs described below. Particle size exceeds the interaction range, although less so than in real capsomers; the effect is to reduce the attraction between wrongly positioned or oriented particles. Other more general aspects of MD methodology, including the interaction computations and integration of the equations of motion, are described in Ref. [21].
The system consists of 1875 triangular particles, sufficient for producing 93 full shells; there are a total of 125 000 molecules, the majority (98.5%) of which are solvent atoms. The system is confined to a cubic region with periodic boundaries; region size is chosen to yield a mean number density of 0.2. Even though the particle concentration is much higher than in experiment, the solvent presence is adequate to ensure that diffusion minimizes the effects of the ballistic particle motion that would otherwise occur. The run length is time steps, adequate for ensuring that essentially all growth has ceased; 200 steps correspond to one unit of (MD) time. Particle mass is set at 21 times that of the solvent atom (with unit mass); having a much smaller mass ratio than in reality shortens the assembly timescale, making it accessible to MD, but without altering the behaviour in any qualitatively significant manner.
Bond formation is exothermal and leads to a gradual warming of the system; this is suppressed by means of a thermostat that maintains a temperature corresponding to unit mean (translational and rotational) kinetic energy per particle. In the initial state, particles and solvent atoms are positioned on a lattice with random velocities; to avoid possible overlap at the start, particles begin collapsed (with all their component spheres fully overlapped) and expand to their final shape over the initial 5000 steps. None of the additional mechanisms that were introduced to regulate or assist assembly (e.g., damping, or the breakup of partial assemblies) described in Ref. [7] are necessary for the present simulations.
Establishing membership of partial assemblies and algorithmically verifying that shells are correctly assembled requires the capability for identifying bound clusters [21] and checking the connectivity of their bond networks. Cluster membership is a key part of the analysis and, in the present study, interaction sites are regarded as bonded when less than 0.6 () apart; this threshold is empirically chosen to avoid transient apparent bond breakage caused by thermal vibration. The particles themselves are considered bonded if all four site pairs on the adjoining faces are bonded; this state implies almost complete particle alignment, with only the smallest of fluctuations in relative position and orientation.
3 Results
The analysis begins with a comparison of the different growth scenarios observed as the interaction strength parameter is varied; if the range of variation is not too large this is equivalent to examining the temperature dependence of the behaviour. A more detailed discussion of shell growth for the maximal yield case then follows.
Table 1 summarizes the outcome of a series of simulation runs for various values of ; the results are expressed as the mass fraction contained in clusters of different sizes and the residual particles present as monomers. Essentially no change in cluster population occurs towards the end of the runs. At low very little growth occurs due to minimal initiation, but as is increased the balance shifts towards higher yields of complete shells. The maximum yield of 83 shells (out of a possible 93) is achieved at . The yield then falls, since the ability to reach completion is inhibited by excessive early growth, resulting in too many monomers being incorporated into clusters prematurely. Repetition of one of the runs with a different initial state confirmed that, allowing for reasonable fluctuations, the results are reproducible. No oversized (mutant) clusters appeared in these runs, although these would be expected for sufficiently large .
| Cluster mass fraction | ||||||
|---|---|---|---|---|---|---|
| Size: 1 | 2-5 | 6-10 | 11-15 | 16-19 | 20 | |
| 0.11 | 0.7931 | 0.0976 | 0.0181 | 0.0080 | 0.0085 | 0.0747 |
| 0.115 | 0.5153 | 0.0704 | 0.0053 | 0.0256 | 0.0101 | 0.3733 |
| 0.12 | 0.3040 | 0.0314 | 0.0032 | 0.0000 | 0.0000 | 0.6614 |
| 0.125 | 0.1915 | 0.0283 | 0.0032 | 0.0203 | 0.0101 | 0.7466 |
| 0.13 | 0.0709 | 0.0182 | 0.0032 | 0.0224 | 0.0000 | 0.8853 |
| 0.14 | 0.0011 | 0.0000 | 0.0310 | 0.1104 | 0.2282 | 0.6293 |
| 0.15 | 0.0000 | 0.0000 | 0.0192 | 0.3158 | 0.4623 | 0.2027 |
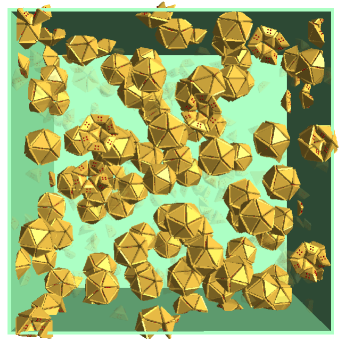
The time development of the cluster size distributions, also expressed in terms of mass fractions, is shown in Figure 2. This is a subset of the results shown in Ref. [8], but the plots are shown from a different perspective to allow the early and intermediate growth features, especially the limited population of small clusters, to be seen more clearly. Figure 3 shows an image of the system once all 83 complete icosahedral shells have formed, with other partial structures shown ghosted. Note that periodic boundaries are applied at the level of individual particles, so that shells that cross the container boundaries appear fragmented; while the solvent particles are not shown here (for clarity, unlike [8]) they actually fill the volume. As described in Ref. [8], closed shells are especially stable, so that even if is subsequently reduced to a value too low for assembly initiation, the shells do not self-destruct, implying hysteresis.

The earlier analysis of shell growth [8] dealt with the accumulated lifetimes of particle clusters of different sizes and the probabilities of events corresponding to size increases and decreases, with the latter tending to dominate. In addition, the energetics of intermediate structures were considered, and a strong preference for maximally bonded (low energy) configurations was observed. The focus was on the mean cluster properties as a function of size, while the assembly history of individual shells was not considered; the following discussion addresses this topic.
The examination of the growth history of individual shells begins by considering the shell membership of the final state of the run. On the basis of this information, as indicated above, it is possible to associate partial assemblies at earlier stages of the run with particular final shells, based on the majority membership of their particles. In general, this accommodates particles both entering and departing the growing cluster. There can be some identity ambiguity, however, for small clusters, where a given final shell can own the majority of particles from more than one such cluster, or the identity of the cluster with the most particles destined for a given shell can change. Such effects will have only minimal influence on the ability to monitor individual cluster histories once a relatively stable core (e.g., a pentagon) has formed, and they become even less of a concern as growth progresses further.
The analysis of the properties of a given cluster considers all its member particles, including those that subsequently detach and do not belong to the majority. Cluster membership is determined from configurations recorded every 2000 time steps (10 MD time units); the limited time resolution can merge or conceal multiple closely spaced events, but in view of the relatively slow particle motion, the majority of individual growth steps can be distinguished. The analysis is based on the high-yield system; in addition to the 83 complete shells, there are 11 incomplete and small clusters that are not considered.
The growth histories of a subset (for clarity) of 30 out of the total of 83 shells are shown in Figure 4. Initial growth to pentamer size, of which 95% are regular pentagons [8], occurs rapidly, but the distribution of subsequent growth rates is broad. While some clusters grow rapidly – some even monotonically – to completion, the paths of others appear to become blocked at certain sizes, repeatedly adding and then promptly losing an additional particle until, eventually, a more lasting growth step is achieved. Size increases greater than unity are apparent. Analysis in greater detail, preferably aided by direct visualization, would be needed to determine if there is any clear distinction, e.g., in terms of detailed morphology, between clusters experiencing fast and slow growth rates, or whether the growth histories are dominated by fluctuations.

Figure 5 shows the fractions of events corresponding to unit size changes in each direction, together with the fractions of all size-changing events irrespective of magnitude, each as a function of cluster size; negative values are used to distinguish the size-decrease events, so it is the distances from the zero line that must be compared. For most cluster sizes, unit size changes account for the majority of events. The important role of reversibility is clear from these measurements, as already noted in Ref. [8], namely that a substantial fraction of events at all sizes (except 5 and 19) involve size decreases, and that there are cluster sizes (e.g., 7, 9, 13, 16) for which the size is more likely to decrease than increase.

Additional details emerge from considering the detailed breakdown of size changes (not shown). From the particular run under examination it is apparent, for example, that the probability of a given size change does not vary monotonically with the magnitude of the change, and changes of size have an increased likelihood: for clusters of size 10, 27% of the events are reductions of -1, 5% -2, 0.4% each -3 and -4, and 4% -5, whereas for size 12, 60% of the events are increases of +1, 4% +2, 1% +3, 0% +4, and 2% +5.
Measurements of cluster lifetime appear in Figure 6. Four different quantities are shown. The accumulated time is the mean total time that clusters exist at a given size (the lifetime distributions themselves are broad). The values can be correlated with the preferred direction of change, and those sizes where increases are more likely to occur than decreases (notably 5, 8, 10, 12, 15, and 19) also have large accumulated times. As a consequence of the strongly reversible nature of cluster growth, the time spent at a particular size is likely to be made up of several distinct intervals. Thus the second quantity shown, referred to as up/down, is the mean uninterrupted time spent at a given size, a value that in most cases is substantially less than the accumulated time; the ratio of these times provides an estimate of the number of visits to the corresponding size, and the value ranges from a low of almost unity at size 19, up to about 15 at size 5. The remaining quantities are breakdowns of the uninterrupted time according to the direction of the next size change; in those cases where a clear difference exists, it is apparent that the time to wait for a size decrease can be considerably less than for a size increase. These results provide additional evidence of the way reversibility dominates the overall growth process.

A further characteristic of the growth history is the influence of the rate of early growth on the speed of subsequent development. The scatter plot shown in Figure 7 provides a simple way to examine this effect. Each data point corresponds to a shell, where the coordinates denote the elapsed time to reach size 10 and the time from size 10 to completion. For those clusters lying above the diagonal the latter time is longer, in some cases by a substantial amount, but for a small proportion of shells it is the first half of the growth process that is the more time consuming.

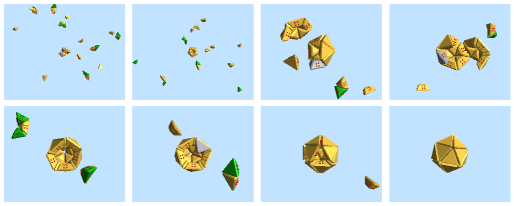
Imagery is especially helpful for exploring those aspects of the growth process that are less readily quantifiable, and offers the possibility of suggesting additional approaches to analyzing the pathway details. Figure 8 shows a series of images covering several stages in the growth of just one of the shells. Only the particles directly involved are included (although some may be too far away to appear in the frames shown). Color coding identifies the eventual disposition of the particles; yellow for particles destined for (or already in) the final shell, gray for particles only temporarily attached to the growing shell, and green for particles that are temporarily attached to yellow particles not yet in the final shell. The particular growth sequence shown here turns out to be an atypical one, based on an analysis of event types, since it includes the joining of two clusters both of which are at least of pentamer size. A pentagon is seen in frame #2, two larger complexes in frame #3 and a cluster merging event in #4, the shell nearing completion in #7, and the final complete shell in #8.
4 Conclusion
The present paper continues the study of the dynamics of simplified viral capsomer models in an explicit atomistic solvent, the eventual goal of which is the modeling of capsid self-assembly. The current focus is on measurements related to the growth histories of individual polyhedral shells. This form of analysis provides an alternative perspective, as well as support for the earlier results that revealed the importance of reversibility. As the results clearly show, microscopic self-assembly, where the dynamics reflect the intrinsic thermal fluctuations prevalent at such scales, is an entirely different class of phenomenon from corresponding processes at macroscopic scales where reversibility is not a consideration.
References
References
- [1] F. H. C. Crick and J. D. Watson. Nature (Lond.), 177:473, 1956.
- [2] D. L. D. Caspar and A. Klug. Cold Spring Harbor Symp. Quant. Biol., 27:1, 1962.
- [3] P. E. Prevelige, D. Thomas, and J. King. Biophys. J., 64:824, 1993.
- [4] A. Zlotnick, J. M. Johnson, P. W. Wingfield, S. J. Stahl, and D. Endres. Biochemistry, 38:14644, 1999.
- [5] G. L. Casini, D. Graham, D. Heine, R. L. Garcea, and D. T. Wu. Virology, 325:320, 2004.
- [6] D. C. Rapaport, J. E. Johnson, and J. Skolnick. Comp. Phys. Comm., 121:231, 1999.
- [7] D. C. Rapaport. Phys. Rev. E, 70:051905, 2004.
- [8] D. C. Rapaport. Phys. Rev. Lett., 101:186101, 2008.
- [9] H. D. Nguyen, V. S. Reddy, and C. L. Brooks III. Nano Letters, 7:338, 2007.
- [10] M. F. Hagan and D. Chandler. Biophys. J., 91:42, 2006.
- [11] R. Schwartz, P. W. Shor, P. E. Prevelige, and B. Berger. Biophys. J., 75:2626, 1998.
- [12] A. W. Wilber, J. P. K. Doye A. A. Louis, E. G. Noya, M. A. Miller, and P. Wong. J. Chem. Phys., 127:085106, 2007.
- [13] P. L. Freddolino, A. S. Arkhipov, S. B. Larson, A. McPherson, and K. Schulten. Structure, 14:437, 2006.
- [14] J. Lidmar, L. Mirny, and D. R. Nelson. Phys. Rev. E, 68:051910, 2003.
- [15] R. Twarock. J. Theor. Biol., 226:477, 2004.
- [16] R. Zandi, D. Reguera, R. F. Bruinsma, W. M. Gelbart, and J. Rudnick. Proc. Natl. Acad. Sci. USA, 101:15556, 2004.
- [17] S. D. Hicks and C. L. Henley. Phys. Rev. E, 74:031912, 2006.
- [18] M. Hemberg, S. N. Yaliraki, and M. Barahona. Biophys. J., 90:3029, 2006.
- [19] P. van der Schoot and R. Zandi. Phys. Biol., 4:296, 2007.
- [20] T. S. Baker, N. H. Olson, and S. D. Fuller. Microbiol. Mol. Biol. Rev., 63:862, 1999.
- [21] D. C. Rapaport. The Art of Molecular Dynamics Simulation. Cambridge University Press, Cambridge, 2nd edition, 2004.