Jagiellonian University
The Faculty of Physics, Astronomy
and Applied Computer Science
Marian Smoluchowski Institute of Physics
Isospin dependence of the meson production in nucleon–nucleon collisions
Joanna Klaja
Ph.D. dissertation prepared at the Nuclear Physics Department
of the Marian Smoluchowski Institute of Physics of the Jagiellonian University
and at the Institute for Nuclear Physics in the Research Centre Jülich
guided by: Prof. Paweł Moskal
Cracow 2009
Abstract
The upper limit of the total cross section for quasi-free
reaction has been determined in the excess energy range near the kinematical threshold.
The measurement has been
carried out at the COSY–11 detection setup using a proton beam and a deuteron cluster target.
The identification of the meson has been performed using the missing mass
technique. The energy dependence of the upper limit of the cross section is extracted with a fixed
proton beam momentum of GeV/c and exploiting the Fermi
momenta of nucleons inside the deuteron. The data cover a range of centre-of-mass
excess energies from 0 to 24 MeV.
The experimentally determined upper limit of the ratio
,
which is smaller than the ratio for the meson, excludes the excitation of the
S11(1535) resonance as a dominant production mechanism of the meson in
nucleon-nucleon collisions.
At the same time, the determined upper limits of R go in the direction
of what one would expect in the glue production and production via mesonic currents.
For quantitative tests of these mechanisms an order of magnitude larger statistics and
a larger energy range would be required. This can be reached with the WASA-at-COSY facility.
Streszczenie
Górna granica całkowitego przekroju czynnego dla kwazi-swobodnej reakcji
została wyznaczona w przyprogowym obszarze energii.
Pomiar został przeprowadzony wykorzystuja̧c układ detekcyjny COSY–11,
wia̧zkȩ protonowa̧ oraz klastrowa̧ tarczȩ deuteronowa̧.
Mezon został zidentyfikowany przy użyciu techniki masy brakuja̧cej.
Zależność górnej granicy całkowitego przekroju czynnego
od energii (funkcjȩ wzbudzenia)
przy stałej wartości pȩdu wia̧zki GeV/c, uzyskano
dziȩki pȩdowi Fermiego nukleonów w deuteronie. Dane zostały zmierzone
w przedziale energii nadprogowej Q od 0 MeV do 24 MeV.
Otrzymana górna granica stosunku R całkowitych przekrojów
czynnych dla reakcji
i , której wartość okazała siȩ
być znacznie mniejsza od analogicznego stosunku zmierzonego dla mezonu , wyklucza
hipotezȩ iż dominuja̧cym procesem w produkcji mezonu jest wzbudzenie
rezonansu S11(1535). Równocześnie, uzyskany wynik nie wyklucza innych
mechanizmów produkcji mezonu takich jak pra̧dy mezonowe czy wzbudzenie gluonów.
Dla przeprowadzenia ilościowych testów możliwych mechanizmów produkcji mezonu
wymagane jest wykonanie eksperymentu z wiȩksza̧ statystyka̧ oraz w
wiȩkszym zakresie energii. Taka̧ możliwość daje układ detekcyjny WASA-at-COSY.
Chapter 1 Introduction
The main aim of the studies presented in this thesis is the determination of
the excitation function of the total cross section for the quasi-free
reaction near the kinematical threshold.
Despite the fact that the and mesons - which are members
of the ground-state pseudoscalar nonet [1] - were discovered many decades ago, they are still
subject of many theoretical and experimantal investigations.
According to the quark model, and mesons can be described as a
mixture of the singlet and octet states of the SU(3) - flavour pseudoscalar meson nonet.
Within the one mixing angle scheme, a small mixing angle () implies
that the masses of and mesons should be almost equal. However, masses
of these mesons differ by about a factor of two. Additionaly, the mass of the
meson does not fit into the SU(3) scheme and it is thought to be induced by the
gluonic component in its wave function. This hypothesis is strenghtened by the decay scheme of
mesons like or since the branching ratios of the decay of
these mesons into some channels involving are significantly higher than the analogous
for especially in processes requiring the involvement of gluons [2, 3, 4].
The properties of the meson should manifest itself in the production mechanism
in the collisions of nucleons.
At present there is not much known about the relative contribution of the possible reaction mechanisms
of the meson production in nucleon-nucleon collisions. It is expected that the
meson can be produced through heavy meson exchange, through the excitation of
an intermediate resonance or via the fusion of virtual mesons [5, 6, 7].
However, it is not possible to judge about the mechanism responsible for the
meson production only from the total cross section of the reaction [8].
Therefore, one has to investigate the production more detailed by e.g. selecting
separate channels in the relevant degrees of freedom like the isospin which means a comparison of both,
proton-proton and proton-neutron scattering. This conclusion motivated our investigations, which are
presented in this thesis.
A comparison of the close-to-threshold total cross section for the production
in both and reactions constitutes a tool not only
to investigate the production of the meson in channels of isospin and
but also may provide insight into the flavour-singlet (perhaps also into gluonium) content of the
meson and the relevance of quark-gluon or hadronic degrees of freedom in the
creation process.
It is also possible that the meson is produced from excited glue
in the interaction region of the colliding nucleons, which couple to the
meson directly via its gluonic component or through its SU(3)-flavour-singlet
admixture [9, 10]. As suggested in reference [11],
production via the colour-singlet object does not depend on the
total isospin of the colliding nucleons and should lead to the same production amplitude
for the in the and reactions.
In case of the meson, the ratio of the total cross sections for the reactions
and was determined to be 6.5
in the excess energy range from MeV to MeV [12],
what suggests the dominance of isovector meson exchange in the production in nucleon-nucleon
collisions.
Since the fractional amounts of different quark flavours of and
mesons are very similar,
in case of the dominant isovector meson exchange – by the analogy to
the meson production – we can expect that the ratio
should also be about 6.5. If however the meson is produced via its
flavour-blind gluonium component from the colour-singlet glue excited
in the interaction region the ratio should approach unity after corrections
for the initial and final state interactions.
The close–to–threshold
excitation function for the reaction has been determined in
previous experiments [13, 14, 15, 16, 17]
and the determination of the total cross section for the meson production in
the proton-neutron interaction constitutes the main motivation for the experiment
which is subject of this thesis.
It is worth to strees that the reaction was never investigated so far.
Such studies are challenging experimentally because the total cross section is expected to be about
a factor of fourty to hundred less than in case of the meson and additionally
(in comparison to the near threshold production) the cross section of the multi-pion
background grows significantly. For some channels (like eg. 3) even by more than a few
orders of magnitude [18]. The measurement of the
reaction is also much more difficult in comparison to the reaction
due to the neutron in the final state and the lack of a pure neutron target.
The experiment described in this thesis has been performed by the COSY–11 collaboration
by means of the COSY–11 facility at the Cooler Synchrotron COSY at the Research Centre Jülich
in Germany.
A quasi-free proton-neutron reaction was induced by a proton beam
impinging on a deuteron target. For the data analysis
the proton from the deuteron is considered as a spectator which does not interact
with the bombarding proton, but escapes untouched and hits the detector
carrying the Fermi momentum possessed at the time of the reaction.
The experiment is based on the registration of all outgoing nucleons
from the reaction.
Protons moving forward are measured in two drift
chambers and scintillator detectors and the neutron is registered
in the neutral particle detector.
Protons considered as a spectator are measured by a dedicated
silicon-pad detector. The total energy available for the quasi-free proton-neutron
reaction can be calculated for each event from the vector of the momenta
of the spectator and beam protons.
The absolute momentum of the neutron is determined from the time-of-flight between
the target and the neutron detector.
Application of the missing mass technique allows to identify events
of the creation of the meson under investigation.
The thesis is divided into ten chapters. The second chapter - following the introduction -
describes briefly the motivation for investigating of the process, in particular
in view of the study of the production mechanism and its structure. In this chapter
the most interesting issues concerning the physics are presented,
and different possible production mechanisms and the predictions of the total cross section
for the reaction are given.
The spectator model is introduced in chapter three, with the description of the quasi-free meson production.
An introduction of the cooler synchrotron COSY and the COSY–11 detection setup is presented in the
fourth chapter.
The fifth chapter is devoted to the calibration of the detectors. A special emphasis is put on the neutral
particle and spectator detectors, two new devices which enabled to measure the quasi-free
reactions.
A detailed description of the data analysis and the result of the identification of the
reaction are presented in chapter six.
The seventh chapter is devoted to the determination of the luminosity based on the quasi-free
proton-proton elastic scattering.
Upper limits of the total cross section as well as of the ratio
= /
are given in chapter eight.
The results of the analysis are compared to theoretical predictions in chapter nine.
The tenth chapter comprises the summary and perspectives. In particular the
possibility to study of the production in the pure isospin 0 channel
via the is discussed.
Chapter 2 Motivation
Understanding of the structure of hadrons is a long standing challenge.
Quantum chromodynamics (QCD) is the well established theory of
strong interactions that describes the underlying forces of coloured
quarks which bind them together to form the colour neutral hadrons
observed in nature. However, due to the increasing coupling constant with
decreasing energy this theory does not allow at present for the exact description
of the hadron structure in the low energy domain. One of the hadrons which is especially intriguing
is the meson.
The meson was first observed in 1964 [19, 20] in the reaction
.
Although the and mesons – the members of the nonet
of the lightest pseudoscalar mesons – have been discovered many decades ago,
they are still subject of considerable interest of theoretical as well as experimental
studies. Particularly in case of the meson, despite more than fourty years
of investigations, its structure and
properties, as well as the production mechanism in collisions involving hadrons
are still not well determined.
According to the quark model, the two physical states of the and mesons are considered as a mixture of the SU(3) pseudoscalar octet () and singlet () states with the pseudoscalar mixing angle :
| (2.1) |
where, following the notation introduced by Gilman and Kaufman [21] and previous work by Rosner [22], the SU(3) pseudoscalar octet state and singlet state are:
| (2.2) |
The value of the mixing angle in the pseudoscalar meson nonet has been discussed many times in the last years [23]. The most up to date value of the mixing angle , averaged over all present experimental results, amounts to [23]. Such small mixing angle implies similar amounts of strange and nonstrange quark content:
| (2.3) |
This suggests that the masses of both and mesons should be almost equal. However, the values of these masses differ by about a factor of two. Concurrently, the mass of the meson does not fit utterly to the SU(3) scheme. More surprisingly, the masses of all the pseudescalar mesons, vector mesons and baryons are well described in terms of the naive quark model.
There are more differences in the physical properties of both mesons. For example: excited states of nucleons exists which decay via the emission of the meson, yet none of the baryon resonances decay via the emission of the meson [1]. Very high apperance in the decays of B and mesons [24, 25, 26] are observed. The branching ratio for is much larger than the one for the corresponding channel [24]. Similar relations are found in the decay of the DS meson where exceeds by a factor of about three [25, 26]. It is worth to stress that the observed branching ratios do not agree with the predictions which ignore the gluonic content of the [2].
There exist also essential differences between the production of and meson in proton-proton collisions close-to-threshold. The total cross section for the reaction is by a factor of fourty smaller than the cross section for the reaction at corresponding values of the excess energy. The shape of the excitation function is also different indicating that the meson interaction with nucleons is much stronger than the -nucleon one [8]. Thus, it is expected that not only physical properties but also the production mechanisms of these mesons should differ from each other.
As was already discussed, the meson with its mass of
is far from being ”light” and its mass is almost three times larger than the value
expected if this meson would be a pure Goldstone boson associated with spontaneously broken
chiral symmetry [27]. The much larger mass of the meson is
thought to be induced by the non-perturbative gluon
dynamics [28, 29, 30]
and the axial anomaly [31].
A gluonic component of the meson is introduced as a flavour singlet
state additionally to the , which couples directly to the glue [32].
Thus, the meson can couple to gluons not only via the
quark and antiquark triangle loop but also directly through its gluonic admixture as shown
in figure 2.1.

Experimental indications exist that the gluonic content of the meson constitutes a significant fraction of the meson wave function. For example, the unexpected large branching ratio measured for the decay of beauty particles, [24], has been interpreted as a possible experimental evidence in this respect [33]. Recenty, the KLOE collaboration has estimated the gluonium fractional content of the meson to be [34] by looking for the radiative decays and .
The most remarkable feature – in the frame of the quark model – distinguishing the meson from all other pseudoscalar and vector ground state mesons, is the fact, that the is predominantly a flavour-singlet combination of quark-antiquark pairs and therefore can mix with purely gluonic states. In any case, if there is a strong coupling of the meson to gluons, quark-gluon degrees of freedom may play a significant role in the production dynamics of this meson, especially close-to-thereshold where the production requires a large momentum transfer between the nucleons and hence can occur only at short distances 0.3 fm in the nucleon-nucleon collision. The role of gluonic degrees of freedom in the –nucleon system can be investigated for example through the flavour-singlet Goldberger-Treiman relation [35]:
| (2.4) |
which relates the nucleon-nucleon- coupling constant with the flavour-singlet axial constant . The describes the coupling of the nucleon to the gluons arising from contributions violating the Okubo-Zweig-Iizuka rule [36, 37, 38]. The coupling constatnt is in part related to the contribution of gluons to the proton spin [39]. As shown by the measurements of the EMC collaboration omission of the spin carried by gluons in polarized protons leads to the so-called ”spin crisis” [40]. A small value of 0.20-0.35 extracted from measurements of the deep inelastic muon-proton scattering [40] and a large mass of the meson would be explained by the positive 2.45 value. However, neither nor have been measured directly in experiments so far. There is only an estimation of the upper limit of 2.5 derived from the close-to-threshold total cross section for the reaction [16]. From this point of view an investigation of processes where the meson is produced directly off a nucleon, such as the reaction may be considered as a tool for supplying the information about the above coupling constants and the role of the gluons in dynamical chiral symmetry breaking in low-energy QCD.
As suggested by Bass [9, 10] the meson can be created via
a contact interaction from the glue which is excited in the interaction region of the
colliding nucleons. A gluon-induced contact interaction contributing to the close-to-threshold
cross section is derived in the frame of the U(1)-anomaly
extended chiral Lagrangian. The physical interpretation of the contact interaction is a very
short distance (0.2 fm) interaction where created gluons could couple
to the directly via its gluonic component or through its
flavour-singlet admixture . This gluonic contribution to the total cross section
of the reaction is additional to the production mechanism associated with
meson exchange [5, 41, 6, 7].
As proposed by Bass in reference [11],
the meson production via the colour-singlet object does not depend on the
total isospin of the colliding nucleons (see figure 2.2)
and should lead to the same amplitudes of the production
for the and reactions. This observation
motivated the studies of the isospin dependence of the meson production
in the nucleon–nucleon collisions and in particular a measurement of the
reaction presented in this thesis.
Treating proton and neutron as different states of the nucleon
distinguished only by the isospin projection, for the proton
and for the neutron, we may classify the reactions
according to the total isospin of the nucleon pair in the initial and final state.
A total isospin of two nucleons equals 1 for proton-proton and
neutron-neutron pairs, and may acquire the value 1 or 0 for the
neutron-proton system. Since the meson is isoscalar, there are only two pertinent
transitions for the reaction, provided that it occurs via an isospin
conserving interaction. Thus, it is sufficient to measure two reaction channels for
an unambiguous determination of the isospin 0 and 1 cross sections [8].
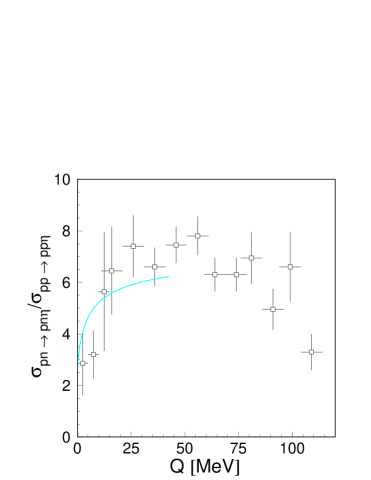
The isospin dependence has been already established in case of the meson production, and the total cross sections in both the proton-proton as well as the proton-neutron reactions have been measured. In case of the meson, the ratio of the total cross sections for the reactions and was determined to be 6.5 [12]. At the lower values of , close-to-threshold, the ratio falls down and amounts to 3 [42, 43], (see figure 2.3). As explained by Wilkin [44, 45], to a large extent this behaviour may plausibly be assigned to the difference in the strength of the proton-proton and proton-neutron final state interaction.
Since,
we have
where I denotes the total isospin in the initial and final state of the nucleon pair. The production of the meson in this reaction with total isospin 0 exceeds the production with isospin 1 by a factor of 12. This large difference of the total cross sections suggests the dominance of isovector mesons exchange in the creation of the meson in collisions of nucleons. A recent experimental study of the analysing power of the reaction [46] indicates that the meson exchange between the colliding nucleons may be predominant.
Since the amount of different quark flavours in and mesons wave function is similar, in case of the dominant isovector meson exchange – by the analogy to the meson production – we can expect that the ratio should be large. If however the meson is produced via its flavour-blind gluonium component from the colour-singlet glue excited in the interaction region the ratio should approach unity after corrections for the initial and final state interactions. The close–to–threshold excitation function for the reaction has already been established [13, 14, 15, 16, 17] and the determination of the total cross section for the meson production in the proton-neutron interaction motivated the work presented in this dissertation. Recently Bass and Thomas [47] argued that the strength of the interaction of and mesons with nucleons is sensitive to the singlet-flavour component, and hence to the glue content in these mesons. This makes a connection in our endeavour to investigate the structure, the production dynamics, and the interaction of the and mesons with nucleons [48].
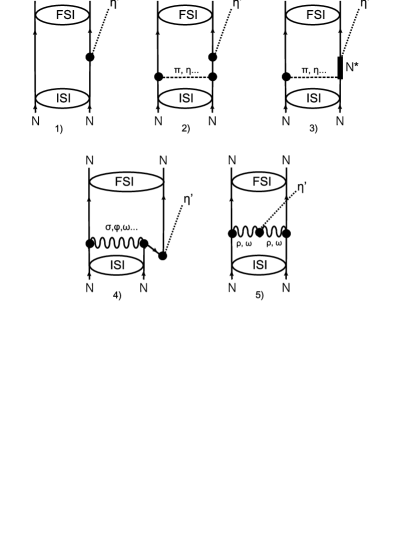
Certainly, other production mechanisms which are shown in figure 2.4,
such as meson exchange and nucleon resonance
currents, must be taken into account before a role of gluons in the NN
vertex is explored.
It is expected that the meson can be produced through
-bremsstrahlung (nucleonic current), ”rescattering” term (nucleonic
currents), excitation of an intermediate resonance (nucleon
resonance current), heavy meson exchange or through fusion of the virtual mesons
(mesonic curent).
The two latter mechanisms, which are of short-range, are expected to contribute
even more significantly due to the large four-momentum transfer needed between nucleons
to create the meson.
Theoretical studies of the meson production mechanism have shown
that the existing data could be explained either by mesonic and nucleonic currents
or by a dominance of two new resonances S11(1897) and P11(1986) [5].
Moreover an extended study [41] motivated by the updated data of the
and reactions indicated contributions from
resonances S11(1650) and P11(1870). However, it is premature to identify these states,
as these authors pointed out.
Recently, Cao and Lee [7] have studied the near-threshold
production mechanism in nucleon-nucleon and -nucleon collisions under the assumption
that the resonance S11(1535) is predominant. In an effective
Lagrangian approach which gives a resonable description to the
and reactions, it was found that the t-channel exchange
makes the dominant contribution to the process, and a value
of 6.5 for the ratio of to
was predicted.
On the contrary, other authors [6] reproduced the magnitude of the total
cross section for the reaction including meson currents and
nucleon currents with the resonances S11(1650), P11(1710) and P13(1720).
A resonable agreement with the data is achieved by the contribution of the
meson conversion currents indicating other terms to be less significant. In the frame of this model the
R ratio is predicted to be 1.5.
The above considerations shows that our understanding of the meson
production mechanism is still unsatisfactory. Therefore it is important to test the discussed
mechanisms by confronting them with the experimental results on the isospin dependence of the
meson production.
Chapter 3 Spectator model
The absence of pure neutron targets makes measurements of mesons
production in proton-neutron interactions very difficult, especially
very close-to-thereshold where the total cross section changes rapidly
with the excess energy [49]. Therefore, to measure the
reaction we used a deuteron target as an alternative.
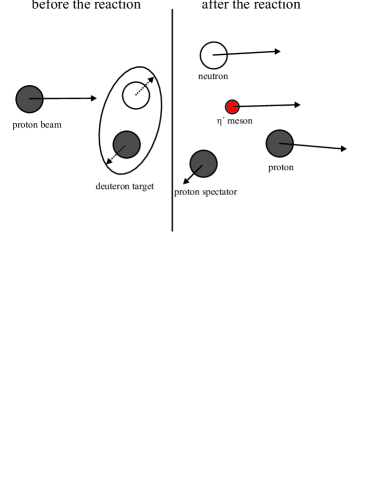
Figure 3.1 shows schematically the quasi-free reaction. In the experiment described in this thesis, a cooled proton beam with a momentum of GeV/c and a deuteron cluster beam target as a source for neutrons have been used. The applied technique is similar to investigations of the and production in proton-neutron collisions carried out by the WASA/PROMICE collaboration at the CELSIUS accelerator in Uppsala [12, 50, 51, 52].

The main difficulty, when using deuterons as a neutron target is the fact that nucleons inside the deuteron are not at rest but are moving with the Fermi momentum. Therefore, in order to achieve the required resolution for the determination of the excess energy in the proton-neutron reaction it is mandatory to determine the neutron momentum inside the deuteron for each event. The momentum of the neutron is derived indirectly based on the measurement of the proton Fermi momentum. For the analysis a spectator model is applied. Due to the relatively small binding energy of a deuteron MeV which is more than three orders of magnitude smaller compared to the kinetic energy of the bombarding proton MeV, the neutron is considered as a free particle in the sense that the matrix element for the quasi-free meson production on a bound neutron is equal to the one in free production from an unbound neutron. The second assumption of the spectator model used for the evaluation of the reaction is that the proton from the deuteron target does not take part in the reaction and that it is on its mass shell when the beam hits the target. The validity of these assumptions was proven by measurements performed at CELSIUS [50, 51, 52], TRIUMF [58] and COSY-TOF [59]. The comparison of the quasi-free and free production cross sections for the reaction done by the WASA/PROMICE collaboration has shown that there is no difference between the total cross section for the free and quasi-free process within the statistical errors. The excitation function for the reaction measured with free and quasi-free proton-proton scattering is presented in figure 3.2. Similarly, investigations of pion production carried out at the TRIUMF facility have shown that the experimental spectator momentum distribution is consistent with expectations based upon the hypotheses of the spectator model. It was also shown, that the magnitude of the differential cross sections for the quasi-free reaction agrees on the few percent level with the free differential cross sections. Recently, the validity of the spectator model was proven also by the COSY-TOF collaboration. The shape of the angular distribution for the quasi-free and reactions as well as the form of the momentum distribution of the spectator have been measured. The experimental data were consistent with calculations based upon the spectator model with an accuracy better than 4% [59].


In case of the quasi-free
reaction the difference between the on-shell
and the off-shell total cross section should be even smaller than in case of
the quasi-free meson production since the total energy of colliding
nucleons is much larger for near threshold creation than for
the creation of the meson,
whereas the main difference between the on-shell and off-shell neutron mass
remains the same in both cases.
The momentum and kinetic energy distribution of a spectator proton is shown in
figure 3.3. The momentum distribution is peaked at a value of 40 MeV/c
but due to the long tail the mean momentum is approximately equal to 100 MeV/c.
Since the neutron momentum changes from event to event, both the total energy in the
centre-of-mass system and the excess energy vary also and
have to be determined for each event.
Figure 3.4 (left) presents the distribution of the excess energy
for the system originating from the
reaction calculated with a proton beam momentum of GeV/c
and a neutron target momentum smeared out according to the Fermi distribution.
Here denotes the spectator proton.
The broad excess energy distribution enables
to scan a large range of the excess energy with a single beam momentum setting but
in parallel requires the reconstruction of the centre-of-mass energy for each event.
This can be done only if the four-momentum of target neutrons is known, what can be done
by measuring the four-momentum vector of the spectator proton, or by measuring all
four-momentum vectors of all outgoing nucleons and mesons (proton, neutron and ).
The first possibility requires the detection of the spectator proton in a suitable
detection unit as it was realized in the COSY–11 experimental facility.
For more details concerning the spectator detector
and calibration method see chapters 4. and 5.
As already mentioned, in the frame of the spectator model the proton in the deuteron is assumed to be an
untouched particle staying on-shell throughout the reaction. Thus, by measuring the spectator
proton momentum one gets the target neutron momentum which is
equal to . The total energy of on-shell proton is equal to:
| (3.1) |
and hence the total energy of the off-shell neutron can be calculated as:
| (3.2) |
where and denote the free proton and deuteron masses, respectively.
Even in case when the proton is at rest the neutron is off mass shell
due to the binding energy of the deuteron.

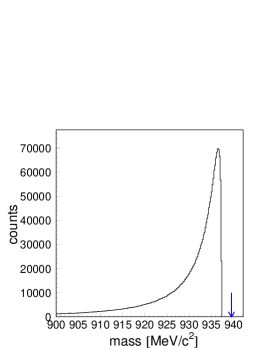
Figure 3.4 (right) shows the distribution of the mass of the interacting neutron as calculated according to the relation:
| (3.3) |
where is the total energy of the off-shell neutron. As it is seen, the maximum of this distribution differs only by 2.2 MeV from the free neutron mass MeV/c2).
The quasi-free meson production is disturbed by some nuclear effects, namely a shadow effect and a reabsorption of the produced meson by the spectator proton but they are rather of minor importance. In the first case the reduction of the beam flux originating in neutron shielding by a spectator proton decreases the total cross section by about in case of meson production [61]. The same effect is expected for the meson production. The absorption of the meson reduces the total cross section by [61] depending on the energy of the meson which was produced. In case of a quasi-free meson production this effect is much smaller since the proton- interaction is much weaker than the proton- one [8].
Chapter 4 Experimental tools
The experiment described in this thesis has been performed using the COSY–11 facility [62, 63, 64] an internal magnetic spectrometer installed at the cooler synchrotron and storage ring COSY [65] in Jülich, Germany.
4.1 Cooler Synchrotron COSY
The Cooler Synchrotron COSY stores and accelerates unpolarized as well as polarized proton and deuteron beams in the momentum range between 0.6 GeV/c and 3.7 GeV/c.
Cooling with electrons in the lower momentum range and stochastic
cooling in the upper momentum regime is used to decrease the spread of the
beam momentum and its emittance. Proton and deuteron beams
are supplied to experiments with the circulating beam – ”internal experiments”
or for experiments with the extracted beam – ”external experiments”.
In case of internal experiments, at the highest beam momentum a few
times accelerated particles
pass through the target times per second.
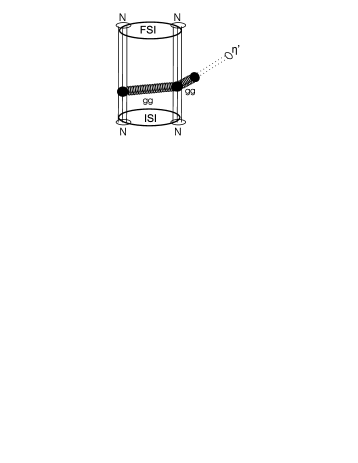
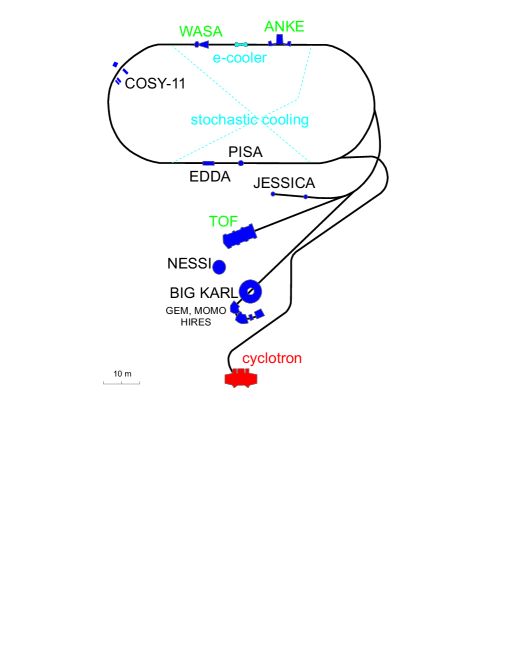
The COSY synchrotron – which is schematically depicted in figure 4.1 –
has a 180 m circumference including two half-circle sections connected by two 40 m
straight sections.
The experiment presented in this thesis is the first ever attempt to measure
the cross section of the
reaction. It has been carried out at the COSY-11 detection setup using a deuteron
cluster target and a stochastically cooled proton beam with a momentum of 3.35 GeV/c.
The experiment was performed in August 2004 and the data have been collected
for 24 days.
It was based on the measurement of four-momenta of the outgoing
nucleons, whereas an unregistered short lived meson was identified via
the missing mass technique.
4.2 COSY–11 facility
The COSY–11 detector system is schematically depicted in figure 4.2. The detectors used for the registration of the spectator proton and the neutron (silicon pad detector and neutral particle detector, recpectively) will be described more detailed in the following sections. The details of the other detector components used in this experiment and the method of measurement can be found in references [62, 64, 77, 78]. Therefore, here the used experimental technique will be presented only briefly.
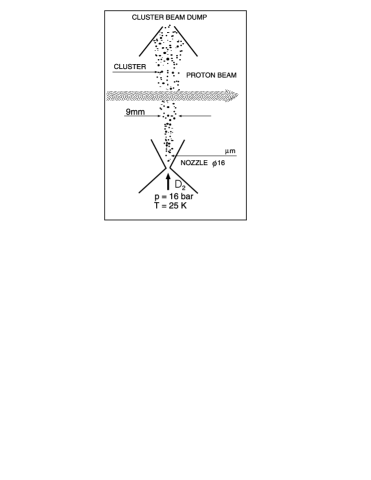
The COSY–11 cluster target, shown in figure 4.3 is installed in front of one of the COSY dipole magnets. It can provide streams of clusters of hydrogen () as well as of deuteron (). The charged products of the measured reactions are bent in the magnetic field of the dipole magnet and leave the vacuum chamber through a thin exit foil, whereas the beam — due to the much larger momentum — remains on its orbit inside the ring. The charged ejectiles are detected in the drift chambers (D1, D2) [62, 64] and the scintillator hodoscopes (S1, S3) [62, 77, 78]. Neutrons and gamma quanta are registered in the neutral particle detector [79]. The veto detector is used in order to separate neutrons and gamma quanta from charged particles. An array of silicon pad detectors (spectator detector) [80] is used for the registration of the spectator protons.
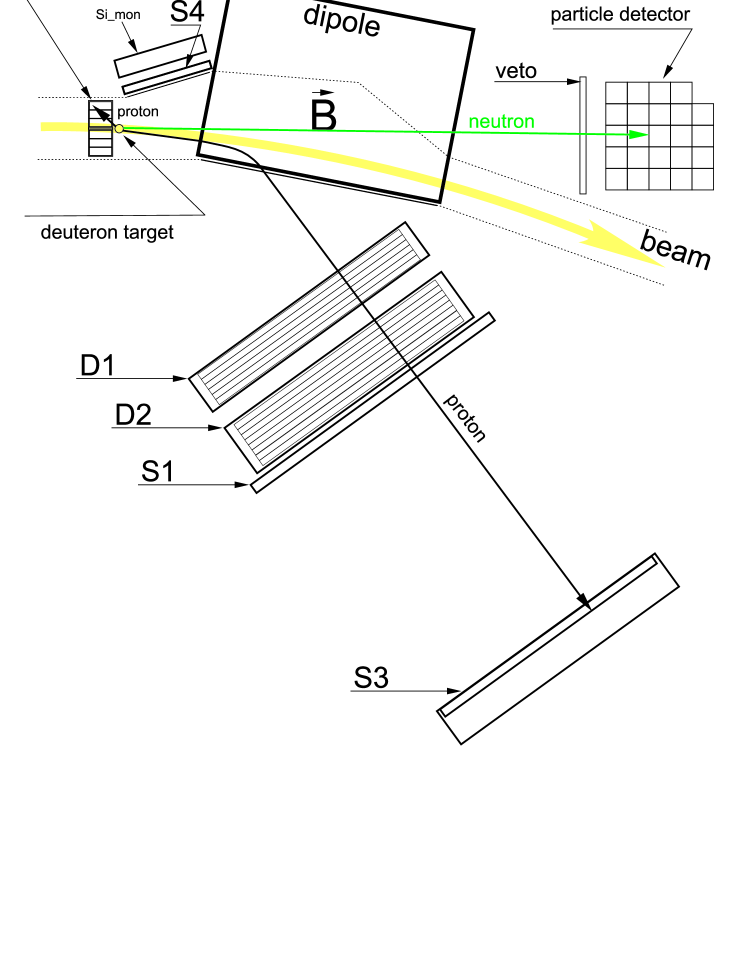
Protons scattered elastically under large angles are measured in the scintillator detector S4 and in another position sensitive silicon pad detector positioned closely behind the S4 counter.
4.3 Measurement method – general remarks
The main goal of this experiment is the determination of the total cross section for the reaction in the excess energy range between 0 and 24 MeV. In order to calculate the total cross section, given in general by the formula:
| (4.1) |
one needs to determine: the efficiency of the COSY–11 detection system, the luminosity integrated over the time of the experiment, the excess energy and the number of meson events registered for a given excess energy. In the following the experimental conditions, technique of measurement and method of the , , , determination will be presented.
Events corresponding to the production of at least one charged particle in coincidence with a neutron (or gamma quantum) were stored on the tape for later analysis. Conditions of the main trigger can be written symbolically as:
which requires that at least a coincidence of one hit (multiplicity ) in the neutral particle detector
(in upper and lower photomultiplier), in the S1 detector, and in
the scintillator wall S3 was demanded.
The S1 region was restricted to 5 modules (from 2nd to 6th) in which the proton signal from
the reaction was expected.
During the experiment an additional trigger referred to
as was set up for the registration of the quasi-free p-p elastic scattering.
Events which gave a signal in the S1 detector in coincidence with the S4
detector (see figure 4.2) were accepted as a quasi-free proton-proton
scattering or elastic proton-deuteron scattering.
For each charged particle, which gave signals in the drift chambers, the momentum vector
at the reaction point can be determined. For the analysis of the
reaction, first the trajectories of the outgoing protons are reconstructed [81]
based on signals in the drift chambers D1
and D2 – and then knowing the magnetic field of the dipole magnet – its momentum vector is
determined. Independently, the velocity of the particle is derived
based on the time–of–flight measured between the S1 and the S3 detectors.
Knowing the velocity and the momentum of the particle, its mass can be
calculated, and hence the particle can be identified. After the particle
identification the time of the reaction at the target is obtained from the
known trajectory, velocity, and the time measured by the S1 detector.
The neutral particle detector delivers the information about the time at which the registered neutron or gamma quantum induced a hadronic or electromagnetic reaction in the detector volume, respectively. The time of the reaction combined with this information allows to calculate the time–of–flight (TOFN) of the neutron (or gamma) between the target and the neutral particle detector, and — in case of neutrons — to determine the absolute value of the momentum (p), expressed as:
| (4.2) |
where denotes the mass of the neutron, and stands for the distance between the target and the neutral particle detector. The direction of the neutron momentum vector is deduced from the angle defined by the centre of the hit module inside the neutral particle detector.
Similarly, to determine the direction of the momentum vector of the spectator proton, the angle defined by the centre of the hit segment inside the spectator detector is used. In order to calculate the four–momentum of the spectator proton its kinetic energy is directly measured as the energy loss in the silicon detector. Knowing the proton kinetic energy one can calculate its momentum using the relationship:
| (4.3) |
where denotes the proton mass.
To evaluate the luminosity, the quasi-elastic proton-proton scattering is measured during the data taking of the reaction, with one proton detected in the drift chambers and the scintillator hodoscopes and the other proton registered in the silicon detector . The elastically scattered protons can be well separated from the multi-particle reactions, due to the two body kinematics.
Based on Monte Carlo studies, the beam momentum value, the position of the spectator detector and the configuration of the neutral particle detector have been optimized before the experiment in order to maximize the detection efficiency, the resolution of the excess energy determination and in order to achieve a relatively high missing mass resolution [82].
In the next two chapters the method of the detector calibration and evaluation of the data, namely determination of the excess energy , number of mesons created in proton–neutron collisions, the luminosity L and the detection efficiency will be presented.
Chapter 5 Calibration of the detectors
5.1 Time-space calibration of the drift chambers
In this section we give an account on the time-space calibration
of the drift chambers.
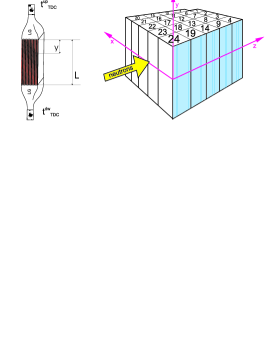
The drift chamber D1 (see figure 4.2) contains six
detection planes, two planes have vertical wires and four have inclined
wires. The second drift chamber (D2) contains two more planes with vertical wires
(altogether eight). The wires in consecutive pairs of planes
are shifted by half of the cell width in order to resolve the left-right
position ambiguity with respect to the sense wire. Both chambers were operating
with 50–50 argon–ethane gas mixture at atmospheric pressure.

When a charged particle passes through the drift cell it
invokes an ionization of the gas mixture. The positively charged ions
drift to the cathode wires with negative potential,
whereas the free electrons drift towards the sense wire with positive potential.
The drift time of electrons is measured
and hence the distance between the particles trajectory and the sense wire
can be determined. A relation between the
drift time and the distance from a sense wire is established from
experimental data.
Due to variations of the drift velocity caused by
changes of the pressure, temperature and humidity
of the air inside the COSY tunnel,
the drift chamber calibration has to be performed for time intervals
not longer than few hours. The calibration is derived in an iterative way.
First, having an approximate time-space function x(t) for a given sample
of measured events111In case of this experiment the first approximation
was taken from the previous COSY–11 runs. It is worth noting that in general
an approximate drift time to drift distance relation can be determined by integration
of the drift time spectra as provided by the uniform irradiation method [83].,
a distance of particle
trajectory from a sense wire is calculated, and a straight line is fitted to the
obtained points. Next, the deviation between
the fitted and measured distances of the particle’s trajectory
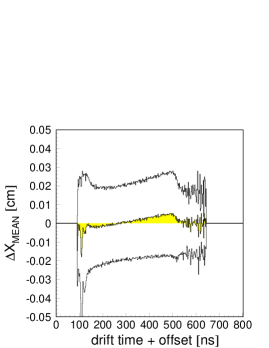
to the wire is calculated. An example of a mean value of
as a function of the drift time
is shown in figure 5.1 (left). The shaded area represents the mean
values of . Upper and lower histograms indicate a band
of one standard deviation of the distribution. Afterwards
the relation between the drift time and distance
from the wire is corrected by the determined mean value of .
The procedure is repeated until corrections
become negligible compared with expected position resolution of the chambers.
Figure 5.1 (right) shows the time-space calibration
of an arbitrarily chosen plane of the D1 chamber. The nearly linear dependence is
seen for the drift time range from 100 ns up to 500 ns.
5.2 Time calibration of the S1 and S3 hodoscopes
In this section a method of the time–of–flight calibration is presented.
The time–of–flight measurement on the known distance between the S1 and the S3 hodoscopes enables to calculate the velocity of the particle which crosses both detectors. In order to calculate the time–of–flight, relative time offsets between each detection unit of the S1 and S3 detectors have to be established.
The S1 detector (see figure 4.2) is built out of sixteen
scintillation modules with dimensions 45 cm 10 cm 0.4 cm.
The modules are arranged
vertically with a 1 mm overlap and are read out at both ends by pairs of photomultipliers.
The start time for the time–of–flight measurement is calculated as the mean value of times
measured by the upper and lower photomultiplier of the S1 detector module.
The measured TDC values for a single S1 module may be expressed as:
| (5.1) |
The is the real time when a particle crosses the detector, denotes the distance between the upper edge of the active part of the detector and the hit position, and stand for the time walk effect, and , comprise all delays due to the utilized electronic circuits. The common start signal for all TDC modules is denoted by the and it is the same for S1 and for S3 detector. Thus the mean value of the time measured by the S1 module is given by:
| (5.2) |
where comprises all constatnt terms from eq. 5.1.
The S3 hodoscope is built out of a non-segmented scintillator wall with the dimensions
220 cm 100 cm 5 cm viewed by a matrix of 217 photomultipliers.
The stop signal for the time–of–flight measurement is calculated as the average
of times obtained from all the photomultipliers that produced a signal.
The TDC value for a single photomultiplier is expressed similarly as in the case
of the S1 detector:
| (5.3) |
where denotes the real time when a particle crosses the detector and the is the time needed by the light signal to pass from the scintillation origin down to the photomultiplier photocathodes. Applaying equations 5.1 and 5.3 one can calculate the time–of–flight between the S1 and S3 hodoscopes as:
| (5.4) |
Since in both equations (5.1, 5.3) the time is the same, the is independent of the triggering time. The as well as and may be calculated based on the known calibration parameters and amplitude of the signals [77]. Thus the only unknown quantities in equation 5.4 for are the time offsets for the individual photomultipliers of S3 detector () and time offsets for a single module of S1 detector ().
In order to establish these effects we have selected events with only one
track reconstructed in the drift chambers, with signals in only one S1 module
and signals in the S3 hodoscope for those photomultipiers which are at the position expected
from the extrapolation of the particle trajectory determined in the drift chambers.
In the first approximation the relative offsets of the S1 modules were established comparing
the time between neighbouring modules for signals from particles which
crossed the detector through the overlapping regions.
Assuming, that the time offsets for the S1 detector are approximately
correct, we have established the time offsets for each photomultiplier of S3 detector,
by comparing the time–of–flight values calculated from the time signals in the S1 and S3 detectors
(see eq. 5.4) with the time–of–flight determined from the reconstructed momenta
of the particles in the magnetic field. Having the time offsets for the S3 hodoscope adjusted, we have
again re-calculated the offsets for the S1 detector in the same way as it was done for the
S3 detector. This procedure was repeated a few times until the
corrections of the offsets became negligible.

Figure 5.2 presents the distribution of difference between the time–of–flight () on the S1-S3 distance determined from signals registered in S1 and S3 scintillators and the time–of–flight calculated from the reconstructed momenta of particles for photomultipliers no. 130–149 as obtained after the third iteration.
5.3 The neutral particle detector
The installation of the neutral particle detector at the COSY–11
facility enabled to study reactions with neutrons in the exit channel.
It allows, for example to investigate quasi-free meson production
in proton-neutron interactions or charged hyperon production like
via the reaction [84, 85].
This detector [86] delivers the time at which
neutron or gamma quantum induces a hadronic or electromagnetic reaction inside the
detector volume, respectively. This information combined with the time of the reaction
at target place — deduced using other detectors — enables to calculate
the time–of–flight between the target and the neutral particle detector
and to determine the absolute momentum of the registered neutrons.
In this section a method of time calibration will be demonstrated
and results achieved by its application will be presented and
discussed.
Information about the deposited energy is not used in the data analysis because the smearing of the neutron energy determined by this manner is by more than an order of magnitude larger than established from the time–of–flight method. The experimental precision of the missing mass determination of the reaction [87, 88] strongly relies on the accuracy of the reconstruction of the momentum of neutrons, therefore the time calibration of the neutral particle detector has to be done with high precision.
Previously, the neutron detector consisted of 12 detection units [89],
with light guides and photomultipliers mounted on one side of the module.
In order to improve the time resolution of the detector additional light guides
and photomulipliers were installed, such that the light signals from the scintillation layers
are read out at both sides of the module. The neutral particle detector
used for the experiment described in this thesis consists of 24 modules,
as shown in figure 5.3.
Each module is built out of eleven plates of
scintillator material with dimensions 240 mm 90 mm 4 mm interlaced with
eleven plates of lead with the same dimensions. The scintillators are connected
at both ends of a module to light guides — made of plexiglass — whose
shape changes from rectangular to cylindrical, in order to accumulate the
produced light on the circular photocathode of a photomultiplier. There
the light pulse is converted into an electrical signal, which is provided to
the ADC and to the TDC converters.
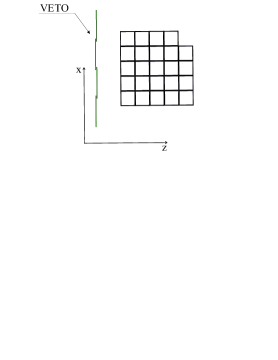
The neutron detector is positioned at a distance
of 7.36 m from the target in the configuration schematically depicted
in figure 5.3. The detector covers the laboratory
angular range of in x and in y direction.
This configuration and the distance to the target has been chosen to optimize the efficiency for the reconstruction of the reaction [82]. The choice was based on results from Monte Carlo studies of the acceptance and efficiency as a function of the distance and configuration [82]. The choice for the thickness of the scintillator plates was also based on the simulation studies [90].

As can be deduced from figure 5.4 the maximum efficiency, for a given total thickness, for the registration of neutrons — in the kinetic energy range of interest for the reaction ( 300 MeV – 700 MeV) — would be achieved for a homogeneous mixture of lead and scintillator. However, in order to optimize the efficiency and the cost of the detector the plate thickness has been chosen to be 4 mm. This results in an efficiency which is only of few per cent smaller than the maximum possible. The functioning of the detector was already tested in previous experiments [42, 79, 85].
5.3.1 Time signals from a single detection unit
A schematic view of a single detection module of the COSY–11 neutral particle detector is shown in figure 5.3 (left). The time () from a single module is calculated as an average time measured by the upper and lower photomultiplier. Namely:
| (5.5) |
where denotes the difference between the time of signals arrival from the photomultiplier and from the trigger unit to the Time–to–Digital–Converter (TDC). This can be expressed as222Here we omit the time walk effect which will be discussed later in section 5.3.3:
| (5.6) |
| (5.7) |
where stands for the length of a single module, denotes the distance between the upper edge of the active part of the detector and the point at which a neutron induced the hadronic reaction, is the time at which the scintillator light was produced, represents the time at which the trigger signal arrives at the TDC converter, and denotes the velocity of the light signal propagation inside the scintillator plates. The parameters offsetup and offsetdw denote the time of propagation of signals from the upper and lower edge of the scintillator to the TDC unit.
Applying equations 5.5, 5.6 and 5.7 one can calculate a relation between and :
| (5.8) |
where the value of ”offset” comprises all delays due to the utilized electronic circuits, and it needs to be established separately for each segment. It is worth noting, that due to the readout at both ends of the detector the is independent of the hit position along the module, as it can be deduced from equation 5.8.
5.3.2 Relative timing between modules
Instead of determining the values of ”offsets” from equation 5.8
for each detection unit separately, the relative timing between modules will
be first established and then the general time offset connecting the timing
of all segments with the S1 detector will be found.
In order to establish relative time offsets for all
single detection units, distributions of time differences
between neighbouring modules were derived from experimental data
and compared with simulated distributions.
A time difference measured between two modules can be expressed as:
| (5.9) |
where and stand for the time registered by the and module, respectively. Examples of spectra determined before the calibration are presented in figure 5.5.


One can note that the peaks are shifted from the zero value and additionally the distributions contain tails. The tails reflect the velocity distribution of the secondary particles. In order to determine reference spectra corresponding time differences between the modules were simulated using the GEANT–3 code. The result of the simulation is shown in figure 5.6. To produce these spectra the quasi–free reaction has been simulated.


The values of the relative time offsets were determined using a dedicated program written in Fortran 90 [91, 92]. It adjusts values of offsets such that the time difference obtained from the experimental data and from simulations equals to each other for each pair of detection units. Furthermore, from the width of the spectra one can obtain the information about the time resolution of a single module, which was extracted to be 0.4 ns [91].


5.3.3 General time offset and the time walk correction
The momenta of neutrons are determined on the basis of the time between the reaction and the hit time in the neutral particle detector. The time of the reaction can be deduced from the time when the exit proton from the reaction crosses the S1 detector (see fig. 4.2) because the trajectory and the velocity of this proton can be reconstructed. Therefore, to perform the calculation of the time–of–flight between the target and the neutral particle detector, a general time offset of this detector with respect to the S1 counter has to be established. This can be done by measuring the gamma quanta for which the velocity is constant.
The time–of–flight between the target and the neutral particle detector is calculated as the difference between the time of the module in the neutral particle detector which fired as the first one () and the time of the reaction in the target :
| (5.10) |
The time of the reaction is obtained from backtracking the protons through the known magnetic field and the time measured by the S1 detector (). Thus can be expressed as:
| (5.11) |
where denotes the time–of–flight between the target and the S1 counter, denotes all delays of signals from the S1 detector, and analogically as for equation 5.8 the and denote the time at which the scintillator light in the S1 detector was produced and the averaged time registered by the TDC unit (see eq. 5.5), respectively. Since the time in the neutron detector reads:
| (5.12) |
we have:
| (5.13) |
By the general time offset of the neutron detector with respect to S1 is denoted. In order to determine the value of the reaction is used, where is measured by the neutral particle detector and for which the between the target and the neutral particle detector is known. and represent any two positively charged particles (. Events corresponding to the reaction have been identified by measuring the outgoing charged as well as neutral ejectiles. Positively charged particles (pions, protons and deuterons) were detected by means of the drift chambers (D1, D2) and scintillator hodoscopes (S1, S3). Gamma quanta originated predominately from the meson decay are registered in the neutral particle detector. Knowing the time–of–flight for gamma quanta on the distance between the target and the neutral particle detector the general time offset was determined by comparing the measured time with the nominal value of . The measured time–of–flight spectrum is shown in figure 5.8. should be equal to 24.5 ns. As can be inspected from the figure 5.8, the time depends on the amplitude. This phenomenon is occuring for measurements using a leading-edge discriminator and is referred to as the time-walk effect [93]. In the case of a constant threshold value, two signals of different pulse hights but exactly coincident in time may trigger the discriminator at different times. An offline correction can be applied to minimize this effect assuming a linear dependence between the time walk and the inverse of the square root of the signal charge [94]. The function used for offline time-walk correction was
| (5.14) |
where and are corrected and measured times, and and are coefficients determined from the data, and and denote the charge of the signal measured at the upper and the lower end of the detection module.
Figure 5.8 shows the dependence of the time–of–flight for neutral particles as a function of values of ADC signals in the neutral particle detector. The time–of–flight shown in the figure was measured between the target and the neutral particle detector before (left) and after (right) the time walk correction. The spectrum was obtained under the condition that in coincidence with a signal in the neutral particle two charged particles were registered in the drift chambers. The time in the neutral particle detector was corrected in such a way as if the interaction point of particles was in the first row of the detector modules only. A clear signal originating from the gamma rays is seen over a broad enhancement from neutrons. This histogram shows that a discrimination between the signals originating from neutrons and gamma quanta can be done by a cut on the time of flight. For the gamma quanta the time–of–flight value is independent of their energy. This fact was used to determine the and coefficients. The right panel of figure 5.8 presents the analogous distribution for which a corrected time was used for the time–of–flight calculation instead of the .
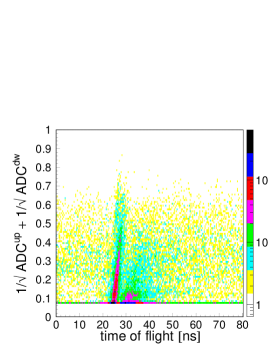
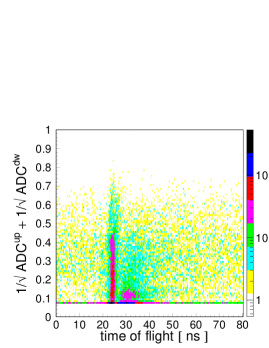
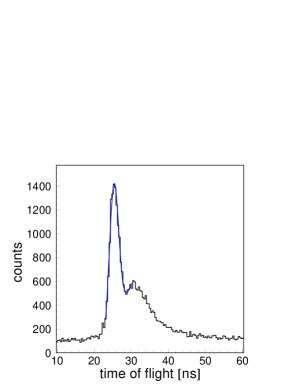
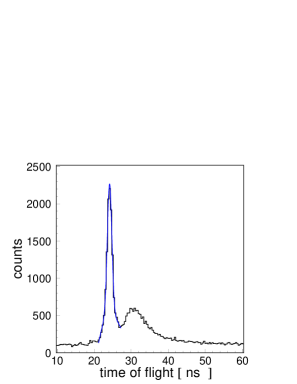
Figure 5.9 presents the projection of the distributions from figure 5.8 on the time–of–flight axis. Both distributions of the time–of–flight were fitted by a Gaussian function in the range where the clear peak originating from gamma quanta appears. The area around the peak was fitted by a second order polynomial. The left panel of figure 5.9 presents the distribution of the time–of–flight before the time walk correction, and the fit was resulting in a time–of–flight resolution of ns. The time–of–flight for which the corrected time in the neutral particle detector was used is shown in the right panel of figure 5.9. The application of the time walk correction improved the time resolution to ns. It is worth noting that this is an overall time–of–flight resolution resulting from the time resolution of the neutron and S1 detectors and the accuracy of the momentum reconstruction of charged particles, needed for the determination of the time of the reaction in the target.
Figure 5.10 (left) shows the TOF distribution as a function of modules number. As expected from the known absorption coefficients [95], the gamma quanta are predominantly registered in the first row of the detector (see fig. 5.3) whereas the interaction points of the neutrons are distributed more homogeneously. Indeed, a clear signal originating from the gamma quanta is seen on the time–of–flight distribution, when taking into account signals from the first row of the neutron detector only, as it is shown in figure 5.10 (right).

Therefore, in order to raise the confidence to the determination of the general offset we have taken signals in the first row of the neutral particle detector. The data have been restricted only for the channel. In this case due to the baryon number conservation there is only one possible source of a signal in the neutral particle detector, namely a gamma quantum, which originates predominantly from the decay of mesons in the target.
Figure 5.11 presents the experimental distribution of the time–of–flight between the target and the neutron detector for neutral particles, with the requirement that additionally to a signal in the neutron detector two charged particles were registered and that one of them was identified as a proton and the other as a deuteron333The method of identifying the particles registered by the drift chambers and scintillator hodoscopes is described in Chapter 6.. As expected, in this spectrum only a signal from the gamma quanta is seen. The clear peak is positioned at the value equal to 24.5 ns, which corresponds to the time–of–flight for the light on the target–neutral particle detector distance.
5.3.4 Efficiency determination
The efficiency of the COSY–11 neutral particle detector – which is an important factor for determining the absolute values of cross sections – was determined using two independend simulation programs. For the first case, a procedure based on the GEANT-3 (GEometry ANd Tracking) code [96] was used for the simulation of the hadronic cascades induced in matter by neutrons. The same procedure was repeated using the FLUKA444The simulations were performed with the 2008 version. (FLUktuierende KAskade) [97, 98] simulation program.
The efficiency of the neutron detector is given by the ratio of the number of events, for which an energy deposited in the scintillator material was larger than the threshold value at least in one of 24 detection units to the number of generated neutrons. The value of the calculated efficiency as a function of the kinetic energy of the neutrons is shown in fig. 5.12 (left). Open squares denote result obtained using the GEANT-3 package and the outcome of the simulation using FLUKA-2008 is presented as black circles [99].


The kinetic energy of the neutrons from the
reaction varies from 300 MeV up to 700 MeV for the 3.35 GeV/c beam
momentum, and as can be inspected from fig. 5.12 (left) the
efficiency is fairly constant in this range. It is important to
mention that the results determined with the different programs are in agreement
within , independently of the threshold value.
Also studies of the variation of the efficiency
depending on the threshold have been conducted. In the experiment the
threshold was set to about 0.1 MeV and therefore
the values from 0 up to 0.6 MeV were scanned.
The result is presented in fig. 5.12 (right).
For both, the GEANT and FLUKA-2008 simulation the efficiency
changes by about 10% over the 0.6 MeV range of the threshold.
5.4 Veto detector
In order to distinguish between charged and neutral particles, in front of the
first layer of the neutral particle detector an additional scintillator detector
was installed as it is shown in figure 5.13.
This detector – referred to as veto detector – is built out of four
overlapping modules with dimensions of 400 mm 200 mm 4 mm.
The lightguides and photomultipiers are mounted at the upper and lower edge of
the modules such that the light signals are read out at both sides of the module.
It permits to reject the background originating from charged particles hitting
the neutral particle detector. The discrimination between signals arising from
the only possible remaining
neutrons and gamma quanta is done by a cut on the time–of–flight (see chapter 6.).

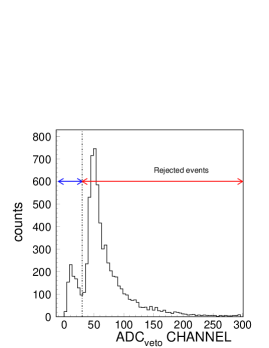
As a first step of the time calibration of the veto detector the time–of–flight between the target and the veto detector has been calculated for each module separately assuming that all time offsets are equal to zero. Next, the values of the calibration constants (offsets) were adjusted such that the time–of–flight value is equal for each module. Figure 5.14 (left) shows the relation of the time–of–flight between the target and the neutral particle detector () and the time–of–flight between the target and the veto detector (). In principle this relation should be linear, however we observe events beyond the correlation line with time signals in the veto detector larger than in the neutral particle detector. This may happened when a neutral particle (which does not give a signal in the veto detector) induces electromagnetic or hadronic reactions in the neutral particle detector, and charged products of these reactions scattered backwards resulting in signals in the veto detector. This effect is reflected in figure 5.14 (right) which shows the ADC signals in one of the veto detector module. Two well separated peaks are observed. The peak in the range from 30 to 300 channels originates from events with charged particles which crossed the veto detector and then entered the neutral particle detector. When taking into account events which are above the correlation line only, the peak in the range between channel numbers 30 and 300 vanishes and only events with small ADC value up to 30 remain. Therefore, to discriminate between charged and neutral particles a cut on the veto detector ADC was applied, which is denoted in the figure 5.14 (right) by a dotted line.
5.5 Spectator detector
In order to identify the unobserved meson in the quasi-free process by means of the missing mass technique, one has to measure not only the momenta of outgoing proton and neutron, but also a determination of the reaction energy for all measured events is needed. The latter was realised by measuring the four-momentum vector of the spectator proton.
5.5.1 Scheme of the spectator detector
Before installation at the COSY-11 detection setup, the spectator detector has
been used by the PROMICE/WASA collaboration at the CELCIUS storage ring of The
Svedberg Laboratory [80].
Detectors which are located inside the scattering chamber, close to the
interaction point, must be compatible with high vacuum and resistant to radiation
environment. Moreover, a very good energy resolution is highly required in order to determine
the four-momentum of the spectator protons. These factors exclude the use of plastic scintillator.
Solid state devices are well suited
for this purpose, therefore silicon was chosen as an active material in the
spectator detector.
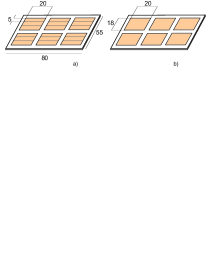
The spectator detector consists of four double–layered modules. The layers are
produced of 300 m thick silicon. Each of the front layers, which are the planes
closer to the beam, contain eighteen silicon pads. The active area of a single pad amounts to
20 mm 5 mm. The back layer contains six silicon pads, with an active area of
20 mm 18 mm. The schematic picture of the front (dE) and the back (E) layers is
shown in figure 5.15.
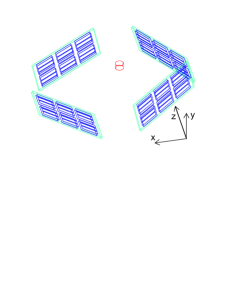
The silicon detector system is placed in the high vacuum at the COSY storage ring at a distance of about 5 cm upstream from the interaction point as it is schematically shown in figure 5.16. The active area covers about 22% of the full solid angle. The arrangement was a compromise between the technical needs for the installation and the angular resolution.
5.5.2 Energy calibration and position optimization
During the experiment, the charge of the signal induced in the detector by the particles, which is proportional to the energy deposited in the detection unit, has been measured. Denoting by and the measured charge in the first and second layer, respectively, the real energy loss can be expressed as: and , where and are the calibration constants for two layers. The aim of the spectator detector calibration was to find the exact position of the detector and then to establish the calibration constants for each of the 96 silicon pads. The position of the spectator detector inside the beam pipe is described by only three parameters [82]. Variable dz denotes the translation along the z-axis in the main reference system (MARS). Parameters dl and alpha account for translation and rotation of the flange used for supporting the spectator detector.
Differences in shapes of the distributions are due to the fact that the effective thickness of the silicon modules of the detector ”seen” by particles outgoing from the interaction point depends on the particles’ incident angle on the detector surface. These variations allowed to find the exact position and orientation of the spectator detector inside the COSY–ring. Figure 5.17 presents an example of the calculated distributions for a few arbitrarily chosen sets of parameters dz, dl, and alpha.
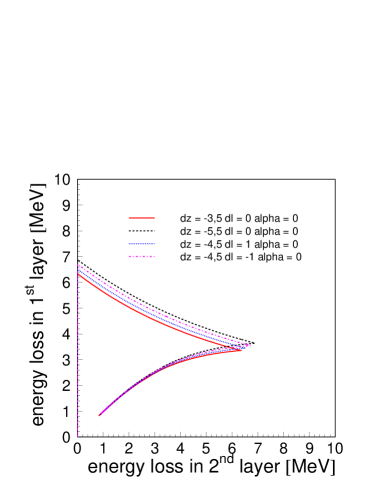
Assuming that the set of calibration constants (, ) are correct, experimental distributions of the have been fitted to the calculated energy losses, and examined by varying the parameters describing the position of the spectator detector. After the determination of the new position of the detector the experimental data points on the plot were fitted to the expected function, with calibration constans and as free parameters for each detection pair. The procedure was repeated until the changes become negligible.
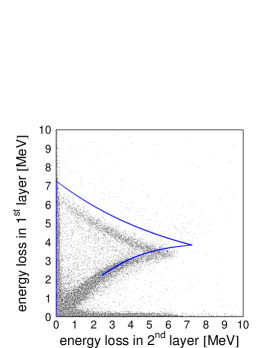
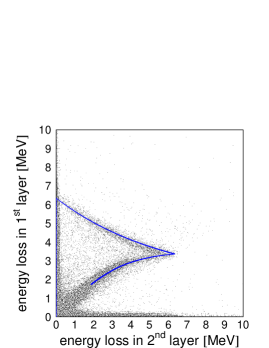
Figure 5.18 (left) shows the energy losses in the first layer versus
the second layer before the calibration constants and
were determined. The theoretical calculations are indicated by the solid curve.
Fig. 5.18 (right) shows the corresponding plot after the calibration.
The position of the
spectator detector has been determined with an accuracy of 1 mm, consistent
with the nominal values based on the geometrical designs of the setup and with
the values obtained for the analysis of the test reaction [42].
Taking into account the size of the
stream of the deuteron target with a diameter of 9 mm [100] the
accuracy of the position determination within 1 mm is satisfactory.
Figure 5.19 shows the distribution of the excess energy with respect to the
system determined for the reaction.
The solid histogram was obtained with the position
of the spectator detector determined in the above described procedure.
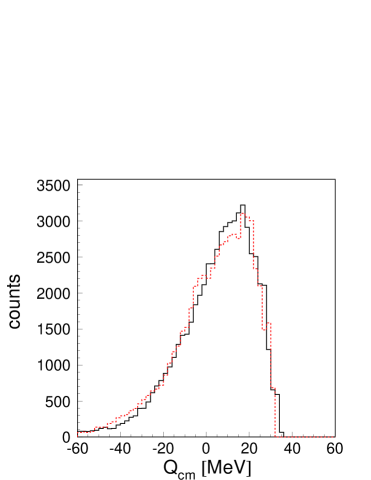
As a cross check, the same data were analysed with the set of parameters describing the orientation of the spectator detector used previously in the analysis of the reaction. The result is presented as a dashed histogram.
Chapter 6 Analysis of the experimental data
In this chapter the determination of the four-momentum vectors of the outgoing nucleons will be presented, and the missing mass technique as well as the method of background subtraction will be described.
6.1 Event selection
The first step of the off-line analysis of the experimental data was the software selection of events with one track reconstructed in the drift chambers and a signal in the neutral particle detector. As a next step particles registered in drift chambers were identified.
6.1.1 Proton identification
All charged particles originating from the proton-neutron reaction are separated from the proton beam in the magnetic field of the dipole magnet due to the smaller momenta and some of them are registered in the drift chambers and scintillator detectors (S1, S3). For each event the time–of–flight of particle between the S1 and S3 hodoscopes is measured.
Knowing the relative distances
between these detectors, the velocity of the particles is calculated.
Based on the signals in the drift chambers D1 and D2 the trajectories
of particles are reconstructed. Furthermore the particles momenta are reconstructed
by tracking the trajectories back through the
known magnetic field of the dipole to the centre of the interaction region
(the overlap between the target and the beam).
The precision of the momentum reconstruction is equal to 6 MeV/c [54].
Having the velocity of the particle and its total momentum the squared
invariant mass is determined.
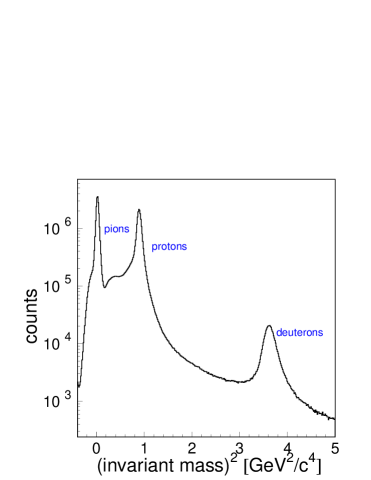
Charged ejectiles can well be identified as shown in figure 6.1,
where the distribution of the squared mass of charged particles
originating from the proton-deuteron reaction performed at a beam momentum
of 3.35 GeV/c is presented. Three clear peaks are evidently visible and correspond
to the squared mass of pions, protons and deuterons. For the further analysis
events with invariant mass corresponding to the proton mass are selected
(0.2 GeV2/c4 m2 1.6 GeV2/c4).
After the particle identification, the time of the reaction at
the target point is obtained from the known velocity, trajectory and the time
measured by the S1 detector.
6.1.2 Neutron identification
The determination of the four-momentum of the neutron is based on the time–of–flight measurement. The absolute value of the neutron momentum can be expressed as:
| (6.1) |
The denotes the mass of the neutron, is a distance from the centre of
the interaction region to the central part of the module
which fired as the first one. Thus the time–of–flight is taken as a difference
between the time of the reaction (known from the backtracking protons
to the interaction point) and the shortest time of the neutral particle detector.
The individual momentum components are determined from the angle
defined by the centre of the hit segment. The momentum component along the y-axis
is assumed to be zero since the sensivity of the neutral particle detector is insufficient in the
up-down direction. The granularity of the detector allows to determine the horizontal
hit position with an accuracy of cm.
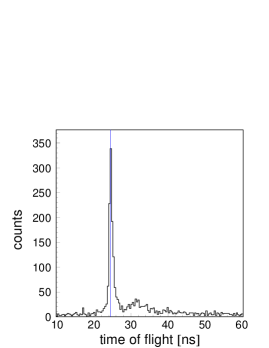
Figure 6.2 presents the time–of–flight distribution between the target and the
neutral particle detector as measured for neutral particles. The veto detector installed
in front of the neutral particle detector discriminates signals originating from
charged particles, however, it does not discern gamma quanta, which are detected
in the neutral particle detector as well. Therefore, a clear signal originating from
the gamma rays is seen at 24.5 ns over a broad yield from neutrons. This histogram shows
that a discrimination between signals originating from neutrons and gamma quanta can
be done by a cut on the time–of–flight. From the Monte Carlo simulations
of the reaction
the largest expected momentum value of the neutron is eqaul to 1.4 GeV/c
which corresponds to the time–of–flight value of ns
(see dashed histogram in fig. 6.2). This allows to select events
for which the time–of–flight is higher than as it is indicated by an arrow in
fig. 6.2. This condition excludes background of gamma quanta.
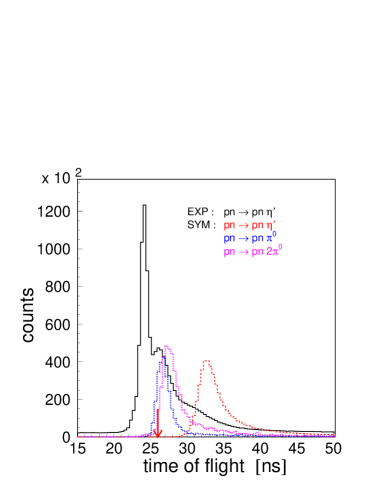
Background reactions with neutrons in the exit channel and their contribution to the time–of–flight distribution have been investigated also. The simulated reactions were analysed in the same way as the experimental data. The distributions of the time–of–flight for neutrons originating from quasi-free reactions are shown in figure 6.2 with dotted histograms. The time–of–flight cut does not exclude neutrons from different quasi-free reactions, and this will constitute the main background which must be subtracted (see section 6.3.1).
6.2 Determination of the excess energy
Having proton and neutron identified, the consecutive software selection of the
experimental data was applied. In addition to one proton registered in the drift chambers and
a neutron in the neutral particle detector, at least a signal in one layer of the spectator
detector was demanded.
As it was disscused in chapter 3, to establish the exces energy with respect
to the reaction, the measurement of the proton spectator momentum,
and the determination of the total energy is indispensable.
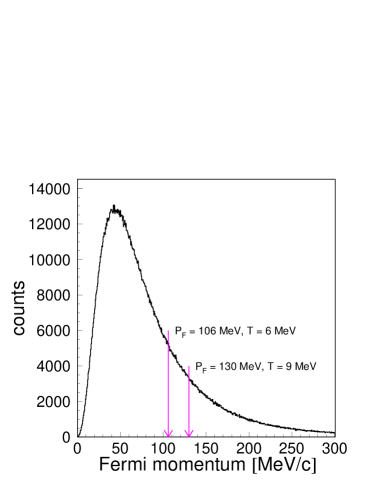
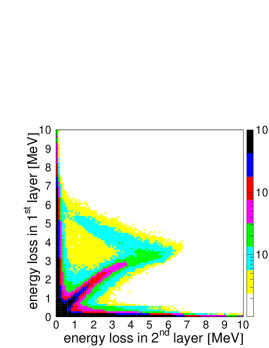
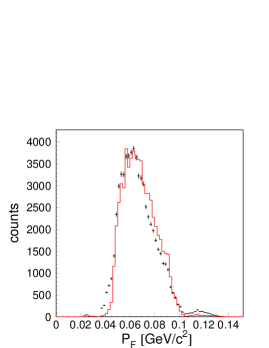
The spectator detector is designed such, that protons impinging perpendicular to the detector surface and having a kinetic energy of less than 6 MeV are stopped in the first layer (dE). Protons with kinetic energy in the range between 6 MeV and 9 MeV are stopped in the second layer (E). All protons with MeV are passing through both layers of the spectator detector. As it is seen in figure 6.3 a large number of spectator protons (with maximum Fermi momentum of 130 MeV) will be stopped in the detector. In the experiment we registered the spectator protons with momenta larger than 35 MeV/c since it is not possible to separate the energy losses for protons with lower momenta from the noise level. The spectator noise cut has been performed for each pad of the detector separately, using the spectra of energy loss triggered by a pulser with a frequency of 1 Hz additionally to other experimental triggers. Figure 6.4 (left) shows the energy losses in the layer of the spectator detector versus the layer. Slow spectator protons are stopped in the first or second layer of the detector whereas fast particles (mainly charged pions) cross both detection layers. Signals from deuterons are not observed since deuterons cannot be emitted backward due to the kinematics. Having the deposited energy and the emission angles we calculate the energy of the spectator proton and its momentum . Figure 6.4 (right) presents the momentum distribution of protons considered as spectator (points) compared with simulations taking into account a Fermi motion of nucleons inside the deuteron (solid line).
The total energy available for the quasi-free proton-neutron reaction can be calculated for each event from the vectors of the spectator momentum and beam momentum.
| (6.2) |
and are the energy and momentum vector of the proton beam. and are the energy and momentum vector of the neutron target, calculated from the energy and the momentum of spectator proton (, ); and denote the deuteron and proton masses, respectively. The excess energy with respect to the process is equal to:
| (6.3) |
where , and are the mass of proton, neutron and
the meson, respectively.
The experimental distribution of the excess energy is shown in the left
panel of figure 6.5. As was previously discussed, with one fixed
value of the beam momentum – due to the Fermi motion of nucleons inside the
deuteron – one can scan a broad range of the excess energy,
from 0 up to 32 MeV for GeV/c. Negative values of the excess energy
correspond to events, when the total energy in the centre-of-mass frame was
insufficient for the production of a meson and only the production of multi-pion
background events could occur. For excess energies larger than zero, additionally to the pion
production also the meson is created. A simulated
distribution of the excess energy for quasi-free reaction, calculated
with respect to the system is depicted in
figure 6.5 (right).


A number of factors influence the registered yield of the reaction as a function of the excess energy: the Fermi momentum distribution of nucleons in the deuteron target, the relative settings of the spectator detector and the target, the absolute momentum of the proton beam and the acceptance of the COSY–11 detection setup. Due to the rapid growth of the total cross section close to the production threshold the accuracy of the excess energy determination is one of the most important parameters and it is mandatory to estimate correctly its uncertainty. The accuracy of the excess energy determination was estimated based on Monte Carlo simulations. For this purpose we have simulated events of the reaction taking into account the Fermi motion of the nucleons inside the deuteron, the size of the target (diameter mm), the spread of the beam momentum ( MeV/c) and the horizontal ( mm) and vertical ( mm) beam size [101]. Simulated data have been analysed in the same way as the experimental data, taking into consideration the energy- and time-resolution of the detectors.
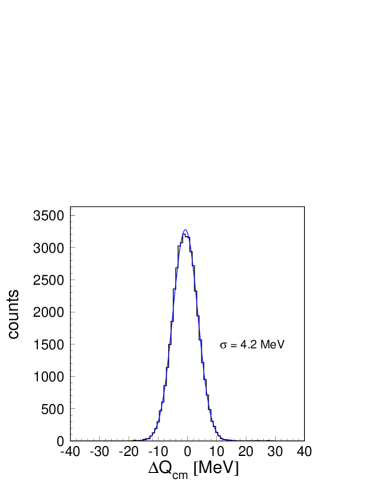
Figure 6.6 presents the distribution of differences between the generated excess energy and the reconstructed excess energy from signals simulated in the detectors . The distribution of was fitted by a Gaussian function resulting in an excess energy resolution of MeV. For the reaction near threshold a standard deviation of the excess energy was derived to be MeV [42], which is comparable with MeV obtained at similar conditions at the PROMICE/WASA setup [80].
6.3 Identification of the reaction
The mesons produced in the reaction
are identified using the missing mass technique.
Knowing the four-momentum vectors of a proton and a neutron in the initial and final
state, and employing the principle of momentum and energy conservation
one can calculate the squared mass of the unmeasured particle or group of particles:
| (6.4) |
where,
is the energy and momentum of proton beam,
is the energy and momentum of neutron target,
is the energy and momentum of outgoing proton, and
is the energy and momentum of outgoing neutron.
The method of the proton identification and of the neutron selection was described
in sections 6.1 and 6.2.
Before the missing mass was calculated, the collected data were grouped
according to the excess energy. The available range of the excess energy
above the meson production threshold (from 0 to 32 MeV) has been
divided into four bins, each 8 MeV wide. The choice of the interval width is a
compromise between the statistic and the resolution and reflects the accuracy
(FWHM) of the determination of the excess energy. Due to the very low statistic
and small acceptance, events corresponding to the excess energy interval between
24 and 32 MeV are not taken for further analysis. Moreover, in this range the excess
energy distribution is very sensitive to changes of the position of the
spectator detector, what can be seen from figure 6.7
showing the distribution of the excess energy determined for the
reaction as obtained with the position of
the spectator detector fixed based on the data (solid histogram)
and with the detector shifted from this position
in the z-axis direction by 3 mm (dashed histogram). A significant reduction of number of
counts in the interval between 24 and 32 MeV is clearly observed.
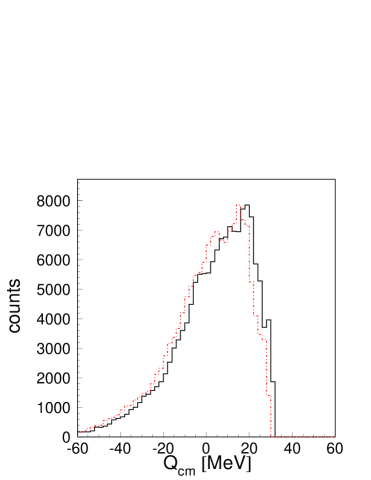
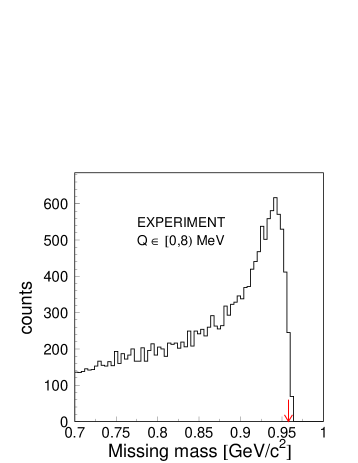
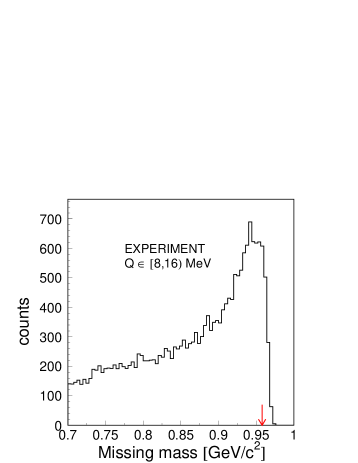
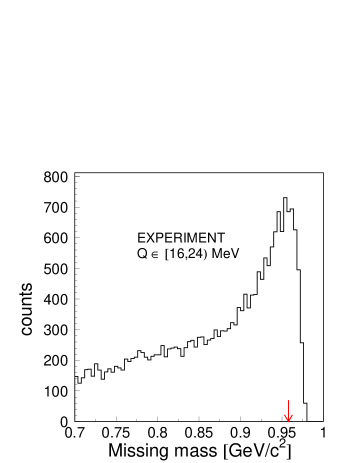
Figure 6.8 presents the experimental missing mass spectra of the process calculated for the excess energy ranges MeV MeV and MeV. For all missing mass distributions we observe an increase of counting rate towards the higher masses ending at the kinematical limit. The shape is mostly due to the detector acceptance. A signal from meson production is expected on top of the multi-pion mass distribution at the position corresponding to the mass – denoted by the arrow – however no enhancement around this region is seen. Therefore, to extract number of events, the multi-pion background must be disentangled from the missing mass distributions.
6.3.1 Method of background subtraction
The background investigation in the missing mass spectrum of the quasi-free
reaction is a challenging task, especially close to threshold. This is even more difficult
when the resolution of the mass determination is comparable with the excess energy.
The method of separating contributions from the multi-pion production in the missing
mass spectrum of the quasi-free reaction is described in details
in a dedicated article [102]. Therefore, here only the general principle will be pointed out.
One can disentangle the number of events from single-
and multi-pion background without conducting model-dependent simulations by comparison
of the missing mass distributions for the negative values of , when only pions
can be created and for larger than zero.
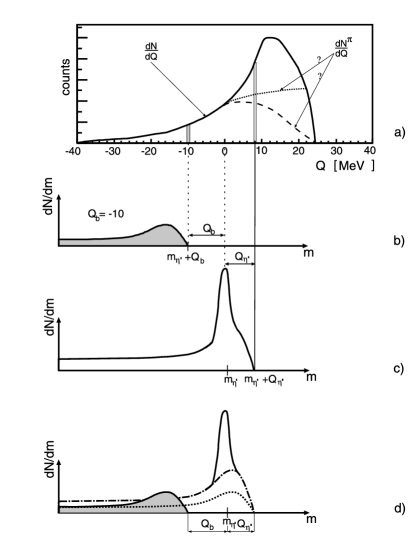
Let us assume that the number of registered events is very large and that the shape of the reconstructed invariant mass of the multi-pion background is independent of the excess energy . The form of the background could then be determined from the missing mass spectrum from an infinitesimal range at any negative value of . The shape of the background can be expressed in terms of a normalised function of the difference between the kinematical limit and the given mass . Assuming infinite statistics, one could divide the positive range into very narrow subranges within which the resultant missing mass spectrum would be a sum of a signal from the meson () and the form . This situation is schematically depicted in figure 6.9. In order to derive a signal of the meson from the missing mass spectrum for positive it would be sufficient to subtract from this spectrum a missing mass distribution determined for negative values after the shift of the latter to the kinematical limit (dotted line) and normalisation at the very low mass values where no events from the meson are expected (dashed-dotted line) [102]. At real experimental conditions, due to the finite statistics, the missing mass spectrum is studied in finite intervals of , what alters the form of the multi-pion background. Therefore one has to take as narrow intervals of as reasonable, taking into account the experimental resolution in and assuming that within this range the multi-pion background is constant. An natural choice is to take the width of the subranges equal to the FWHM of the resolution of the determination.
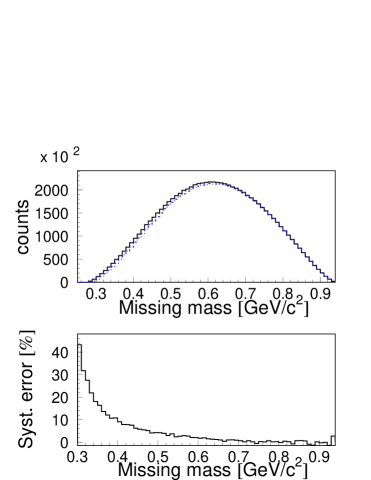
In order to gain more certainty that the measured shape of the multi-pion background does not alter significantly with changes of the excess energy, we have performed simulations of the background originating from two pion creation in proton-neutron collisions. Figure 6.10 presents the missing mass distribution of the two pion system produced via the reaction. Events were simulated at the excess energy intervals of = (-30,-20) MeV and = (-20,-10) MeV with respect to the system. From the comparison of the form of both spectra one realises that there is no noticeable difference in the shape at the missing mass range of the mass. The systematic error caused by the subtracion of the shifted and normalised histogram is shown in the lower panel of figure 6.10. It is demonstrated that the fractional systematic error due to the multi-pion background subtraction is in order of one per cent of the background value within the range of 200 MeV in the vicinity of the kinematical limit.
6.3.2 Background subtracted missing mass distribution
As was already discussed, events with excess energies larger than zero were divided into intervals of = 8 MeV. For each interval the missing mass was calculated separately. Next, for each distribution of the missing mass spectra, a corresponding background spectrum has been constructed from events with belonging to the MeV range applying the method described in the previous section. As a cross check, to gain more confidence about the applied procedure we have constructed alternative background distrubutions taking events from a range from -20 MeV to 0 MeV. The result of this investigation has shown a consistency of both background shapes in the order of 1%.
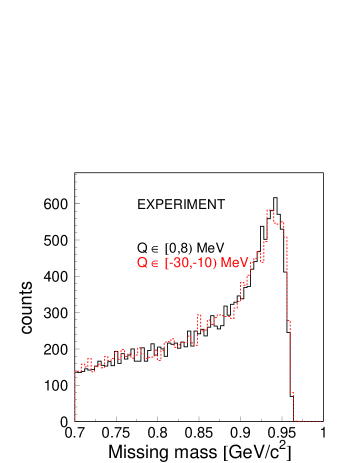
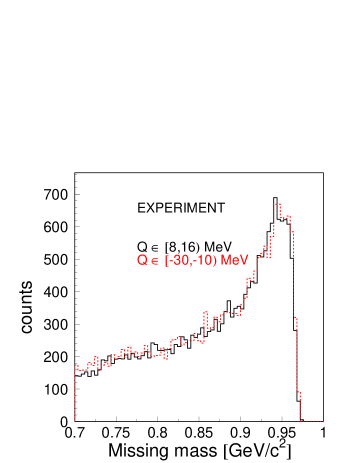
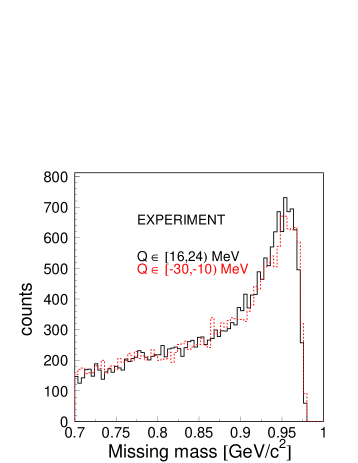
Afterwards, to each distribution for the corresponding background spectrum has been normalised for mass values smaller than 0.25 GeV/c2 where no events from the are expected. In this region events correspond to the one pion production, for which the total cross section remains nearly constant in the shown range of the excess energy. Figure 6.11 shows the experimental mass distribution for signal (solid black histogram) as determined for the excess energy ranges MeV, MeV, and MeV. The dashed red line depicts the background spectrum, shifted to the kinematical limit and normalised accordingly.
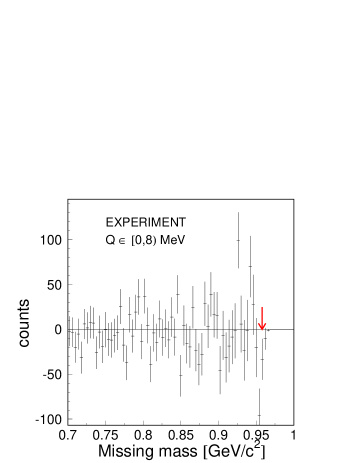
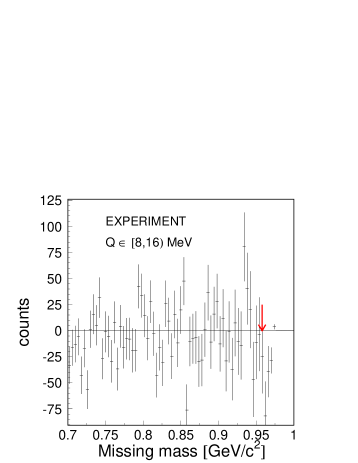
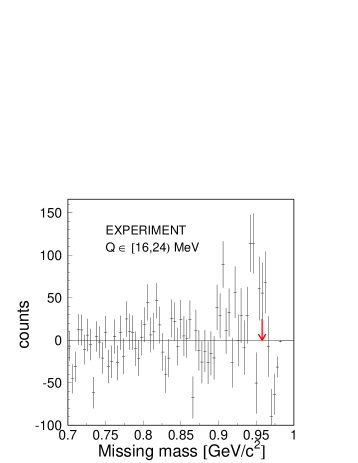
Figure 6.12 shows distributions of the missing mass for the reaction as determined after subtraction of the background. Due to the low statistics and very low signal-to-background ratio the signal from meson created in the proton-neutron collision is statistically insignificant. Therefore, in this thesis we can only estimate the upper limit for the meson production in the reaction.
Expected missing mass distributions from the Monte Carlo simulations are presented in figure 6.13. In the simulation, based on the GEANT-3 package we took into account the momentum spread of the beam, beam and target dimensions, Fermi motion of nucleons inside the deuteron target, the geometry of the COSY–11 detector setup, multiple scattering of particles and other known physical effects were included in the GEANT-3 package [96]. The simulated data have been analysed in the same way as the experimental one, taking into consideration position-, time- and energy-resolution of all detector components.


In order to estimate the systematic error of the number of the events, the change of the missing mass spectra has been studied by varying different parameters describing the experimental conditions (position of the detectors, time offsets, etc.) in the analysis and in the simulation. Change of the global time offset of the neutral particle detector by one standard deviation of its time resolution ns) resulted in systematic error of the missing mass distribution of 3%. As was disscused above, the systematic error due to the method used for the background subtraction is equal to 1%. The uncertainty due to the model dependence calculation of the Fermi momentum distribution is equal to 2% [82] and was estimated as the difference between results determined using the Paris [60] and the CD-Bonn [103] potentials. A displacement of the spectator detector (fixed based on the experimental data) by 1 mm (standard deviation of its position accuracy) changes the number of events by 5%.
Chapter 7 Luminosity determination
For the calculation of the absolute total cross section of the reaction the knowledge of the integrated luminosity is mandatory. The determination of the luminosity is based on the registration of the quasi-free reaction, which was measured simultaneously with the meson production in proton-neutron collisions. In this kind of scattering, the proton from the beam interacts with the proton bound inside the deuteron target. The outgoing protons were measured in coincidence with the S1 and S4 scintillator detectors (see figure 4.2). In the S4 scintillator and the position sensitive silicon detector - referred to as the monitor detector - the recoil proton is registered. The forward proton is bent in the magnetic field of the dipole towards the drift chambers and S1 scintillator detector. Figure 7.1 shows the measured correlation between the position in the S1 scintillator and the position in the monitor detector. The lower band arises from the free proton-deuteron scattering, whereas the broad distribution results from the quasi-free proton-proton scattering events.
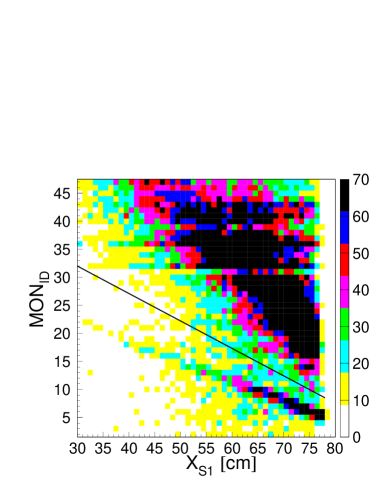
In the off-line analysis we have separated the quasi-free proton-proton
from the proton-deuteron scattering applying a cut on the histogram as depicted
by black line in figure 7.1. For the further analysis only events above the
black line were taken. The determination of the luminosity
by means of the quasi-free proton-proton reaction measurement takes advantage of the
availability of the precise cross sections determined by the EDDA group [104].
The normalisation uncertainty of the EDDA differential cross sections is relatively
small (equal to circa 4% [104, 105]), whereas the systematic error arising
from the determination of the corresponding differential cross section for the
proton-deuteron scattering is in order of 10% [106].
The momentum of the fast proton is determined by tracking back the
trajectory reconstructed from the signals in the drift chambers through the
magnetic field to the target point.
Figure 7.2 (left) shows the parallel versus the transversal component of
the reconstucted momentum of the forward scattered proton. Events corresponding
to the elastically scattered protons are seen near the kinematical ellipse,
which is marked as a dashed line. The right panel of figure 7.2 presents
an analogous spectrum obtained from the Monte Carlo simulations taking into account
the acceptance of the detection system, the Fermi motion of the nucleons,
and the variation of differential cross section for the elastic scattering
as a function of the scattering angle and energy as it will be described later
in this section.
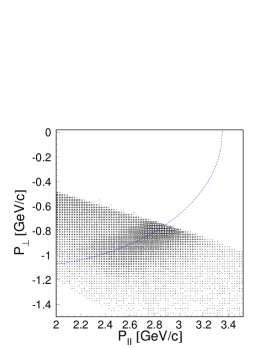
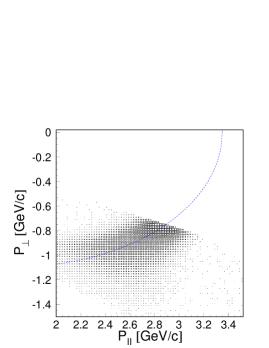
In proton-proton experiments the elastic scattering
is taken as a reference reaction due to the wealth of
high-precision data available from the measurements of the EDDA collaboration [104].
The additional advantage of selecting this channel is the relatively high number of
events, being clearly selectable
by a coincident detection of both ejectiles.
To determine the luminosity, the known differential cross
sections for elastically scattered protons are compared to the number of
scattered protons from the experimental data.
In case of
quasi-free elastic scattering we have to deal with the Fermi motion of
the nucleons inside the deuteron.
This motion implies that the value of the total energy in
the centre-of-mass system as well as the direction of the centre-of-mass
velocity varies from event to event.
To demonstrate the momentum spread caused by the Fermi motion let us
consider the equivalent effective beam momentum as it is seen from the
proton inside the deuteron.
Figure 7.3 shows the distribution of the effective beam momentum
for the quasi-free proton-proton scattering at the nominal value of the
beam momentum equal to 3.35 GeV/c. The momentum changes significantly
from 2.2 GeV/c up to 4.5 GeV/c, therefore this effect cannot be neglected.
At this point we have to emphasise that due to this effect,
in a single subrange of the
scattering angle in the laboratory system there are events
originating from scattering at different values of the total energy ,
as well as different scattering angles in the proton-proton centre-of-mass
system.

Therefore in order to calculate the integral luminosity we have to perform simulations taking into account these effects. Each simulated event has been associated with a weight corresponding to the differential cross section which is a function of the scattering angle and the total energy in the proton-proton centre-of-mass system [107]. For this purpose we have used cross section values for the reaction computed by means of the SAID programme [108] because the accessible data base of the EDDA collaboration was insufficient. As it is seen in figure 7.3 the effective beam momentum which is seen from the nucleon inside the deuteron changes from 2.2 GeV/c up to 4.2 GeV/c whereas EDDA measurements were performed in the beam momentum range from 0.712 GeV/c to 3.387 GeV/c.
In order to calculate the integrated luminosity, available range of the x-coordinate along the S1 detector has been divided into four subranges. Further on, in order to separate the background originating from multi-particle reactions, the projection of the distance of the points from the kinematical ellipse was extracted for each subrange separately. The results for two subranges are shown in figure 7.4. Next, after the background subtraction the real number of scattered events into a given subrange of the S1 detector has been obtained.
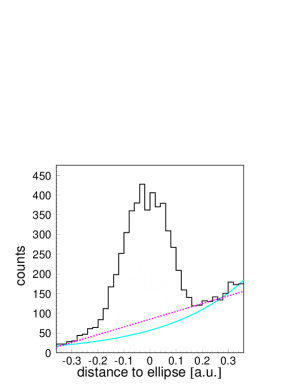
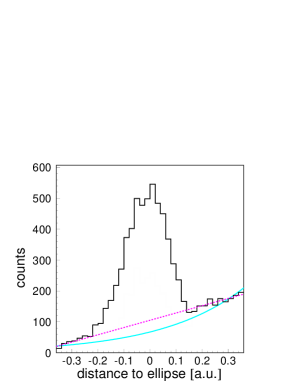


In order to determine the number, we have simulated quasi-free events, which have been analysed using the same procedure as in case of the experimental data and which were weighted with the values of the differential cross sections expressed in units of mb. The results for analogous subranges as for the experimental distributions are shown in figure 7.5.
The integrated luminosity was calculated as follows [107]:
| (7.1) |
We have determined the integral luminosity for all subranges of the S1 detector individually. The weighted average integrated luminosity equals to . The estimated uncertainty is statistical only.
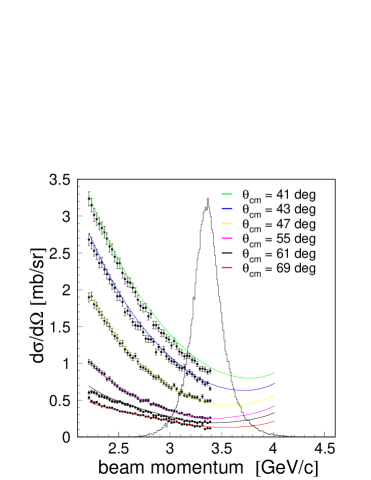
In addition we have estimated the systematic uncertainty.
One of the possible sources of the systematic error may be attached to the
background subtraction. For the evaluation of this systematic uncertainty,
we have subtracted the background in two ways, namely in one case the background
was described by an exponential function, in the latter case we assumed a
linear background (compare the dash and solid lines in figure 7.4).
Finally the systematic error due to the background
subtraction estimated as the difference between the results determined with the two methods
is not larger than
The systematic error originating from the assumption of the potential model
of the nucleon bound inside the deuteron is equal to about 2% [82].
Another source of the systematic error originates from the approximation
of the differential cross section by the calculations using the SAID procedure [108].
The total cross section for the proton-proton scattering process has been measured
up to beam momentum GeV/c, whereas the effective beam momentum
for the studied reaction ranges up to 4.2 GeV/c. Therefore for events with effective
3.4 GeV/c the differential cross sections were interpolated using
the SAID programme.
Figure 7.6 shows a comparison of the existing
differencial cross section from the EDDA measurement and the SAID calculations.
In the same figure the distribution of the effective beam momentum is also shown.
In order to estimate this uncertainty, we have calculated
the luminosity assuming a linear dependence between the
and the momentum for events with effective beam momentum larger than 3.0 GeV/c.
Performed calculations show that the result obtained under this assumption differs
from the result presented above by 5%.
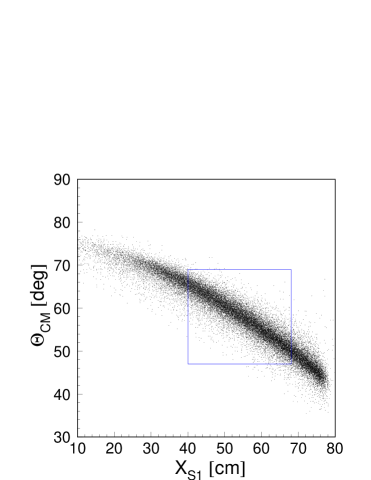
To reduce this systematic error as much as possible,
events with such scattering angles in the centre-of-mass
system have been selected for which the differential cross sections calculated
using the SAID programme are in agreement with the
distributions measured by the EDDA collaboration (see figure 7.6).
Figure 7.7 shows the relation between the available range of the
angles and the position in the S1 detector for the quasi-free
proton-proton scattering at GeV/c as has been obtained in
the Monte Carlo simulation. The rectangular area denotes the applied cut on the
position in the S1 detector, which restricts the angle to the
range from 48 to 69 degrees a good agrement between the
SAID calculations and EDDA data is given.
Summarizing, we have estimated the overall systematic error of the integrated
luminosity to be 7%.
Chapter 8 Excitation function
In the following section we estimate the upper limit of the total cross section for the quasi-free reaction as a function of the excess energy. Furthermore, an upper limit of the ratio will be determined and compared to the analogous ratio calculated for the meson [12, 42].
8.1 Upper limit of the total cross section
The total cross section for the reaction was calculated using the formula:
| (8.1) |
where is the number of mesons for a given
excess energy , is the luminosity integrated over the time of the measurement
and is the detection efficiency including the geometrical acceptance of the
detector system.
The luminosity was established from the number of the quasi-free proton-proton scattering
events (see chapter 7). The acceptance of the detector setup and efficiency was
determined based on Monte Carlo studies.
After subtracting the missing mass distributions for the negative values of from
the spectra for positive values of – due to the very low signal-to-background ratio –
the signal from the meson was found to be statistically insignificant.
Therefore, we estimate
the upper limit of the total cross section for the quasi-free
reaction.
The number of the mesons can be calculated as the difference between the number of
events in the peak for the signal (solid line in figure 6.11) and the number of
events of the background in the peak (dash line in figure 6.11):
| (8.2) |
The range for the integration has been chosen based on the simulation of the missing mass distributions (see figure 6.13). Assuming that in the experiment no mesons are observed the value was used to determine the upper limit of the total cross section for the reaction at a 90% confidence level. The result is shown in figure 8.1 and in table 8.1.
| upper limit of | |
|---|---|
| [MeV] | |
| at 90% CL [nb] | |
| 63 | |
| 197 | |
| 656 |
The horizontal bars in figure 8.1 represents the intervals of the excess energy, for which the upper limit of the total cross section was calculated.
The efficiency and the acceptance
of the COSY–11 detector system was estimated based on Monte Carlo simulations.
The error of the detection efficiency () is determined to be 3%.
The main contribution of this systematic
error comes from the uncertainty in the efficiency in the neutron registration, as was
discussed in section 5.3.4.
The total systematic error of was estimated as the quadratic sum
of independent systematic errors originating from luminosity calculation
(), determination of the efficiency ()
and estimation of the number of mesons ()
and is equal to .
8.2 Ratio
Figure 8.2 presents the upper limit of the ratio of the total cross section for the and reaction as a function of the excess energy (red crosses). Analogous ratios but for the meson are also shown as open squares.
The total cross section for the reaction was measured in former experiments [13, 14, 15, 16, 17]. It reveals a strong excess energy dependence, especially very close to threshold and hence this dependence must be taken into account when comparing to the results for the reaction which were established for 8 MeV excess energy intervals. Therefore, for a given interval of excess energy, we have determined the mean value of the total cross section for reaction using the parametrisation of Fäldt and Wilkin fitted to the experimental data [44, 45] (for details see appendix B).
| upper limit of | upper limit of | ||
|---|---|---|---|
| [MeV] | [nb] | ||
| at 90% CL [nb] | at 90% CL | ||
| 63 | 19.6 | 3.2 | |
| 197 | 68.7 | 2.9 | |
| 656 | 122.7 | 5.3 |
The determined total cross section values together with the upper limit of the ratio are presented in table 8.2. In case of the meson, the ratio of the total cross sections for the reactions and was determined to be 6.5 at excess energies larger than MeV [12], what suggests the dominance of the isovector meson exchange in the production mechanism, whereas close to threshold the ratio falls down to about 3 [42]. This decrease may be explained by the different energy dependence of the proton-proton and proton-neutron final state interactions [44, 45]. For the meson the upper limit of the ratio for the excess energy range from 0 MeV to 8 MeV is nearly equal to values of the ratio obtained for the meson, whereas for larger excess energies (from 8 MeV to 24 MeV) the ratio is notably lower.
Chapter 9 Comparison with model predictions
The total cross section for the reaction close to the
threshold appeared to be too small to reveal a signal in the missing mass
spectrum with the statistics achieved in the discussed experiment.
The established upper limit does not allow to verify the scenario of the production
via the possible gluonic component in the wave function [9, 10].
However, the results
also do not exclude this hypothesis and may be treated as a promissing finding in this context
since the established upper limits for the ratio R are lower than the values
of the ratio for the meson.
Recently, X. Cao and X. G. Lee [7] performed an analysis of and
reactions within an effective Lagrangian approach, assuming
that the S11(1535) resonance is dominant in the production.
Numerical results
show that the exchange is most important in the process
and predict a large ratio of to
equal to R = 6.5 in the excess energy range from 0 MeV to 160 MeV.
Thus the authors assumed that the production of the meson proceeds in the same
way as the production of the meson, and as a consequence predicted a R value
equal to the experimentally established Rη value.
Yet, the experimentally determined upper limit of R being the result
of this thesis is considerably lower than the R = 6.5 predicted in reference [7].
Therefore, on this stage
of knowledge we can exclude the hypothesis that the dominant production mechanism of the meson
in nucleon-nucleon collisions is associated with the excitation and de-excitation of the S11(1535)
resonance.
Another model has been elaborated by L. P. Kaptari and B. Kämpfer [6],
considering the production of the meson
in the and reactions close to threshold
by analysing the data within a covariant effective meson-nucleon theory by including meson
and nucleon currents with resonances S11(1650), P11(1710) and P13(1720).
In the framework of this model
a reasonable agreement with data on has been achieved with a
contribution of the meson conversion currents. The total contribution of nucleonic and
resonance currents was found to be small.
The predictions for the reaction, based on this model [6] are seen as a
dotted line in figure 9.1, and
are confronted with the upper limits of the total cross sections for the
reaction (left) and the upper limits of the ratio R (right).
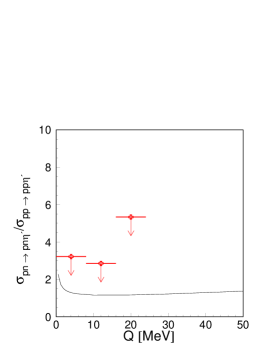
The experimentally determined values of the total cross sections for the reaction, as well as the results achieved for the ratio R do not exclude the calculations of ref. [6].
For the reaction, calculations of K. Nakayama and collaborators [41] yields the S11(1650) resonance as the dominant contribution to the production current, whereas the P11(1880) resonance, mesonic and nucleonic currents were found to be much smaller. The combined analysis of the reaction and photoproduction reactions was crucial for these findings. The details of the excitation mechanism of the S11 resonance, however, are not constrained by the currently existing data. As the authors pointed out [41], to learn more about the relevant excitation mechanism, observables other than the cross sections, such as the invariant mass distribution [48] are necessary.
Chapter 10 Summary and perspectives
The main goal of this dissertation is the determination of the excitation function
of the total cross section for the quasi-free reaction
near the kinematical threshold. The motivation of the presented experiment was the
comparison of the and
total cross sections in order to learn about the production mechanism
of the meson in the channels of isospin and and to investigate
aspects of the gluonium component of the meson.
The experiment, which is described in this thesis has been performed at the cooler synchrotron
COSY in the Research Centre Jülich by means of the COSY–11 detector system.
For the purpose of this experiment the standard COSY–11 detector setup was extended by
the neutral particle and spectator detectors. The quasi-free
reaction has been induced by a proton beam with a momentum of 3.35 GeV/c in
a deuteron target. All outgoing nucleons have been registered by the COSY–11 detectors, whereas
for the meson identification the missing mass technique was applied.
The upper limit of the total cross section for the reaction
in the excess energy range between 0 and 24 MeV determined for the first time ever
is presented in this thesis. Having the total cross section for the reaction
in the same energy range, measured in previous experiments, the upper limit of the ratio
R = / has been estimated.
The achieved result differ from the analogous ratio Rη obtained for the meson. This allows to
conclude that the production mechanism of these mesons in nucleon-nucleon collisions are different
and the meson is not
dominantly created via the excitation of the S11(1535) resonance as it is the case for the meson.
It is also shown, that the theoretical predictions assuming the production
mechanism to be associated with the fusion of virtual mesons or with glue excited in the interaction
region of the colliding nucleons are not excluded by the experimental data. However, it is not possible
to distinguish between these mechanisms based on the existing data. This conclusion calls for
further theoretical as well as experimental investigations.
For quantitative tests of these mechanisms an order of magnitude larger statistics and
a larger energy range would be required. This can be reached with the WASA-at-COSY facility.
In parallel to the investigation of the reaction,
presented in this thesis, we have extended the experimental
studies to a pure isospin zero state of the interacting nucleons by the measurement
of the quasi-free reaction. This experiment was conducted using the
proton beam with a momentum of 3.365 GeV/c and a deuteron target.
Assuming that the ratio of the cross sections for the
and reactions will be in the same order of magnitude as the ratio already
established [12] for the and reactions it is expected
to identify about 1000 events in the data sample [109].
Together with the results of the and
reactions we would then complete the study of the
meson production cross section in nucleon-nucleon collisions.
This will further reduce significantly the ambiguities of theoretical models and will lead to
a better understanding
of the production mechanism of the meson in nucleon-nucleon collisions.
The result will also be of importance for rate estimates for studying the meson
decays with the WASA-at-COSY facility [67, 110].
Appendix A Precision of the neutron momentum determination
The experimental precision of the missing mass determination of the reaction strongly relies on the accurate measurement of the momentum of neutrons. The neutron detector is designed to deliver the information about the time at which the registered neutron or gamma quantum induced a hadronic or electromagnetic reaction. The time of the reaction combined with this information allows to calculate the time–of–flight (TOFN) of the neutron (or gamma) on the 7.36 m distance between the target and the neutron detector. Therefore the accuracy of the time–of–flight depends on the neutron detector time resolution and the time resolution of the S1 counter. The neutral particle detector time resolution was determined to be 0.4 ns [91] which corresponds to the time of flight in the scintillator material for a gamma quantum on a distance of a size of a single module. The neutron path (l) is defined as the distance between the position of the centre of the target-beam overlap and the centre of the module which provided a signal as the first one. The accuracy of this measurement amounts approximately to half the size of the module which is cm. In case of neutrons the absolute value of the momentum (p) can be expressed as:
| (A.1) |
where denotes the mass of the neutron, stands for the distance between the target and the neutral particle detector and is the time–of–flight of the particle. Monte Carlo studies of the quasi-free reaction via the process have been performed in order to establish the momentum resolution of the neutron detector. A spectator neutron has been denoted as . This reaction was chosen since it could be identified in the data taken during previous COSY-11 measurements conducted with the deuteron beam [111], and hence the simulation results could have been corroborated by the experimental data [79]. The detection of both outgoing protons from the reaction proceeds via the well established method [62] and the spectator neutron is measured by the neutral particle detector [79].
Figure A.1 (left) presents the difference () between the generated neutron momentum () and the reconstructed neutron momentum from signals simulated in the detectors (). The value of () was calculated taking into account the time resolution of the neutral particle detector ( = 0.4 ns) [91] as well as the time resolution of the S1 counter ( = 0.25 ns) [77]. The time at which the proton hits the S1 detector is needed to determine the time of the reaction in the target place. The distribution of – for neutrons possessing a momentum of 1.6 GeV/c – was fitted by a Gaussian function resulting in a momentum resolution of = 0.14 GeV/c [79]. The accuracy of the mesurement is approximately independent of the momentum of neutron, however, the relative resolution for determining the neutron momentum alters significantly as its momentum changes. This fractional momentum resolution – which is shown in figure A.1 (right) as a function of the neutron momentum – is given by the equation:
| (A.2) |
where accounts for the time resolution of both the neutral particle and the S1 detectors. The result presented in figure A.1 was obtained assuming that = 0.4 ns, = 0.25 ns, and = 7.54 m. The value of corresponds to the distance between the target and the centre of the neutron detector.
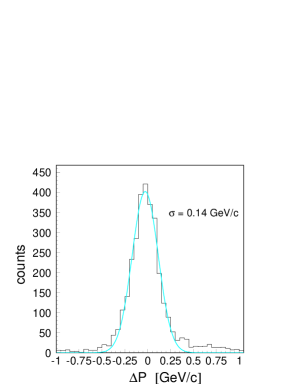
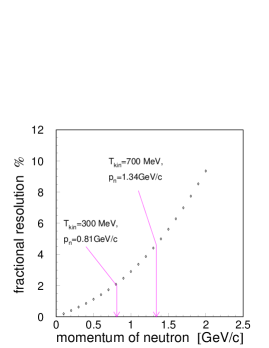
This fractional resolution depends on the neutron momentum and e.g. for the neutrons produced at threshold for the reaction ( = 0.76 GeV/c) it amounts to 2 and at threshold of the reaction ( = 1.06 GeV/c) it is equal to 3.2
Appendix B Parameterisation of the total cross section
In general the total cross section is defined as an integral of the probabilities to populate a given phase space interval over the whole kinematically available range normalised to the flux factor according to formula:
| (B.1) |
where denotes the production amplitude and is the phase space volume. Figure B.1 shows the total cross section for the reaction as a function of the excess energy. It is clearly seen that near thereshold the production strongly depends on the energy.
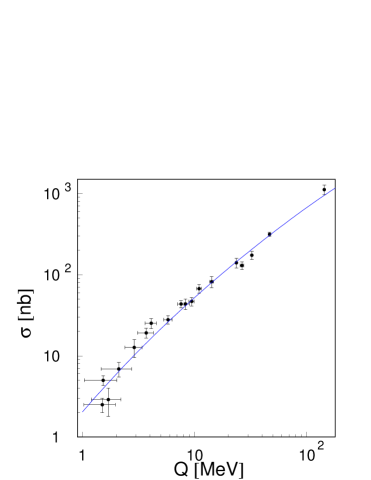
The solid line depicts a parameterisation of the total cross section utilizing a factorisation of the production matrix element into the short range primary amplitude and the initial and final state interaction. The proton-proton FSI has been taken into account according to the Fäldt and Wilkin model [44, 45] using the following formula:
| (B.2) |
where , and have to be determined from the data, and the triangle fuction [112] is defined as:
| (B.3) |
The function B.2 was fitted to the data and as a result values of the free parameters and have been obtained [113]:
MeV
mb
Applying the parameterisation from equation B.2 with known values of and one can compute the total cross section for the meson production at any value of the excess energy close to threshold.
At the end of this thesis, I would like to express my gratitude to a large number
of people without whom this work wouldn’t have been possible.
First of all, I want to express my profound gratitude to Prof. Paweł Moskal for the great help and invaluable advices toward bringing this dissertation to fruition, for the enourmous patience and for encouraging me to succeed in achieving high goals. It was a great pleasure but above all a honour to work with You, Paweł. You are an example to follow as a scientist and educator.
I would like to express my deeply gratitude to Prof. Walter Oelert for giving me the opportunity to work within the COSY-11 group. I am also indebt for comments, valuable advice and encouragement.
Less direct but not less important has been the inspiration of Dr. Steven D. Bass.
I have also benefited from the great help and advice of Dr. Rafał Czyżykiewicz.
I am also very grateful to Prof. Paweł Moskal, Prof. Walter Oelert, Prof. Jerzy Smyrski, Dr. Dieter Grzonka and Dr. Steven D. Bass for careful reading and correcting this manuscript.
I want to express my appreciation to my Friends and Colleagues from the COSY-11 group with whom I have the great fortune to interact and work.
Dziȩkujȩ mojej Mamie za wsparcie podczas tych kilku lat studiów i nieustanna̧ troskȩ. Dziȩkujȩ bratu Michałowi, że na mnie poczekał.
Za miłość, anielska̧ cierpliwość i ”doping” dziȩkujȩ mojemu kochanemu mȩżowi.
References
- [1] C. Amsler et al., Phys. Lett. B 667, 1 (2008).
- [2] D. Du, Y. Yang, G. Zhu, Phys. Rev. D 59, 014007 (1999).
- [3] P. Ball, J. M. Frere and M. Tytgat, Phys. Lett. B 365, 367 (1996).
- [4] H. Fritzsch, Phys. Lett. B 415, 83 (1997).
- [5] K. Nakayama et al., Phys. Rev. C 61, 024001 (2000).
- [6] L. P. Kaptari, B. Kämpfer, Eur. Phys. J. A 37, 69 (2008).
- [7] Xu Cao and Xi-Guo Lee, Phys. Rev. C 78, 035207 (2008).
-
[8]
P. Moskal, Habilitation thesis, Jagiellonian University, (2004),
e-Print: hep-ph/0408162. - [9] S. D. Bass, Phys. Scripta T 99, 96 (2002).
-
[10]
S. D. Bass, Acta Phys. Polon. B Proc. Supp. 2, 11 (2009),
e-Print: arXiv:0812.5047 [hep-ph]. - [11] S. D. Bass, Phys. Lett. B 463, 286 (1999).
- [12] H. Calén et al., Phys. Rev. C 58, 2667 (1998).
- [13] P. Moskal et al., Phys. Lett. B 474, 416 (2000).
- [14] A. Khoukaz et al., Eur. Phys. J. A 20, 345 (2004).
- [15] F. Balestra et al., Phys. Lett. B 491, 29 (2000).
- [16] P. Moskal et al., Phys. Rev. Lett. 80, 3202 (1998).
- [17] F. Hibou et al., Phys. Lett. B 438, 41 (1998).
- [18] M. Zieliński, Diploma thesis, Jagiellonian University, Jül-4277 (2008).
- [19] G. R. Kalbfleisch et al., Phys. Rev. Lett. 12, 527 (1964).
- [20] M. Goldberg et al., Phys. Rev. Lett. 12, 546 (1964).
- [21] F. J. Gilman and R. Kauffman, Phys. Rev. D 36, 2761 (1987).
- [22] J. L. Rosner, Phys. Rev. D 27, 1101 (1983).
- [23] A. Bramon, R. Escribano, M.D. Scadron, Eur. Phys. J. C 7, 271 (1999).
- [24] B. H. Behrens et al., Phys. Rev. Lett. 80, 3710 (1998).
- [25] C. P. Jessop et al., Phys. Rev. D 58, 052002 (1998).
- [26] G. Brandenburg et al., Phys. Rev. Lett. 75, 3804 (1995).
- [27] S. Weinberg, Phys. Rev. D 11, 3583 (1975).
- [28] G. ’t Hooft, Phys. Rev. Lett. 37, 8 (1976).
- [29] E. Witten, Nucl. Phys. B 156, 269 (1979).
- [30] G. Veneziano, Nucl. Phys. B 159, 213 (1979).
- [31] S. L. Adler, Phys. Rev. 177, 2426 (1969).
- [32] E. Kou, Phys. Rev. D 63, 054027 (2001).
- [33] D. Atwood and A. Soni, Phys. Lett. B 405, 150 (1997).
- [34] F. Ambrosino et al., Phys. Lett. B 648, 267 (2007).
- [35] G. M. Shore and G. Veneziano, Nucl. Phys. B 381, 23 (1992).
- [36] S. Ozuka, Phys. Lett. 5, 165 (1963).
- [37] G. Zweig, CERN Report No. TH412 (1964).
- [38] J. Iizuka, Prog. Theor. Phys. Suppl. 37–38, 21 (1966).
- [39] S. D. Bass, ”The spin structure of the proton”, World Scientific (2007).
- [40] J. Ashman et al., Phys. Lett. B 206, 364 (1988).
- [41] K. Nakayama et al., Phys. Rev. C 69, 065212 (2004).
- [42] P. Moskal et al., Phys. Rev. C 79, 015208 (2009).
- [43] R. Czyżykiewicz and P. Moskal, Acta Phys. Polon. B Proc. Supp. 2, 39 (2009), e-Print: arXiv:0905.2500 [nucl-ex].
- [44] G. Fäldt and C. Wilkin, Phys. Lett. B 382, 209 (1996).
- [45] G. Fäldt and C. Wilkin, Phys. Rev. C 56, 2067 (1997).
- [46] R. Czyżykiewicz et al., Phys. Rev. Lett. 98, 122003 (2007).
- [47] S. D. Bass, A. W. Thomas, Phys. Lett. B 634, 368 (2006).
- [48] P. Klaja, Ph.D. thesis, Jagiellonian University, (2009).
-
[49]
P. Moskal, M. Wolke, A. Khoukaz, W. Oelert,
Prog. Part. & Nucl. Phys. 49, 1 (2002). - [50] H. Calén et al., Phys. Rev. Lett. 79, 2642 (1997).
- [51] J. Stepaniak, H. Calén, Schriften des FZJ, Matter and Materials 21, 230 (2004).
-
[52]
S. Häggström, Ph.D. thesis, Uppsala University,
Acta Universitatis Upsaliensis 13, (1997). - [53] J. Smyrski et al., Phys. Lett. B 474, 182 (2000).
- [54] P. Moskal et al., Phys. Rev. C 69, 025203 (2004).
- [55] H. Calén et al., Phys. Lett. B 366, 39 (1996).
- [56] E. Chiavassa et al., Phys. Lett. B 322, 270 (1994).
- [57] A. M. Bergdolt et al., Phys. Rev. D 48, R2969 (1993).
- [58] F. Duncan et al., Phys. Rev. Lett. 80, 4390 (1998).
- [59] M. Abdel-Bary et al. Eur. Phys. J. A 29, 353 (2006).
- [60] M. Lacombe et al., Phys. Lett. B 101, 139 (1981).
- [61] E. Chiavassa et al., Phys. Lett. B 337, 192 (1994).
- [62] S. Brauksiepe et al., Nucl. Instr. & Meth. A376, 397 (1996).
- [63] P. Klaja et al., AIP Conf. Proc. 796, 160 (2005).
- [64] J. Smyrski et al., Nucl. Instr. & Meth. A541, 574 (2005).
- [65] R. Maier, Nucl. Instr. & Meth. A 390, 1 (1997).
- [66] .
-
[67]
H.-H. Adam et al., Proposal for WASA-at-COSY,
e-Print: nucl-ex/0411038 (2004). - [68] .
- [69] .
- [70] .
- [71] .
- [72] .
- [73] .
- [74] .
- [75] .
- [76] .
- [77] P. Moskal, Ph.D. thesis, Jagiellonian University, Jül-3685 (1998).
- [78] M. Wolke, Ph.D. thesis, Universität Bonn, Jül-3532 (1998).
-
[79]
J. Przerwa, Diploma thesis, Jagiellonian University, Jül-4141 (2004),
e-Print: hep-ex/0408016. - [80] R. Bilger et al., Nucl. Instr. & Meth. A 457, 64 (2001).
- [81] M. Sokołowski, FZJ Ann. Rep. 1990, IKP, Jül–4052, 219 (1991).
- [82] R. Czyżykiewicz, Diploma thesis, Jagiellonian University, Jül-4017 (2002).
- [83] J. Smyrski, FZJ Ann. Rep. 2004, IKP, Jül–4168, 11 (2005).
- [84] T. Rożek, Ph.D. thesis, University of Silesia, Jül-4184 (2005).
- [85] T. Rożek et al., Phys. Lett. B 643, 251 (2006).
- [86] P. Moskal, FZJ Ann. Rep. 1996, IKP, Jül–3365, 35 (1997).
- [87] P. Moskal et al., e-Print: nucl-ex/0311003 (2003).
- [88] P. Moskal et al., COSY Proposal No. 133 (2003).
- [89] P. Moskal, FZJ Ann. Rep. 2001, IKP, Jül-3978, 19 (2002).
- [90] T. Blaich et al., Nucl. Instr. & Meth. A 314, 136 (1992).
- [91] T. Rożek and P. Moskal, FZJ Ann. Rep. 2002, IKP, Jül–4052, (2003).
- [92] T. Rożek — private communication (2004).
-
[93]
William R. Leo, ”Techniques for Nuclear and Particle Physics Experiments”,
Springer; 2nd rev. ed. edition (1994). - [94] T. Tanimori et al., Nucl. Instr. & Meth. 216, 57 (1983).
- [95] K. Hagiwara et al., Phys. Rev. D 66, 010001 (2002).
- [96] CERN Application Software Group, GEANT 3.2, CERN Program Library Writeup Report No. W5013 (1994).
- [97] http://www.fluka.org
-
[98]
J. Zdebik, Diploma thesis, Jagiellonian University, Cracow (2008);
e-Print: arXiv:0811.1377 [physics.ins-det]. - [99] J. Klaja, P. Moskal and J. Zdebik, Acta Phys. Polon. B Proc. Supp. 2, 31 (2009), e-Print: arXiv:0902.3895 [nucl-ex].
- [100] H. Dombrowski et al., Nucl. Instr. & Meth. A 386, 228 (1997).
- [101] P. Moskal et al., Nucl. Instr. & Meth. A 466, 488 (2001).
- [102] P. Moskal et al., J. Phys. G 32, 629 (2006).
- [103] R. Machleidt et al., Phys. Rev. C 63, 024001 (2001).
- [104] D. Albers et al., Phys. Rev. Lett. 78, 1652 (1997).
- [105] A. J. Simon et al., Phys. Rev. C 48, 662 (1993).
- [106] H.-H. Adam et al., Phys. Rev. C 75, 014004 (2007).
- [107] P. Moskal and R. Czyżykiewicz, AIP Conf. Proc. 950, 118 (2007).
- [108] The CNS Data Analysis Center, http://www.gwu.edu.
- [109] B. Rejdych et al., AIP Conf. Proc. 950, 127 (2007).
- [110] A. Kupść, P. Moskal, M. Zieliński, e-Print: arXiv:0803.2673 (2007).
-
[111]
C. Piskor-Ignatowicz et al., Schriften des FZJ,
Matter Materials 21, 272 (2004). - [112] E. Byckling, K. Kajantie, ”Particle Kinematics”, John Wiley Sons Ltd. (1973).
- [113] P. Moskal et al., Int. J. Mod. Phys. A 22, 305 (2007).