Constrained simulations of the Local Group: on the radial distribution of substructures
Abstract
We examine the properties of satellites found in high resolution simulations of the local group. We use constrained simulations designed to reproduce the main dynamical features that characterize the local neighborhood, i.e. within tens of Mpc around the Local Group (LG). Specifically, a LG-like object is found located within the ’correct’ dynamical environment and consisting of three main objects which are associated with the Milky Way, M31 and M33. By running two simulations of this LG from identical initial conditions - one with and one without baryons modeled hydrodynamically - we can quantify the effect of gas physics on the population of subhaloes in an environment similar to our own. We find that above a certain mass cut, subhaloes in hydrodynamic simulations are more radially concentrated than those in simulations with out gas. This is caused by the collapse of baryons into stars that typically sit in the central regions of subhaloes, making them denser. The increased central density of such a subhalo, results in less mass loss due to tidal stripping than the same subhalo simulated with only dark matter. The increased mass in hydrodynamic subhaloes with respect to dark matter ones, causes dynamical friction to be more effective, dragging the subhalo towards the centre of the host. This results in these subhaloes being effectively more radially concentrated then their dark matter counterparts.
1 Introduction
In the current paradigm of structure formation, large objects such as galaxies or clusters, are believed to form hierarchically, or through a “bottom-up” (White & Rees, 1978) process of merging. Over dense peaks in the primordial density field collapse at high redshift due to gravitational instability and then merge with each other to form successively larger objects. N-body simulations of this process originally produced fairly smooth cold dark matter (CDM) halos (Frenk et al., 1985; Davis et al., 1985) homogenized by poor resolution. More recently, studies exploiting high resolution simulations have managed to resolve a wealth of sub-galaxy sized substructures (subhaloes) that can survive the violent processes associated with merging (Ghigna et al., 1998; Klypin et al., 1999; Moore et al., 1999; Bullock et al., 2000; Springel et al., 2001; Stoehr et al., 2002; Gao et al., 2004; Gill et al., 2004).
High resolution numerical simulations that resolve substructures can be computationally expensive, and many authors choose to simulate just the gravitational forces, modeling the baryons semi-analytically (e.g. Cole et al., 2000; Bower et al., 2006). Alternatively, baryons may be modeled hydrodynamically (Katz & Gunn, 1991; Navarro & Benz, 1991; Katz, 1992; Navarro & White, 1994; Kravtsov et al., 1997), with the advantage that the thermal state of the intergalactic medium may be directly calculated. The inclusion of baryons affects the background dark matter: Blumenthal et al. (1986) showed that dissipative baryons will lead directly to the adiabatic contraction of the halo (see also Gnedin et al., 2004) and are thus a critical ingredient in determining halo and subhalo properties.
More recently a number of authors have examined these effects - gas dissipation and star formation - on galaxy and cluster sized halos (Bailin et al., 2005; Sommer-Larsen & Limousin, 2009; Romano-Diaz et al., 2009). A number of studies have also looked at the effect on substructure. Nagai & Kravtsov (2005) noted that the radial distribution of substructures in Adaptive Mesh Refinement simulations was less concentrated than both the radial distribution of subhaloes in dark matter only runs (see also Diemand et al., 2004; Gao et al., 2004) as well as the dark matter itself. Nagai & Kravtsov (2005) ruled out numerical resolution as the cause showing that this bias was caused by the tidal stripping (of dark matter) from a subhalo’s outer regions: the bias disappears if subhaloes are chosen according to their mass at accretion. Furthermore, Macciò et al. (2006) simulated a Galactic mass halo twice - once with baryons using Smooth Particle Hydrodynamics (SPH) and once with just dark matter in order to study the effect of baryons on lensing. They found that owing to adiabatic contraction in the dense cores of subhaloes, their SPH run produced an over abundance of subhaloes in the inner regions of the halo as well as an increase by a factor of 2 in the absolute number of subhaloes with respect to the dark matter run. Finally, Weinberg et al. (2008) examined the effect of baryons on substructures of group and cluster sized () halos with a more statistical approach. By running the same simulation with and without gas dynamics, they found an overall good agreement between the positions and mass function of subhaloes across a large dynamical range with the two different techniques. Like previous studies, they also found that the baryons steepen the potential well of both the host and subhaloes, making the core of the substructure more resistant to tidal stripping, resulting in the relative depletion of dark matter subhaloes towards the centre.
Baryonic substructure may effect the central DM distribution in a different way. Satellites crossing the central part of their host halo loose energy due to dynamical friction. This energy is being deposited in the DM component, leading to ’heating’ of the DM and consequently this may lead to the softening of the central DM cusp (El-Zant et al., 2001; El-Zant et al., 2004). This has been supported by the full galaxy formation simulations of Romano-Díaz et al. (2008); Romano-Diaz et al. (2009) and Johansson et al. (2009).
One of the main new feature of the present study is that it is based on constrained simulations of the local universe, where ’local’ means a few tens of Mpc around the LG. We designed our simulation’s initial conditions by imposing constraints derived from observational data of the LG’s environment; specifically we use surveys of galaxy peculiar velocities and the distribution of nearby X-ray selected clusters of galaxies. The result is a simulations of a ‘LG’ that sits within the proper dynamical environment. This includes the correct motion and position of the Local Supercluster, the Virgo and Coma clusters and the Great Attractor. The main virtue in using constrained simulations is that it provides a numerical laboratory for testing the formation of the local universe, and in particular the Local Group, in a numerical environment that closely matches our actual neighborhood. Thus, much of the cosmic scatter involved in comparing unconstrained simulations with specific cosmological objects, is removed.
Other studies typically examine the effect of baryons in either cluster sized halos (Nagai & Kravtsov, 2005; Weinberg et al., 2008) or in a random Milky Way sized halo (Macciò et al., 2006). We have extended previous work (Nagai & Kravtsov, 2005; Macciò et al., 2006; Weinberg et al., 2008) by examining with improved mass and force resolution the the effect of baryons on substructures in three galactic halos that resemble the Local Group.
We study how the effect of dynamical friction is affected by the relative difference in the tidal mass loss of a substructure with and without gas-dynamics. By using two simulations - one with and one without gas dynamics - we are able to determine where and how the trajectories and properties of the same subhalo in the two different runs diverges. Our simulations also have unprecedented mass and force resolution, an improvement on previous work of between 1 and 2 orders of magnitude. We have tuned our simulations to make it very easy to identify matching subhaloes in both simulations. We thus follow in detail how the stripping of an individual subhalo is effected by the presence of baryons and how the stripped subhalo is then affected by dynamical friction.
2 Methods
In this section we describe how the simulation were constrained and run, the method we have employed to identify substructures in each run and how we match SPH subhaloes to DM ones.
2.1 Initial Conditions
In this section we describe how we generated our constrained initial conditions. The simulations used in this paper are part of the CLUES (Constrained Local UniversE Simulations) project111http://clues-project.org whose main goal is to run simulations that mimic as accurately as permitted by current observations, the formation of the Local Universe from cosmological initial conditions.
The following procedure is employed in generating constrained simulations of the LG. We use as observational constraints peculiar velocities drawn from the MARK III (Willick et al., 1997), SBF (Tonry et al., 2001) and the local volume (Karachentsev et al., 2004) galaxy catalogs and the position and virial properties of nearby X-ray selected clusters of galaxies (Reiprich & Böhringer, 2002). The Hoffman-Ribak algorithm (Hoffman & Ribak, 1991) is used to generate the initial conditions as constrained realizations of Gaussian random fields on a mesh. These are used to perform a few low resolution DM-only N-body simulations. It should be noted that the environmental restrictions do not constrain the properties (e.g. position relative to eachother, mass, etc) of LG members explicitly. Hence the low resolution simulations are searched and the one with the most suitable LG-like object is chosen for follow up, high resolution re-simulation. High resolution extension of the low resolution constrained realizations are obtained by creating an unconstrained realization at the desired resolution, FFT-transforming it to k-space and substituting the unconstrained low k modes with the constrained ones. The resulting realization is made of unconstrained high k modes and constrained low k ones.
2.2 The Simulations
In this section we explain details of the simulation run and, for the gas dynamical simulation, the rules we employed for star formation and feedback. We choose to run our simulations using standard CDM initial conditions, that assume a WMAP3 cosmology (Spergel et al., 2007), i.e. , , . We use a normalization of and a slope of the power spectrum. We used the PMTree-SPH MPI code GADGET2 (Springel, 2005) to simulate the evolution of a cosmological box with side length of .
We resimulate the region of interest in our simulation according to the following recipe. At , we represent the linear power spectrum by particles of mass . We use a Fourier transform of the constrained density field to substitute the overlapping Fourier modes in to the otherwise random realization. Following Klypin et al. (2001), we reduce the total number of particles. Thus, within a lower resolution simulation of particles, we identify the position of the model local group, which closely resembles that of the real Local Group. We then resimulate the evolution of this region of interest, using the full resolution (equivalent to effective particles) within a sphere of just . Outside this region, the simulation box is populated with lower resolution (i.e higher mass) particles. We are thus able to achieve high resolution in the region of interest, while maintaining the correct external environment. The initial conditions were set up by applying the Zeldovich approximation at to avoid spurious effects due to cell crossing in the high resolution area.
We use the same set of initial conditions to run two simulations, one with dark matter only and another one with dark matter, gas dynamics, cooling, star formation and supernovae feedback. We shall call these two simualtions DM and SPH, respectively. In our SPH simulation, each high resolution dark matter particle was replaced by an equal mass, gas - dark matter particle pair with a mass ratio of roughly 1:5. In so doing we chose to identify the dark matter particles in both runs with the same ID in order to simplify the analysis. Numerical parameters of our simulations are summarized in Table 1.
| DM: | ||||
|---|---|---|---|---|
| SPH : |
For the gas dynamical SPH simulation, we follow the feedback and star formation rules of Springel & Hernquist (2003) which we briefly describe here. The interstellar medium (ISM) is modeled as a two phase medium composed of hot ambient gas and cold gas clouds in pressure equilibrium. The thermodynamic properties of the gas are computed in the presence of a uniform but evolving ultra-violet cosmic background generated from QSOs and AGNs and switched on at (Haardt & Madau, 1996). Cooling rates are calculated from a mixture of a primordial plasma composition. No metal dependent cooling is assumed, although the gas is metal enriched due to supernovae explosions. Molecular cooling below is also ignored. Cold gas cloud formation by thermal instability, star formation, the evaporation of gas clouds, and the heating of ambient gas by supernova driven winds are assumed to all occur simultaneously.
For each star formation event, energy and metals are re-injected into the ISM instantaneously. Star formation is treated in a stochastic way and the parameters of the model are selected to reproduce the Kennicut law for spiral galaxies (Kennicutt, 1983, 1998). In order to prevent excessive star formation events eminating from the same SPH particle, we allow each gas particle to spawn at most just two generations of stars. Thus when a star particle is formed, the mass per star is half that of the progenitor gas particle, whose own mass is reduced accordingly.
In order to reproduce spiral disk galaxies, we assume kinetic feedback in the form of strong winds driven by stellar explosions. We use the stochastic approach developed by Springel & Hernquist (2003). SPH particles close to the star forming regions will participate in the wind in a probabilistic way that is proportional to the star formation rate and the amount of supernova energy released by massive stars. We assume that a fraction of of stars will explode as supernovas. A fraction of this energy is used to energize (kick) particles in the high density regions surrounging sites of star formation. This removes low angular momentum gas from the center of dark halos, and, by inhibiting the overcooling problem, contributes to the formation of extended gaseous disk.
We have tested this mechanism and found it to be vital in the production of stable disks containing both gas and stars in our simulated halos. The same simuations run with only thermal feedback and without winds, are not able to create disks at all - rather the baryons and end up as a feautureless spheroid of gas and stars (e.g. see Okamoto et al., 2005, and references therein). We note, that the size (extent) of the simulated disks are related to the resolution of our simulations. We have run a second simulation from the same initial conditions and with identical star formation and feedback rules but with lower mass resolution ( instead of effective particles: that is, with particles that are 8 times more massive). In this low resolution run, we find that the stellar disks that were produced were thicker and smaller. A detailed analysis of the results from these simulations will be reported in Yepes et al 2009 (in prep).
| Mtot | rvir | Np | Nsats | ||
|---|---|---|---|---|---|
| DM: MW : | 6.57 | 230.84 | 1808918 | - | 13 |
| M31 : | 8.17 | 248.26 | 2249954 | - | 29 |
| M33 : | 3.21 | 181.96 | 885833 | - | 7 |
| SPH: MW : | 5.71 | 220.40 | 1745996 | 0.08 | 20 |
| M31 : | 7.81 | 244.58 | 2288039 | 0.12 | 26 |
| M33 : | 2.90 | 175.71 | 856820 | 0.11 | 8 |
The constrained simulations studied here are zoomed on a LG-like object whose three main galaxies - the Milky Way (MW), M31 and M33 - were reproduced with masses in good agreement with the latest mass estimates of these objects as reported in the literature (see Klypin et al., 2002; Xue et al., 2008; Seigar et al., 2008, and references therein). In Table 2 we give the characteristic properties of each local group halo for both our DM and SPH run. Note that the halos’ virial radii (and therfore their virial masses) are not identical in the two runs. This is due to the adiabatic contraction of the baryons in the SPH run which results in a denser core and therefore a smaller virial radius. Moreover, the total mass is reduced due to the lower baryon fraction compared with the cosmic mean. If we choose to calculate the mass within some fixed radius in both simulations (e.g. the average virial radius) and correct for the reduced baryon fraction, we obtain halo masses in the two simulations consistent with eachother to within a few percent.
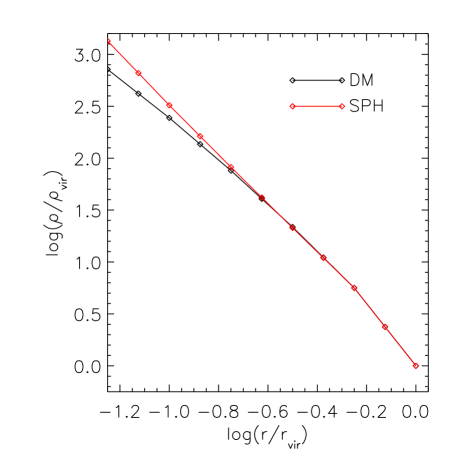
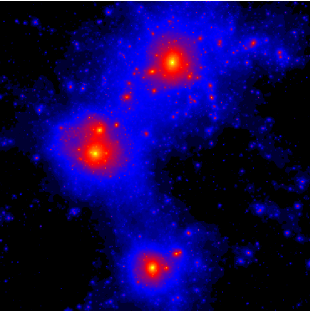
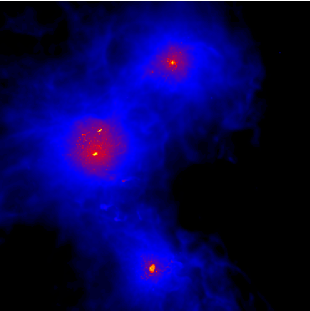
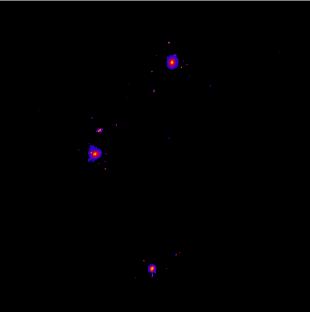
In Fig. 1, we plot the matter distribution of the three main components of our local group SPH simulation. We plot the smoothed density of the dark matter, the gas and the stars. It is interesting to note that the dark matter distribution in the DM run is the same as the dark matter distribution in the SPH run for the entire halo except for the inner most regions. Only within around does the condensation of baryons in the halo’s center significantly alter the underlying distribution of dark matter particles. The total matter distribution in the two runs however, differs on a slightly larger scale. In Fig. 2 we show the mean interior density profile averaged over our three halos in our two simulations. Across most of the halo’s radius the density profiles are the same: only within does the total density profile in the SPH simulation rise significantly above the DM one222We note however, that in the analysis that follows few of our subhaloes penetrate the region, , where the potential is significantly different in the SPH run..
2.3 Identification of Halos and Subhaloes
In this section, we explain how our halo and subhalo finding algorithm works. In order to identify halos and subhaloes in our simulation we have run the MPI+OpenMP hybrid halo finder AHF (AMIGA halo finder, to be downloaded freely from http://popia.ft.uam.es/AMIGA) described in detail in Knollmann & Knebe (2009). AHF is an improvement of the MHF halo finder (Gill et al., 2004), which locates local over-densities in an adaptively smoothed density field as prospective halo centers. The local potential minima are computed for each of these density peaks and the gravitationally bound particles are determined. Only peaks with at least 20 bound particles are considered as haloes and retained for further analysis. We would like to stress that our halo finding algorithm automatically identifies haloes, sub-haloes, sub-subhaloes, etc. For more details on the mode of operation and actual functionality we refer the reader to the code description paper (Knollmann & Knebe, 2009).
For each halo, we compute the virial radius , that is the radius at which the density drops below . Here is the cosmological background matter density. The threshold is computed using the spherical top-hat collapse model and is a function of both cosmological model and time. For the cosmology that we are using, at .
Subhaloes are defined as haloes which lie within the virial radius of a more massive halo, the so-called host halo. As subhaloes are embedded within the density of their respective host halo, their own density profile usually shows a characteristic upturn at a radius , where would be their actual (virial) radius if they were found in isolation.333Please note that the actual density profile of subhaloes after the removal of the host’s background drops faster than for isolated haloes (e.g. Kazantzidis et al., 2004); only when measured within the background still present will we find the characteristic upturn used here to define the truncation radius . We use this “truncation radius” as the outer edge of the subhalo and hence subhalo properties (i.e. mass, density profile, velocity dispersion, rotation curve) are calculated using the gravitationally bound particles inside the truncation radius . For a host halo we calculate properties using the virial radius .
We build merger trees by cross-correlating haloes in consecutive simulation outputs. For this purpose, we use a tool that comes with the AHF package and is called MergerTree. As the name suggests, it serves the purpose of identifying corresponding objects in the same simulation at different redshifts. We follow each halo (either host or subhalo) identified at redshift backwards in time, identifying as the main progenitor (at the previous redshift) the halo that both shares the most particles with the present halo and is closest in mass (see Eq. 1). The latter criterion is important for subhaloes given that all their particles are also typically bound to the host halo, which is typically orders of magnitude more massive. Given the capabilities of our halo finder AHF and the appropriate construction of a merger tree, subhaloes will be followed correctly along their orbits within the environment of their respective host until the point where they either are tidally destroyed or directly merge with the host.
2.4 Matching Halos in the two simulations
In this section we describe how we match subhaloes in our SPH simulation to DM “sister” subhaloes. Our simulations are set up such that the identifiers (ids) of dark matter particles are the same in both simulation. This allows us to locate which SPH subhalo corresponds to a specific DM subhalo. For a given SPH subhalo we locate the DM subhalo which contains both the greatest fraction of its dark matter particles and which is closest to it in mass. We call this DM halo, the SPH subhalo’s “sister”. Specifically, for each dark matter halo candidate we calculate a merit , defined as
| (1) |
where is the number of particles found in both subhaloes, is the number of particles in the DM sister candidate and is the number of particles in the SPH subhalo. We then identify the sister as that halo with the largest value of . Typically, successfully matches result in and we assume to have failed to find a dark matter sister if for a given sph subhalo.
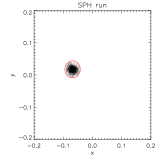
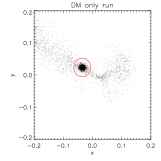
We demonstrate how our sister finding algorithm works in Fig. 3 for one specific subhalo. The dark matter particles in the DM run with the same ids as the dark matter particles belonging to an SPH subhalo are found extended in the DM run. However, despite being extended, often enough of these particles clump together in one single subhalo, albeit with other dark matter particles not found in the SPH subhalo. We take as the DM “sister”, the entire subhalo that shares the most particles with the SPH subhalo.
If we wanted to, we could have tried to find sisters by doing the reverse: locating particles that belong to a substructure in the DM simulation, in the SPH simulation, and finding which SPH subhalo hosts the most of them. The resulting matches are equivalent.
It is interesting to note that our failure to match an SPH subhalo to a DM one is not a strong function of radius. Although more such failures to match occur at smaller radii of (owing to the complete destruction of the DM subhalo, i.e. Nagai & Kravtsov, 2005), beyond the distribution of Merit values (i.e. Eq. 1) is uniform. This implies that although the complete destruction of a DM subhalo may be responsible for the steepening of the density profile of substructure in the inner most parts (i.e. within ), it cannot explain the fact that SPH subhaloes are more radially concentrated across the halo’s full virial radius.
3 Results
In this section we explain how baryons effect the properties of substructures in our two simulations. Since, as mentioned in Sec. 2.3, we catalogue all bound objects composed of more than 20 particles, the vast majority of substructures in each of the three local group objects, have very low mass. Since particle mass is not constant in SPH runs (due to star formation and feedback processes) it is incorrect to compare the full sub-halo population found in our DM simulation with that found in the SPH run. In order to compare like with like, we make a mass cut, comparing only the most massive of the subhaloes. We select subhaloes whose mass is , which roughly corresponds to subhaloes with more than 1000 particles. A total of around subhaloes of our three main objects meet this cut in both simulations. This mass cut was chosen to obtain roughly the same number of satellites as seen orbitting about the Milky Way.
In Fig. 4 we show the cumulative radial profile of substructures in our two simulations at . We make two different mass cuts, one considering the mass of a substructure, and a second (following Nagai & Kravtsov, 2005) which considers the subhalo’s mass at infall. In order to compare the same number of satellites, we consider the position of only those satellites which at infall where more massive then .
What is strikingly apparent from Fig. 4, is that the SPH substructures are significantly more radially concentrated than the DM ones. This feature is irrespective of which mass cut we look at, although the trend is stronger when considering the mass cut. For example, within 0.5 we find of SPH substructures compared with just DM ones. This result in consistent with that of Weinberg et al. (2008), who compared the radial distribution of much more massive substructures () in more massive systems () in dark matter only and SPH simulations of galaxy groups.

The tendency for SPH subhaloes to be more radially concentrated at weakens with increasing redshift. Beyond , the presence of baryons has little discernible effect on the radial concentration of subhaloes and the DM and SPH simulations return subhaloes with nearly identical radial distributions. Indeed, as we go to higher redshifts we find that all SPH and DM subhaloes are less radially concentrated.
Fig. 4 indicates that SPH subhaloes are more centrally concentrated than DM ones. Since we are able to match subhaloes in both simulations, we can examine the difference in radial position of an individual DM - SPH subhalo pair. In Fig. 5 we show the difference in the radial position of two sister halos as a function of the SPH subhalo’s radial position.

By examining how the difference in position changes with radius, Fig. 5 indicates that the higher radial concentration of SPH subhaloes seen in Fig. 4 is due to a relative depletion of DM sisters in the inner parts of the halo. Beyond 0.4 DM sisters and SPH subhaloes are located at roughly the same radial distances. Within this radius however, DM sisters have not dissapeared (by falling below the mass cut). Rather, they are simply located up to 3 times further out, for SPH subhaloes located at , and up to 1.5 times further out for those located at .
The scarcity of DM subhaloes in the inner parts of the host halo is due to the subtle changes to the substructures potential well caused by the presence of baryons. In particular, the deepening of the potential well due to a cold baryonic component will directly impact the two main physical processes affecting a substructure’s dynamics: dynamical friction and tidal stripping of substructure material.
The dynamical friction time scale goes as , (e.g. Ostriker & Tremaine, 1975; Binney et al., 2009) implying that the most massive subhaloes are those whose orbit’s should lose the most energy and are therefore most likely to in spiral and be found in the inner parts of the host. Yet tidal stripping causes to decrease, making the satellite less susceptible to the dynamical friction.

The amount of material stripped can be quantified by looking at the ratio of the mass retained at to the mass a satellite had when it was accreted. In Fig. 6 we plot this ratio for SPH satellites versus the matched DM sisters. Rather than sitting directly on the diagonal line indicating equal amounts of tidal stripping, nearly all DM - SPH subhalo pairs sit in the triangular lower half of Fig. 6 indicating that the DM sister lost more mass than the SPH subhalo since accretion. In some cases the difference is extreme, with subhaloes in SPH losing half their mass and their dark matter sister losing 99 % of their infall mass by . Although a handful of SPH subhaloes have retained less than their dark matter sisters, the fraction of all subhaloes for which this is true is small () and the relative mass loss is not as extreme.
We have seen from Fig. 6 that DM subhaloes are more likely to retain less of their infall mass by . Yet if our hypothesis is correct - that those DM subhaloes that have suffered the most tidal stripping have consequently suffered less dynamical friction - we should expect to see a correlation between the amount of mass retained and the position in the halo at . Indeed, those SPH halos that manage to fall into the centre of the halo - leaving their DM sisters behind in the outer regions of the halo - are also those whose DM sisters have lost the most mass. In other words, when a subhalo falls into a host halo, if it falls in early enough and if its orbit is such that it will lose mass due to tidal stripping, the stripping of the DM will decrease the dynamical friction on the DM subhalo, allowing the SPH subhalo to penetrate to the centre while leaving the DM subhalo behind. This notion can be tested by looking at the satellite’s energy as a function of time. When comparing the energy loss of a SPH-DM satellite pair, we find that the DM subhalo has indeed lost more orbital energy, although the relative difference in energy loss is moderate ().

We can see this behavior explicitly in Fig. 7 where we plot the difference in the radial position between SPH and DM subhaloes as a function of the ratio of the infall mass that is retained by each subhalo . It is interesting to note that the -axis of Fig. 7 extends to implying that very few SPH subhaloes lose more mass then their DM sisters. The amount of mass lost by a DM subhalo is well correlated with the difference in radial position, with pairs that are close together having lost similar amounts of mass, while for those spread far apart (i.e. where ) indicate that the DM subhalo has retained only of the mass retained by the SPH subhalo.


We now follow in detail one specific SPH - DM sister subhalo pair, in order to highlight the salient aspects that are effected by tidal stripping and dynamical friction. We have specifically chosen a subhalo which can be used as an exemplary illustration for this purpose. The mass of this subhalo, is typical of satellites in our sample, and was accreted at , an unexceptional redshift. In Fig. 8 we show the mass of this subhalo as function of redshift (since accretion) onto the main halo. The DM sister (dashed line) closely follows the SPH subhalo’s mass for a short period directly after accretion. However, by the DM halo has already lost a good more then its SPH counterpart. Although the subhalo in both runs loses mass due to tidal stripping, by the DM sister has lost of its infall mass, while the SPH subhalo has only lost of its infall mass.
We may compare the mass loss presented in Fig. 8 with the radial distance from the centre of the main halo. In Fig. 9 we show the orbit of this subhalo as a function of redshift. Although the orbits at infall are identical, they start to diverge shortly thereafter. By the first pericentric passage, the SPH subhalo manages to penetrate further in (by about a factor of 2) than the DM sister. Similarly, at apocentre the DM halo is further away then the SPH subhalo. The DM sister is consistently further behind the SPH subhalo at all stages of the orbit, resulting in the SPH subhalo being nearly a factor of 2 closer then the DM subhalo at .
Tidal stripping is most likely to dislodge loosely bound material on a subhaloes periphery, where any change in the host’s potential can have the greatest effect. Peñarrubia et al. (2008) showed that tidal debris fields that pre and succeed a subhalo on its orbit are composed mostly of particles depleted from this peripheral region. Since the cold baryons in our subhaloes have all collapsed to the centre of the clump’s potential before accretion, we except that the stripped material will be composed of a mixture of DM and hot gas particles, loosely bound to the subhalo. Indeed the baryon fraction of this subhalo increases as material is stripped from it. By the baryon fraction has risen by a factor of more than three compared with its baryon fraction at infall (not explicietely shown here). Since the total mass of the subhalo has decreased yet the baryon fraction has increased, we are led to the conclusion that the stripped material was mostly DM.
4 Conclusions and Discussion
In this paper, we have examined the effect of dissipative baryons - treated hydrodynamically with sophisticated rules for star formation and feedback - on halo substructure. We have extended the work of previous authors (Nagai & Kravtsov, 2005; Macciò et al., 2006; Weinberg et al., 2008) to include not just a statistical description of the entire subhalo population, but a detailed study of how a single SPH subhalo behaves differently than its DM counterpart. Our simulations bring a new approach to the study of the LG and the nearby universe. The simulations are constrained to reproduce the local environment, thereby enabling the testing of the processes of galaxy formation in a controlled environment that closely resembles the observed nearby universe. The present simulations also surpass previous studies in mass and force resolution.
We use our simulations to examine the radial distribution of subhaloes. We find that subhaloes located in the inner parts of thier hosts and above a certain mass cut are more concentrated at in the SPH simulation than in the DM one. The difference in radial distribution between DM and SPH subhaloes above a certain mass at a given epoch, decreases with higher redshift, such that by z=0.75 the two populations have similar distributions. The difference in radial distribution weakens if subhaloes are selected according to infall mass (rather than mass) but it does not - as suggested by Nagai & Kravtsov (2005) who looked at clusters 3 orders of magnitude more massive - completely disappear.
The relative suppression of dark matter subhaloes located in the central regions of a host, is in part due to their susceptibility to tidal forces. As suggested by Nagai & Kravtsov (2005), the disintegration of DM subhaloes in the inner parts of the host halo is in part responsible for their reduced numbers there. SPH subhaloes, with cold dense baryons in their centres, are able to inhibit the amount of material tidally stripped and thus hold on to more material. Any material that is stripped off an SPH subhalo, tends to originate in the outer regions of the subhalo and is therefore mostly composed of dark matter - little baryonic material is stripped.
Since DM subhaloes lose more mass, they are also less likely to lose orbital energy due to dynamical friction. Our results suggest that although the DM subhaloes lose more mass due to tidal stripping, the (relatively) more massive SPH subhaloes spiral into the central region of the host. For a DM-SPH subhalo pair, this results in widely separated subhaloes.
However, if tidal stripping is not particularly effective, dark matter subhaloes trace their SPH sisters. This principally occurs when subhaloes are orbiting in the outer parts of the halo. In the inner parts, the SPH subhaloes are typically closer to the centre of the host than their dark matter sisters. The final masses of two sisters can differ wildly due to the vastly different histories each subhalo has had since accretion. Dark matter subhaloes almost always lose more mass than an SPH one, reflecting their more feeble nature.
Our results are important for any study of substructures in dark matter only simulations that focus on the inner parts of the host halos. For example, Xu et al. (2009) performed an indepth study on the anomalous flux ratios observed with strong lensing of background QSOs. Using the Aquarius simulation they found that too few subhaloes exist in the central regions to account for the observed anomalies. Yet they qualify their study by explicitely stating that the increased survivability of subhaloes due to the presence of baryons will have an unknown effect on their results. Our work indicates that the effect of baryons may be important for massive subhalos that have small pericentric distances.
Our results are important for semi-analytical models of galaxy formation which use merger trees extracted from pure dark matter simulations to calculate the properties of satellite galaxies (e.g. Libeskind et al., 2005). In these cases, dark matter subhaloes are often destroyed by tides earlier then they would be if hydrodynamics were also included. Thus, it is important to bear in mind that the mass of a DM subhalo located towards the centre, will be routinely underestimated. Any semi-analytical model that uses the mass of a subhalo extracted from a dark matter simulation to make predictions on the properties of the satellite galaxy it hosts, will suffer from this systematic effect.
The results of Nagai & Kravtsov (2005) indicate that the bias towards more radially concentrated subhalo distributions disappears when subhaloes are selected according to any property that is unaffected by the processes associated with accretion, such as their maximum circular velocity. We test this hypothesis by looking at the radial distributions of subhaloes chosen according to infall mass (a proxy for circular velocity) and find that although minimized (particularly in the inner parts of the halo where the difference in radial concentration is largest), the bias still exists.
The disruption and tidal stripping of satellites has recently been addressed by a number of studies. Using controlled dark matter only simulations and modeling the baryons in an idealized manner, D’Onghia et al. (2009) argue that the dominant mechanism in destroying substructures in the inner regions of a galactic halo is tidal shocking. However, their results fail to incorporate the full adiabatic effect of baryons on the potential well of substructures. Being purely dark matter, their substructures are more fragile and thus less able to hold onto their material. Our results are in agreement with Romano-Diaz et al 2008, who found that the number of substructures within in the SPH case exceeds the number in the pure DM case by almost a factor of two.
Again, in the context of pure dark matter simulations, Wetzel & White (2009) looked at the disruption of satellites. They found that the most disrupted satellites reside towards the centre of the halo, in agreement with this work (see. Fig. 7).
Although our study is focused on the constrained simulations of the local group, it is difficult to compare our work with measurements of the radial concentration of the Milky Way’s satellite population, because of the limiting biases in the observations. The Sloan Digital Sky Survey, which increased the number of satellites in the Milky Way’s halo by a factor of two (see Koposov et al., 2008, and references therein) covers a just a single patch of sky. Additionally, this area may be biased as it points towards Virgo: a direction that may have an over abundance of substructures. However, as future sky surveys such as LSST and Pan-Starrs reveal to us a more complete satellite populations, we will obtain a better understanding of the nature of the spatial distribution of the companions of the Milky Way.
Acknowledgments
NIL is supported by the Minerva Stiftung of the Max Planck Gesellschaft. AK is supported by the MICINN through the Ramon y Cajal programme. GY would like to thank also MEC (Spain) for financial support under project numbers FPA2006-01105 and AYA2006-15492-C03. The simulations were performed and analyzed at the Leibniz Rechenzentrum Munich (LRZ) and at the Barcelona Supercomputing Center (BSC). We thank DEISA for giving us access to computing resources in these centers through the DECI projects SIMU-LU and SIMUGAL-LU. We acknowledge the LEA Astro-PF collaboration and the ASTROSIM network of the European Science Foundation (Science Meeting 2387) for the financial support of the workshop “The local universe: from dwarf galaxies to galaxy clusters” held in Jablonna near Warsaw in June/July 2009, where part of this work was done.
References
- Bailin et al. [2005] Bailin J., Kawata D., Gibson B. K., Steinmetz M., Navarro J. F., Brook C. B., Gill S. P. D., Ibata R. A., Knebe A., Lewis G. F., Okamoto T., 2005, ApJL, 627, L17
- Binney et al. [2009] Binney J., Tremaine S., Freeman K., 2009, Physics Today, 62, 050000
- Blumenthal et al. [1986] Blumenthal G. R., Faber S. M., Flores R., Primack J. R., 1986, ApJ, 301, 27
- Bower et al. [2006] Bower R. G., Benson A. J., Malbon R., Helly J. C., Frenk C. S., Baugh C. M., Cole S., Lacey C. G., 2006, MNRAS, 370, 645
- Bullock et al. [2000] Bullock J. S., Kravtsov A. V., Weinberg D. H., 2000, ApJ, 539, 517
- Cole et al. [2000] Cole S., Lacey C. G., Baugh C. M., Frenk C. S., 2000, MNRAS, 319, 168
- Davis et al. [1985] Davis M., Efstathiou G., Frenk C. S., White S. D. M., 1985, ApJ, 292, 371
- Diemand et al. [2004] Diemand J., Moore B., Stadel J., 2004, MNRAS, 352, 535
- D’Onghia et al. [2009] D’Onghia E., Springel V., Hernquist L., Keres D., 2009, ArXiv e-prints
- El-Zant et al. [2001] El-Zant A., Shlosman I., Hoffman Y., 2001, ApJ, 560, 636
- El-Zant et al. [2004] El-Zant A. A., Hoffman Y., Primack J., Combes F., Shlosman I., 2004, ApJL, 607, L75
- Frenk et al. [1985] Frenk C. S., White S. D. M., Efstathiou G., Davis M., 1985, Nature, 317, 595
- Gao et al. [2004] Gao L., White S. D. M., Jenkins A., Stoehr F., Springel V., 2004, MNRAS, 355, 819
- Ghigna et al. [1998] Ghigna S., Moore B., Governato F., Lake G., Quinn T., Stadel J., 1998, MNRAS, 300, 146
- Gill et al. [2004] Gill S. P. D., Knebe A., Gibson B. K., 2004, MNRAS, 351, 399
- Gill et al. [2004] Gill S. P. D., Knebe A., Gibson B. K., Dopita M. A., 2004, MNRAS, 351, 410
- Gnedin et al. [2004] Gnedin O. Y., Kravtsov A. V., Klypin A. A., Nagai D., 2004, ApJ, 616, 16
- Haardt & Madau [1996] Haardt F., Madau P., 1996, ApJ, 461, 20
- Hoffman & Ribak [1991] Hoffman Y., Ribak E., 1991, ApJL, 380, L5
- Johansson et al. [2009] Johansson P. H., Naab T., Ostriker J. P., 2009, ApJL, 697, L38
- Karachentsev et al. [2004] Karachentsev I. D., Karachentseva V. E., Huchtmeier W. K., Makarov D. I., 2004, AJ, 127, 2031
- Katz [1992] Katz N., 1992, ApJ, 391, 502
- Katz & Gunn [1991] Katz N., Gunn J. E., 1991, ApJ, 377, 365
- Kazantzidis et al. [2004] Kazantzidis S., Mayer L., Mastropietro C., Diemand J., Stadel J., Moore B., 2004, ApJ, 608, 663
- Kennicutt [1983] Kennicutt Jr. R. C., 1983, ApJ, 272, 54
- Kennicutt [1998] Kennicutt Jr. R. C., 1998, ApJ, 498, 541
- Klypin et al. [2001] Klypin A., Kravtsov A. V., Bullock J. S., Primack J. R., 2001, ApJ, 554, 903
- Klypin et al. [1999] Klypin A., Kravtsov A. V., Valenzuela O., Prada F., 1999, ApJ, 522, 82
- Klypin et al. [2002] Klypin A., Zhao H., Somerville R. S., 2002, ApJ, 573, 597
- Knollmann & Knebe [2009] Knollmann S. R., Knebe A., 2009, ApJS, 182, 608
- Koposov et al. [2008] Koposov S., Belokurov V., Evans N. W., Hewett P. C., Irwin M. J., Gilmore G., Zucker D. B., Rix H.-W., Fellhauer M., Bell E. F., Glushkova E. V., 2008, ApJ, 686, 279
- Kravtsov et al. [1997] Kravtsov A. V., Klypin A. A., Khokhlov A. M., 1997, ApJS, 111, 73
- Libeskind et al. [2005] Libeskind N. I., Frenk C. S., Cole S., Helly J. C., Jenkins A., Navarro J. F., Power C., 2005, MNRAS, 363, 146
- Macciò et al. [2006] Macciò A. V., Moore B., Stadel J., Diemand J., 2006, MNRAS, 366, 1529
- Moore et al. [1999] Moore B., Ghigna S., Governato F., Lake G., Quinn T., Stadel J., Tozzi P., 1999, ApJL, 524, L19
- Nagai & Kravtsov [2005] Nagai D., Kravtsov A. V., 2005, ApJ, 618, 557
- Navarro & Benz [1991] Navarro J. F., Benz W., 1991, ApJ, 380, 320
- Navarro & White [1994] Navarro J. F., White S. D. M., 1994, MNRAS, 267, 401
- Okamoto et al. [2005] Okamoto T., Eke V. R., Frenk C. S., Jenkins A., 2005, MNRAS, 363, 1299
- Ostriker & Tremaine [1975] Ostriker J. P., Tremaine S. D., 1975, ApJL, 202, L113
- Peñarrubia et al. [2008] Peñarrubia J., Navarro J. F., McConnachie A. W., 2008, ApJ, 673, 226
- Reiprich & Böhringer [2002] Reiprich T. H., Böhringer H., 2002, ApJ, 567, 716
- Romano-Diaz et al. [2009] Romano-Diaz E., Shlosman I., Heller C., Hoffman Y., 2009, ArXiv e-prints
- Romano-Díaz et al. [2008] Romano-Díaz E., Shlosman I., Hoffman Y., Heller C., 2008, ApJL, 685, L105
- Seigar et al. [2008] Seigar M. S., Barth A. J., Bullock J. S., 2008, MNRAS, 389, 1911
- Sommer-Larsen & Limousin [2009] Sommer-Larsen J., Limousin M., 2009, ArXiv e-prints
- Spergel et al. [2007] Spergel D. N., Bean R., Doré O., Nolta M. R., Bennett C. L., Dunkley J., Hinshaw G., Jarosik N., et al. 2007, ApJS, 170, 377
- Springel [2005] Springel V., 2005, MNRAS, 364, 1105
- Springel & Hernquist [2003] Springel V., Hernquist L., 2003, MNRAS, 339, 289
- Springel et al. [2001] Springel V., White S. D. M., Tormen G., Kauffmann G., 2001, MNRAS, 328, 726
- Stoehr et al. [2002] Stoehr F., White S. D. M., Tormen G., Springel V., 2002, MNRAS, 335, L84
- Tonry et al. [2001] Tonry J. L., Dressler A., Blakeslee J. P., Ajhar E. A., Fletcher A. B., Luppino G. A., Metzger M. R., Moore C. B., 2001, ApJ, 546, 681
- Weinberg et al. [2008] Weinberg D. H., Colombi S., Davé R., Katz N., 2008, ApJ, 678, 6
- Wetzel & White [2009] Wetzel A. R., White M., 2009, ArXiv e-prints
- White & Rees [1978] White S. D. M., Rees M. J., 1978, MNRAS, 183, 341
- Willick et al. [1997] Willick J. A., Courteau S., Faber S. M., Burstein D., Dekel A., Strauss M. A., 1997, ApJS, 109, 333
- Xu et al. [2009] Xu D. D., Mao S., Wang J., Springel V., Gao L., White S. D. M., Frenk C. S., Jenkins A., Li G., Navarro J. F., 2009, ArXiv e-prints
- Xue et al. [2008] Xue X. X., Rix H. W., Zhao G., Re Fiorentin P., Naab T., Steinmetz M., van den Bosch F. C., Beers T. C., Lee Y. S., Bell E. F., Rockosi C., Yanny B., Newberg H., Wilhelm R., Kang X., Smith M. C., Schneider D. P., 2008, ApJ, 684, 1143