Vol.0 (200x) No.0, 000–000
2Shanghai Observatory, Chinese Academy of Sciences, Shanghai 200030, China 11email: ywwu@pmo.ac.cn
A multiwavelength study of massive star-forming region IRAS 22506+5944
Abstract
We present a multi-line study of the massive star-forming region IRAS 22506+5944. A new 6.7 GHz methanol maser was detected. 12CO, 13CO, C18O and HCO+ J = 1-0 transition observations reveal a star formation complex consisting mainly of two cores. The dominant core has a mass of more than 200 M⊙, while another one only about 35 M⊙. Both cores are obviously at different evolutionary stages. A 12CO energetic bipolar outflow was detected with an outflow mass of about 15 M⊙.
keywords:
infrared: ISM — ISM: individual (IRAS 22506+5944) — ISM: jets and outflows — masers — stars: formation1 Introduction
Massive stars play an important role in the evolution of the interstellar medium (ISM) and galaxies; nevertheless their formation process is still poorly understood because of large distances, high extinction, and short timescales of critical evolutionary phases. In addition, massive stars do not form in isolation but often in clusters and associations, which make the environment of massive star formation regions more complex.
The 6.7 GHz transition of methanol has been found to be a particularly useful signpost to trace massive star formation (Minier et al. [2003], Xu et al. [2003]). On the other hand, the maser phase encompasses the outflow phase (Xu et al. [2006]), which give us another powerful tool to study the dynamics of massive star formations.
IRAS 22506+5944, with an infrared luminosity of 1.5104L⊙, belongs to the Cepheus molecular cloud complex. Harju et al. ( [1993]) made a NH3 map of this region, and found a NH3 core is coincident with the peak of the IRAS source. Both H2O maser (Wouterloot & Walmsley [1986]) and SiO (Harju et al. [1998]) have been detected. Although searches for 6.7 GHz methanol maser (Szymczak et al. [2000]) show negative results, recently, we found a weak 6.7 GHz methanol maser in this region. Despite its high luminosity and FIR color characteristics of the ultra-compact HII region, no radio emission was detected (Molinari et al. [1998]). The distances used in literatures for this source range from 5.0 kpc to 5.7 kpc. Here we use the value of 5.0 kpc.
In this paper, we present a multi-line study of this star-forming region. In Sect. 2, we describe our observations. The results are given in Sect.3. We give analysis and discussion in Sect.4, and summarize in Sect.5.
2 Observations
2.1 The Effelsberg 100 m Telescope
Observations of the methanol (CH3OH) maser were made using the Effelsberg 100 m telescope in February 2006. The rest frequency adopted for the 51-60 A+ transition was 6668.519 MHz (Breckenridge & Kukolich [1995]). The spectrometer was configured to have a 10 MHz bandwidth with 4096 channels yielding a spectral resolution of 0.11 km s-1 and a velocity coverage of 450 km s-1. The half-power beam width was 2′ and the telescope has an rms pointing error of 10′′. The observations were made in position switched mode. The system temperature was typically around 35 K during our observations. The flux density scale was determined by observations of NGC7027 (Ott et al. [1994]). The absolute calibration for flux density is estimated to be accurate to 10%. The integration time on source was 10 minutes, with a rms noise level of 0.05 Jy in the spectra. The pointing position was R.A.(J2000) 22h52m36.9s, DEC.(J2000) = +60∘00′48′′.
2.2 The PMO 13.7 m Telescope at Delingha
The 12CO, 13CO, C18O and HCO+ J = 1-0 maps were observed with the PMO 13.7 m millimeter-wave telescope at Delingha, China, during 2008 November. A cooled SIS receiver was employed, and system temperatures was K during the observations. Three AOS (acousto-optical spectrometer) were used to measure the J = 1-0 transitions of 12CO, 13CO, C18O and the FFTS (Fast Fourier Transform Spectrometer) were used to measure the HCO+ J = 1-0 lines. All the observations were performed in position switch mode. The pointing and tracking accuracy was better than 10′′. The obtained spectra were calibrated in the scale of antenna temperature T during the observation, corrected for atmospheric and ohmic loss by the standard chopper wheel method. The grid spacings of the mapping observations were 30′′. Table1 summarizes the basic information about our observations, including: the transitions, the center rest frequencies , the half-power beam widths (HPBWs), the bandwidths, the equivalent velocity resolutions (), and the typical rms levels of measured spectra. All of the spectral data were transformed from the T to the main beam brightness temperature T scale. The absolute calibration for intensity was about 10%.
The GILDAS software package (CLASS & GREG) was used for the data reduction.
| Translation | HPBW | Bandwidth | 1 rsma | ||
|---|---|---|---|---|---|
| (GHz) | (′′) | (MHz) | (km s-1) | (K) | |
| 12CO J = 1-0 | 115.271204 | 58 | 145 | 0.37 | 0.10 |
| 13CO J = 1-0 | 110.201353 | 61 | 43 | 0.11 | 0.10 |
| C18O J = 1-0 | 109.782182 | 62 | 43 | 0.12 | 0.09 |
| HCO+ J = 1-0 | 89.188521 | 75 | 43 | 0.16 | 0.10 |
-
1
a typical value in the scale of .
3 Results and Discussion
3.1 spectra
3.1.1 6.7 GHz CH3OH maser spectrum
The spectrum of the CH3OH maser detected in this region is shown in Fig. 1. There are two features that are separated by about 2.2 km s-1. The stronger feature is at the LSR (local standard of rest) velocity of -53.7 km s-1, with a flux density of 0.52 Jy, while the other is only about 0.2 Jy. In order to get high signal to noise spectra, we did not attempt to refine the position and just integrated the time at the same position. Hence, the actual position could be off by 1 arcminute.

3.1.2 12CO, 13CO, C18O and HCO+ spectra
Spectra of 12CO, 13CO, C18O and HCO+ are presented in Fig. 2. The spectra in left panel come from the peak of core A (dominant core in Fig. 3). Both 12CO and HCO+ show remarkable broad line wings, with a FW (full width) of 24 km s-1 and 6 km s-1 at 1 level, respectively. Spectra in the right panel are correspondent to the peak of core B, and spectra at the conjunctive point of the two cores are given in middle panel. Details of the line in positions of the peak, including the line central velocities, the fitted line widths, the bright temperatures and integrated intensity were listed in Table 2.
| Translation | VLSR | T | T d | |
|---|---|---|---|---|
| (GHz) | (km s-1) | (km s-1) | (K) | (K km s-1) |
| 12CO J = 1-0 a | -51.4 | 4.3 | 22.3 | 98.3 |
| 12CO J = 1-0 b | -51.5 | 3.3 | 14.1 | 48.9 |
| 13CO J = 1-0 a | -51.4 | 2.3 | 9.5 | 22.1 |
| 13CO J = 1-0 b | -51.5 | 1.8 | 6.1 | 11.4 |
| C18O J = 1-0 a | -51.6 | 1.8 | 1.2 | 2.3 |
| C18O J = 1-0 b | -51.5 | 1.1 | 0.9 | 1.0 |
| HCO+ J = 1-0 a | -51.1 | 3.8 | 2.1 | 6.9 |
| HCO+ J = 1-0 b | -51.6 | 2.0 | 0.4 | 0.9 |
-
1
a and b indicate Core A and Core B.

3.2 Mapping
3.2.1 13CO, C18O and HCO+ maps
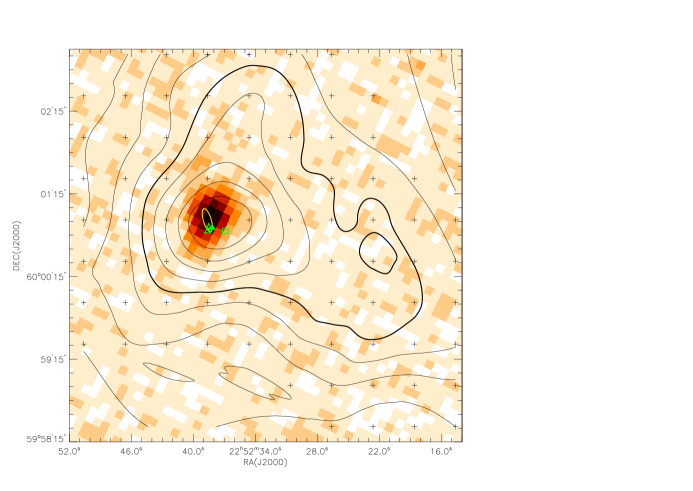
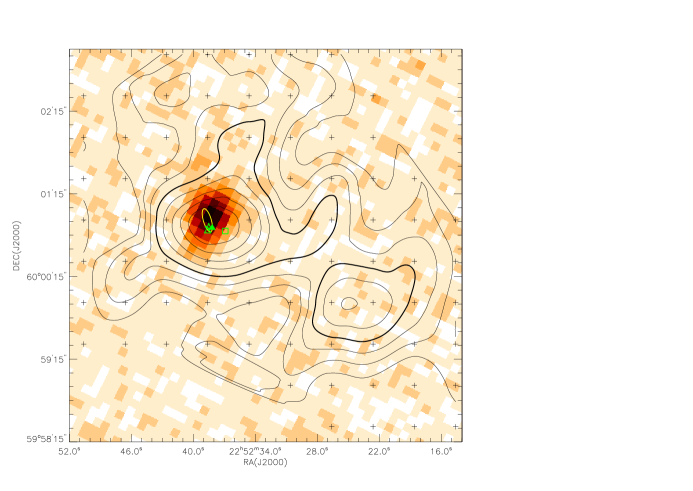
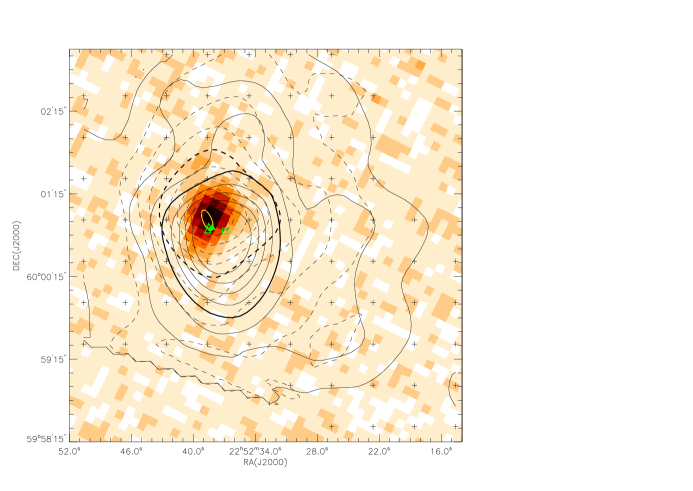
Contour maps of the total integrated 13CO J = 1-0, C18O J = 1-0 and HCO+ J = 1-0 line emissions were presented in Figure 3. We used MSX E band (21m) image as background images of the integrated contours to compare the distributions between gas and dust. The filled triangle denotes 3 millimeter continuum peak (Su et al. [2004]). H2O (Wooterloot & Walmsley [1986]), SiO (Harju et al. [1998]) and CH3OH masers were indicated with the open triangle, star and square, respectively. The IRAS error ellipse is also marked. Contour levels are 20% to 90% by steps of 10% of the peak emission with the exception of HCO+ J = 1-0 line, whose contour levels are 10%, 15% and 20% to 90% by steps of 10%.
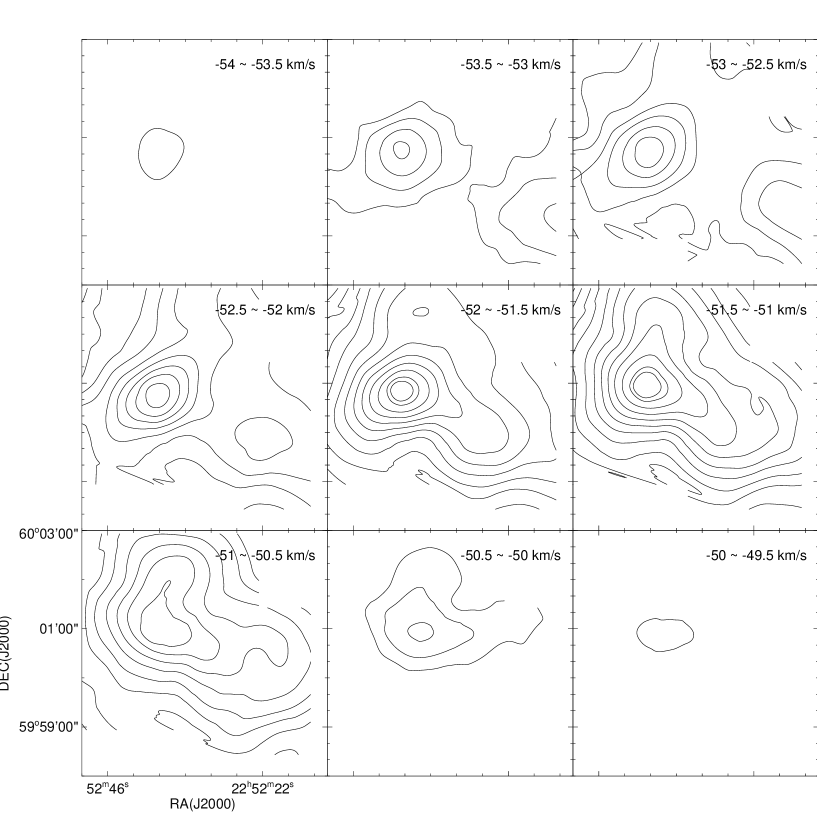
From Figure 3, we see that both molecular line and dust emission peak are roughly coincident with the IRAS source. 13CO and HCO+ are dominated with a single core. 13CO shows a little elongation. C18O map clearly shows two cores (Core A and Core B), indicating that such optical thin line traces the inner part of a molecular cloud than other two lines. The center of the Core A with an angular extent of (70′′, 60′′), coincides with IRAS 22506+5944 and MSX peak, indicates that they may be the same source. The Core B has an offset of (100′′, 60′′) at the north-west of the Core A. The size of Core A is slightly larger than the Core B (70′′, 60′′). In order to show the kinematic relation of the two cores we also give the channel maps of the 13CO J = 1-0 lines in Figure 4.

We derive the physical parameters of the cores, assuming LTE (local thermodynamic equilibrium) and with an abundance ratio = 104. Given a distance of the source to galactic center, DGC 11.4 kpc ,we adopt an abundance ratio and estimated from the relationship and (Wilson & Rood [1994]). Excitation temperature is calculated Using equation 1, assuming 12CO J = 1-0 lines are optical thick:
| (1) |
13CO and C18O J = 1-0 line optical depths, , are estimated with formulas below:
| (2) |
| (3) |
13CO and C18O column densities are derived using equation 4 (Kawamura et al. [1998]) and equation 5 (Sato et al. [1994]). and are optical depth and intrinsic line width:
| (4) |
| (5) |
The nominal core size, l, is determined by de-convolving the telescope beam, using equation 6:
| (6) |
where D is the distance (5.0 kpc), A1/2 is the area within the contour at the half- integrated intensity of the peak and is the main beam size (see Table 1).
Core masses are computed with equation 7, where m is the mass of the hydrogen molecule, the ratio of total gas mass to hydrogen mass, 1.36 (Hildebrand [1983]), the column density of H2 and l the de-convolved half power size defined above.
| (7) |
The physical parameters derived are tabulated in Table 3.
| Name | l | Tex | a | N(13CO) | N(C18O) | N(H2) b | M(LTE) | ||
|---|---|---|---|---|---|---|---|---|---|
| (arcsec) | (arcsec) | (pc) | (K) | km s-1 | (cm | (cm-2) | (cm-2) | (M⊙) | |
| core A | 90 | 70 | 0.9 | 26 | 1.5 | 2.7E+16 | 1.7E+15 | 2.7E+22 | 228 |
| core B | 85 | 60 | 0.5 | 18 | 1.0 | 10.7E+15 | 7.5E+14 | 1.1E+22 | 35 |
-
1
a: has been corrected using ,considering line broadening due to optical depth.
-
2
b: H2 column densities were derived using 13CO column densities, assuming = 9.3105.
3.2.2 Outflows
Molecular outflows are an important signature of the earlier stage in star formation. An outflow has been detected (Wu et al. [2005]) using the 12CO J = 2-1 line. A comparison of two different transitions will be helpful to our better understanding of the physical properties of outflows. In Fig. 3, we present a similar work with the 12CO (1-0) line. The red and blue lobes are largely overlapped, while the IRAS source is located at the center of the outflow, probably the driving source of the outflow. Morphology of the 12CO J = 1-0 outflow is similar to that of the 12CO J = 2-1 outflow (Wu et al. [2005]), but the former extends a larger area than the latter, spreading from Core A to Core B.
The outflow parameters, except for 12CO column density which is derived from Snell et al. ( [1988]), are estimated with the method of Beuther et al. ( [2002]). We assume that the gas is in LTE and the line wings are optically-thin. Excitation temperature and abundance ratio adopted are the same as Sect. 3.2.1. In order to better define the kinematics of the high gas, we divided the wings into low velocity and high velocity segments. The physical properties, including velocity range, size, column density, mass, momentum and kinetic energy are summarized in Table 4.
Following the method of Beuther et al. ([2002]), we obtain the characteristic time scale, t 104 yr, the mass loss rate, M⊙ yr-1 , the mechanical force, F M⊙ km s-1 yr-1, and the mechanical luminosity, L L⊙. The mass and kinetic energy of the outflow are significantly larger than typical values from low-mass star forming regions (Bontemps et al. 1996).
| Compoent | Vrange | Sizea | N(H2) | Mass | P | Ek |
|---|---|---|---|---|---|---|
| (km s-1) | (pc) | (cm-2) | M⊙ | (M⊙ km s-1) | (erg) | |
| red lobe(L) | (-48.2 -44.0) | 0.8 | 1.3E+20 | 5.3 | 72 | 9.6E+45 |
| red lobe(H) | (-44.0 -38.0) | 0.8 | 4.2E+19 | 2.1 | 29 | 3.8E+45 |
| blue lobe(L) | (-54.7 -59.0) | 1.0 | 1.0E+20 | 6.6 | 68 | 7.1E+45 |
| blue lobe(H) | (-59.0 -62.0) | 1.0 | 1.7E+19 | 1.0 | 11 | 1.1E+45 |
| total | — | —- | — | 15.0 | 180 | 2.2E+46 |
-
1
a: size of lobes are computed using formula 6.
3.3 evolutionary scenario
HCO+ usually traces the geometrically thick envelope of a core, while C18O is expected to trace the inner part of the core. The C18O map clearly shows two cores, Core A and Core B, which likely consist of two star forming regions. Core A has obvious star forming evidences, such as strong middle and far infrared emission, masers and outflows, while Core B is only associated with some cold molecular lines, indicating that core A and core B are in different evolutionary stages, Core A at the phase of protostar core, while Core B probably at the phase of pre-stellar core. The mass of Core A is more than 200 , while the IRAS source has a luminosity of 1.5 . According to the relation between mass and luminosity, , the core mass is around one order of magnitude larger than that of the IRAS source. This indicates there are other sources within the core, which are not detected due to the resolution limit of the employed telescope. With a rising steep spectrum, the IRAS colors imply that the source is deeply embedded in a dense molecular cloud. This IRAS source could be the exciting source of the H2O, SiO and CH3OH masers. Core B has a mass of about 35 , which might form several low or/and medium mass stars in the future. The energetic outflow driven by IRAS 22506+5944 covers the whole region, including both Core A and Core B, and could greatly affect its surrounding and accelerate Core B to form stars. In summary, the whole region is a star formation complex, in which stars at different evolutionary stages live in the same cluster and interact with each other.
4 Summary
Our multi-line study reveals a star formation complex around IRAS 22506+5944, in which a weak 6.7 GHz CH3OH maser was detected. Multi-line Maps reveal a two-core structure: core A with mass of 230 M⊙ contains the IRAS source which is driving an energetic bipolar outflow, while Core B, significantly smaller than core A, has a large offset from the IRAS source. The two cores are at different evolutionary stages. The energy released by the more evolved core (Core A) is influencing the relatively less evolved core (Core B) to accelerate its step to form stars.
Acknowledgements.
We wish to thank all the staff at Qinghai Station of Purple Mountain Observatory for their assistance with our observations. This work was supported by the National Natural Science Foundation of China (Grant Nos. 10673024, 10733030, 10703010 and 10621303) and National Basic Research Program of China-973 Program 2007CB815403.References
- [2002] Beuther H., Schilke P., Sridharan T.K., Menten, K.M., et al., 2002, A&A, 383, 892
- [1995] Breckenridge S.M., Kukolich S.G., 1995, ApJ, 438, 504
- [1] Bontemps, S., André, P., Terebey, S., & Cabrit, S. 1996, A&A, 311, 858
- [1993] Harju J., Walmsley C.M., Wouterloot J.G.A., 1993, A&AS, 98, 51
- [1998] Harju J., Lehtinen K., Booth R.S., Zinchenko I., 1998, A&AS, 132, 211
- [1983] Hildebrand R.H., 1983, QJRAS, 24, 267
- [1998] Kawamura A., Onishi T., Yonekura Y., et al., 1998, ApJS, 117, 387
- [2003] Minier V., Ellingsen S. P., Norris R. P., Booth R. s., 2003, A&A, 403, 1095
- [1998] Molinari S., Brand J., Cesaroni R., Palla, F., et al., 1998, A&A, 336, 339
- [1994] Ott M., Witzel A., Quirrenbach A., et al. 1994, A&A, 284, 331
- [1994] Sato F., Mizuno A., Nagahama T., et al. 1994, ApJ, 435, 279
- [1988] Snell R.L., Huang Y.-L., Dickman R.L., Claussen M.J., 1988, ApJ, 325, 853
- [2004] Su Y.-N., Zhang Q.-Z., Lim J., 2004, ApJ, 604, 258
- [2000] Szymczak M., Hrynek G., Kus A.J., 2000, A&AS, 143, 269
- [1994] Wilson T.L., Rood R., 1994, ARA&A, 32, 191
- [1986] Wouterloot J.G.A., Walmsley C.M., 1986, A&A, 168, 237
- [2005] Wu Y., Zhang Q.-Z., Chen H., Yang C., et al., 2005, AJ, 129, 330
- [2003] Xu Y., Zheng X.-W., Jiang D-R., 2003, \chjaa, 3, 49
- [2006] Xu, Y., Shen, Z.-Q., Yang, J., Zheng, X. W., et al. 2006, AJ, 132, 20