Simultaneous Multi-Wavelength Observations of Magnetic Activity in Ultracool Dwarfs. III. X-ray, Radio, and H Activity Trends in M and L Dwarfs
Abstract
As part of our on-going investigation into the magnetic field properties of ultracool dwarfs, we present simultaneous radio, X-ray, and H observations of three M9.5-L2.5 dwarfs (BRI 0021-0214, LSR 060230.4+391059, and 2MASS J052338.2140302). We do not detect X-ray or radio emission from any of the three sources, despite previous detections of radio emission from BRI 0021 and 2M052314. Steady and variable H emission are detected from 2M052314 and BRI 0021, respectively, while no H emission is detected from LSR 0602+39. Overall, our survey of nine M8-L5 dwarfs doubles the number of ultracool dwarfs observed in X-rays, and triples the number of L dwarfs, providing in addition the deepest limits to date, . With this larger sample we find the first clear evidence for a substantial reduction in X-ray activity, by about two orders of magnitude, from mid-M to mid-L dwarfs. We find that the decline in both X-rays and H roughly follows for . In the radio band, however, the luminosity remains relatively unchanged from M0 to L4, leading to a substantial increase in . Our survey also provides the first comprehensive set of simultaneous radio/X-ray/H observations of ultracool dwarfs, and reveals a clear breakdown of the radio/X-ray correlation beyond spectral type M7, evolving smoothly from to Hz-1 over the narrow spectral type range M7-M9. This breakdown reflects the substantial reduction in X-ray activity beyond M7, but its physical origin remains unclear since, as evidenced by the uniform radio emission, there is no drop in the field dissipation and particle acceleration efficiency. Based on the results of our survey, we conclude that a further investigation of magnetic activity in ultracool dwarfs will benefit from a two-pronged approach: multi-rotation observations of nearby known active sources, and a snapshot survey of a large sample within pc to uncover rare flaring objects.
Subject headings:
radio continuum:stars — stars:activity — stars:low-mass, brown dwarfs — stars:magnetic fields1. Introduction
The study of magnetic fields in fully convective low mass stars and brown dwarfs (hereafter, ultracool dwarfs) has progressed rapidly in recent years thanks to a broad range of observational techniques. These include observations of magnetic activity indicators such as radio, X-ray, and H emission (e.g., Rutledge et al. 2000; West et al. 2004; Berger 2006), Zeeman broadening of FeH molecular lines in Stokes (Reiners & Basri 2007), and time-resolved spectropolarimetry in Stokes (Zeeman-Doppler imaging; Donati et al. 2008; Morin et al. 2008). Each of these techniques is sensitive to specific properties of the magnetic field. Zeeman broadening provides a measure of the integrated surface magnetic flux, (Reiners & Basri 2006), where is the magnetic field strength and is the field covering fraction. Zeeman-Doppler imaging (ZDI), on the other hand, only allows for a reconstruction of the large-scale (multipole number of ) surface field, but it also provides information on the field topology (Donati et al. 2008; Morin et al. 2008).
The ZDI technique has led to a characterization of surface fields in several M dwarfs, revealing a transition from mainly toroidal and non-axisymmetric fields in M0-M3 objects to predominantly poloidal axisymmetric fields in mid-M dwarfs (Donati et al. 2008; Morin et al. 2008). The apparent shift in field geometry coincides with the transition to full convection, and may reflect a change in dynamo mechanism. The field strengths inferred from ZDI are kG, while those from the FeH Zeeman broadening method range from a non-detectable level of kG up to kG (Reiners & Basri 2007). However, in the few overlapping cases, the two techniques result in substantially different field strengths111The FeH Zeeman broadening technique leads to fields of 3.9 kG for EV Lac, 2.9 kG for AD Leo, and kG for YZ CMi (Reiners & Basri 2007), while the ZDI technique leads to much weaker fields of kG, 0.2 kG, and 0.55 kG for the three objects, respectively (Morin et al. 2008)., most likely as a result of sensitivity to different physical scales (Reiners & Basri 2009).
Despite their potential for measuring surface fields, neither of the two Zeeman techniques provide information on whether or how the magnetic fields couple to the stellar atmosphere and dissipate their energy. In addition, both techniques are challenging for the much dimmer L dwarfs since high signal-to-noise ratios of are required, and they also lose sensitivity at high rotation velocity due to line broadening (Reiners & Basri 2007). Finally, since only the large scale or integrated field is traced with these observations, they are unlikely to reveal field variability on short timescale and small physical scales due to flares.
These issues can be overcome through observations of various radiative processes that trace plasma heating and particle acceleration by the magnetic field. Of particular interest are chromospheric and coronal emission, traced by H and X-rays, respectively, as well as radio emission from accelerated electrons (gyrosynchrotron or coherent emission). These diagnostics not only provide an independent test for the existence, strength, and geometry of the magnetic fields, but they also allow us to infer their dissipation, particularly on short timescales and small physical scales. These techniques are not biased against rapid rotation and can be applied much more easily in late-M, L, and T dwarfs.
In this context, large samples of ultracool dwarfs have been observed in H, primarily as a by-product of spectroscopic observations aimed at measurements of stellar properties (e.g., Gizis et al. 2000; Mohanty & Basri 2003; West et al. 2004; Reiners & Basri 2007). These observations reveal a saturated level of emission in the early M dwarfs, with , followed by a rapid decline beyond spectral type M7 (Gizis et al. 2000; West et al. 2004). The H rotation-activity relation that exists in higher mass stars, breaks down at about the same spectral type (Mohanty & Basri 2003). In the radio band, more than 100 ultracool dwarfs have been observed, revealing the opposite trend; namely, appears to increase with later spectral type, at least to (Berger 2006), and a rotation-activity relation may exist even beyond M7 (Berger et al. 2008a). In X-rays only a few objects beyond M7 have been observed (e.g., Fleming et al. 1993; Neuhäuser et al. 1999; Fleming et al. 2000; Rutledge et al. 2000; Berger et al. 2008a; Robrade & Schmitt 2008), revealing a possible minor decline from the saturated level of that is observed in M0-M6 dwarfs. A breakdown of the rotation-activity relation in X-rays has also been proposed (Berger et al. 2008a).
Still, few attempts have been made to study the correlated behavior of magnetic activity indicators in ultracool dwarfs. Such studies are of prime importance because they can directly link magnetic dissipation and particle acceleration with chromospheric and coronal heating, particularly in the context of time-variable phenomena (flares). These studies can also test whether the radio/X-ray and X-ray/H correlations that exist in higher mass stars are also observed in ultracool dwarfs. Such studies are observationally challenging, since they require simultaneous coverage with a wide range of facilities. Despite this difficulty, ultracool dwarfs are particularly well-suited to these observations since their rapid rotation allows us to cover multiple rotations in several hours.
Over the past few years we have carried out such observations (radio, H, X-rays) for several ultracool dwarfs. Results for three late-M dwarfs were published in Berger et al. (2008b) (hereafter, Paper I) and Berger et al. (2008a) (hereafter, Paper II), while observations of three L dwarfs were published in Berger et al. (2005) and Berger et al. (2009). In the course of this survey we have found an overall lack of temporal correlation between the various activity indicators. In particular, the tight radio/X-ray correlation breaks down at about spectral type M7, with later objects exhibiting suppressed X-ray emission. This result may be tied to coronal stripping by rapid rotation, which is ubiquitous beyond M7 (Paper II) or to reduced coronal densities, which would strongly suppress X-ray bremsstrahlung emission. Moreover, we have uncovered several cases of rotationally-modulated emission in both H and radio that arise from large-scale magnetic hot spots (Paper I and Berger et al. 2009).
In this paper we present new simultaneous multi-wavelength observations of three ultracool dwarfs (M9.5, L1, and L2.5). Taken together with the previous observations, our program doubles the number of ultracool dwarfs, and triples the number of L dwarfs, observed in X-rays. Using this extended sample, and taking advantage of the simultaneous nature of the observations, we investigate in this paper the overall activity trends of ultracool dwarfs.
2. Targets and Observations
We present observations of three nearby ultracool dwarfs, BRI 0021-0214 (M9.5; hereafter, BRI0021), LSR 060230.4+391059 (L1; hereafter, LSR0602+39), and 2MASS J052338.2140302 (L2.5; hereafter, 2M052314). The properties of these sources, including the results of previous H and radio observations are summarized in Table 1. Both BRI0021 and 2M052314 have been shown to exhibit variable radio emission (Berger 2002; Antonova et al. 2007), while LSR0602+39 was not previously detected (Berger 2006). Similarly, BRI0021 exhibited variable H emission in the past, while 2M052314 appears to have steady H emission, and LSR0602+39 shows no detectable emission. Finally, of the three sources only BRI0021 has been observed in X-rays (with ROSAT) and was not detected to a limit of (Neuhäuser et al. 1999).
The observations presented here took place on 2007 December 30 (2M052314), 2008 January 18 (LSR0602+39), and 2008 October 29 (BRI0021).
2.1. Radio
Very Large Array222The VLA is operated by the National Radio Astronomy Observatory, a facility of the National Science Foundation operated under cooperative agreement by Associated Universities, Inc. observations were obtained simultaneously at 4.86 and 8.46 GHz in the standard continuum mode ( MHz contiguous bands), with thirteen antennas used at each frequency. The observational setup for each source is summarized in Table 2. Data reduction and analysis followed the procedures outlined in Papers I and II. We did not detect radio emission from any of the three sources. The upper limits on the flux and are listed in Table 2.
2.2. X-Rays
Observations were performed with the Chandra/ACIS-I2 frontside-illuminated chip. A total of 29.80, 29.66, and 29.77 ks were obtained for BRI0021, LSR0602+39, and 2M052314, respectively. The data were analyzed using CIAO version 3.4, and counts were extracted in a radius circle centered on the position of each source.
No X-ray emission was detected from any of the three sources above the background level of about 1.5 counts per 30 ks. Thus, the resulting upper limits are about 7 counts ( confidence level). To convert to a limit on the X-ray flux and we use an energy conversion factor of erg cm-2 s-1, appropriate for a 1 keV Raymond-Smith plasma model in the keV range. The resulting limits are provided in Table 3.
2.3. Optical Spectroscopy and H Imaging
We observed333Program GS-2008A-Q-79. 2M052314 with the Gemini Multi-Object Spectrograph (GMOS; Hook et al. 2004) mounted on the Gemini-South 8-m telescope. The observations were performed with the B600 grating set at a central wavelength of 5250 Å, and with a slit. The individual 300 s exposures were reduced using the gemini package in IRAF (bias subtraction, flat-fielding, and sky subtraction). Wavelength calibration was performed using CuAr arc lamps. The spectra cover Å at a resolution of about 5 Å. A series of 73 exposures were obtained with an on-source efficiency of . A summary of the observations and results is provided in Table 4. We find non-variable H emission with a mean equivalent width of Å, about a factor of three time higher than previously observed by Reiners & Basri (2008). This corresponds to a ratio of .
We observed LSR0602+39 with the Dual Imaging spectrograph (DIS) mounted on the ARC 3.5-m telescope at Apache Point Observatory. The observations were performed with the R1200 grating set at a central wavelength of 6980 Å, and with a slit. The individual 600 s exposures were reduced using standard packages in IRAF, and wavelength calibration was performed using HeNeAr arc lamps. The spectra cover Å at a resolution of about 1.3 Å. A series of 38 exposures were obtained with an on-source efficiency of . A summary of the observations and results is provided in Table 4. No H emission is detected in any of the individual spectra, or in the combined spectrum to a limit of Å. This corresponds to a ratio of , a factor of 2 times lower than the limit found by Reiners & Basri (2008).
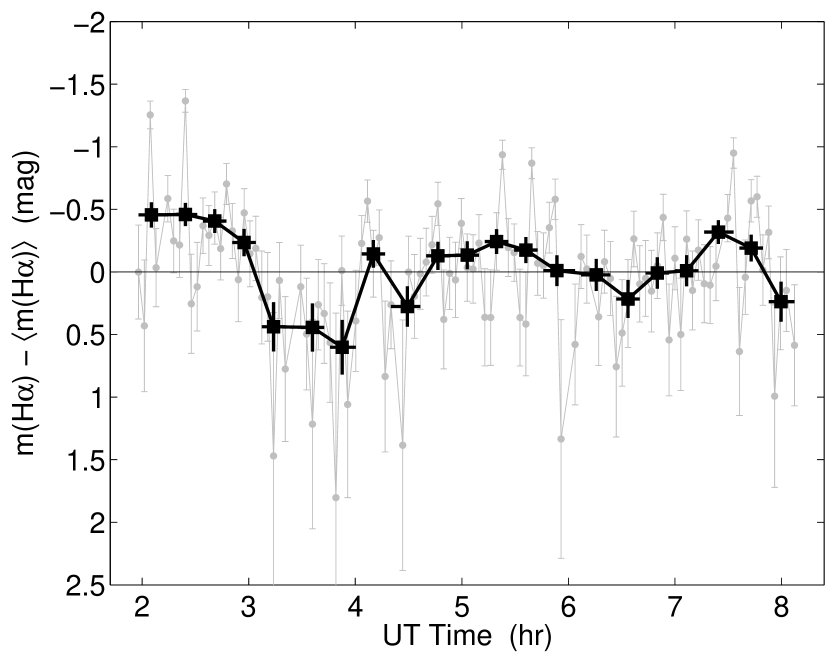
Finally, we observed BRI0021 with the robotic 60-inch telescope at Palomar Observatory using an H imaging filter with a width of 20 Å. We obtained a total of 106 images with an exposure time of 180 s each, and an on-source efficiency of . Since the purpose of these observations was to search for H variability we did not obtain off-band images for absolute calibration. Instead, we constructed an H light curve relative to five nearby stars. We find that for the comparison stars the root-mean-square fluctuations relative to their mean brightness is about . The light curve of BRI0021, shown in Figure 1, exhibits clear variability on a hr timescale, with peak to trough variations of about a factor of 3.
3. Magnetic Activity Trends in Ultracool Dwarfs
The results of our program, including the observations presented here, in Papers I and II, in Berger et al. (2005), and in Berger et al. (2009), are summarized in Figures 2–7. To supplement these observations, we analyze unpublished archival Chandra and VLA observations of the M8 dwarf LP 412-31 in Appendix A, and we collected all of the available observations of late-M and L dwarfs from the literature. These data are summarized in Table 5. To determine the activity trends we also include comparison samples of early- and mid-M dwarfs. Below we discuss the inferred activity trends for each of the main indicators.
3.1. X-rays
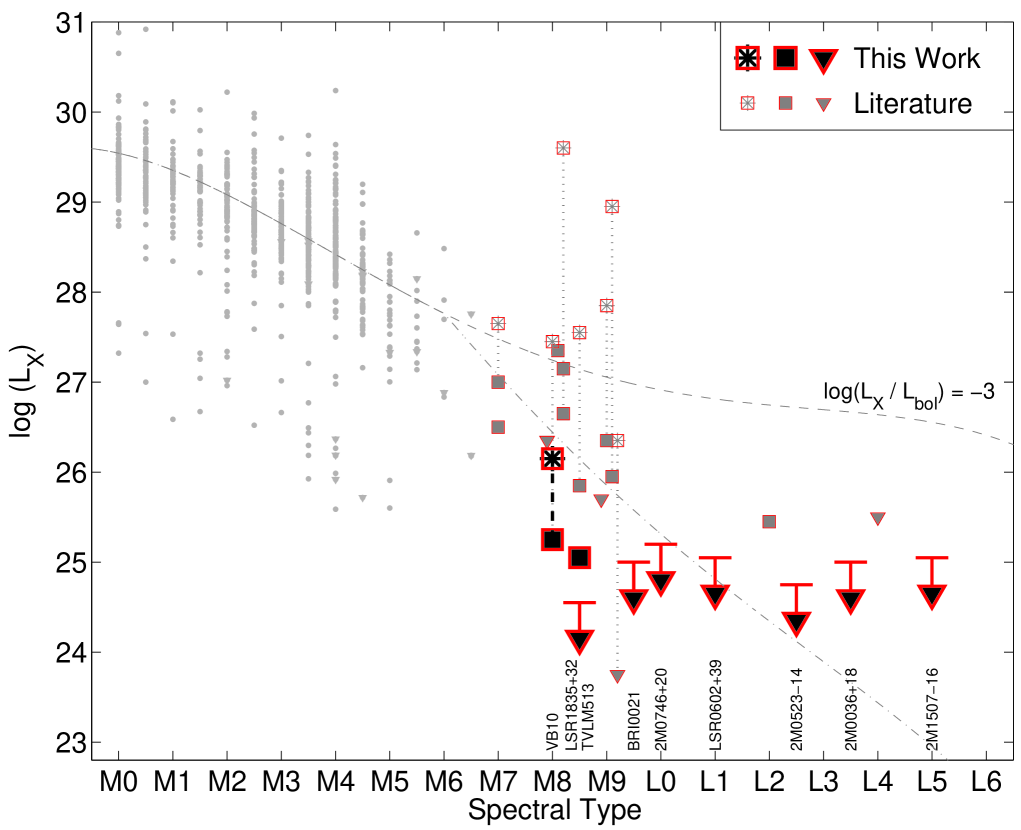
Our survey provides a substantial increase in the number of ultracool dwarfs observed in X-rays. The X-ray luminosities of our sources, and objects available in the literature, are plotted in Figure 2. The typical quiescent X-ray luminosities range from about erg s-1 for M0 objects to about erg s-1 for mid-M, and erg s-1 for late-M dwarfs. The L dwarfs have typical limits of erg s-1. The overall decline in X-ray luminosity is roughly proportional to the decline in bolometric luminosity for spectral types M0-M6, at a level of . This is the well-known saturated X-ray emission in early- and mid-M dwarfs (Pizzolato et al. 2003). The subsequent decline in X-ray luminosity, however, is more rapid than expected from the same relation.
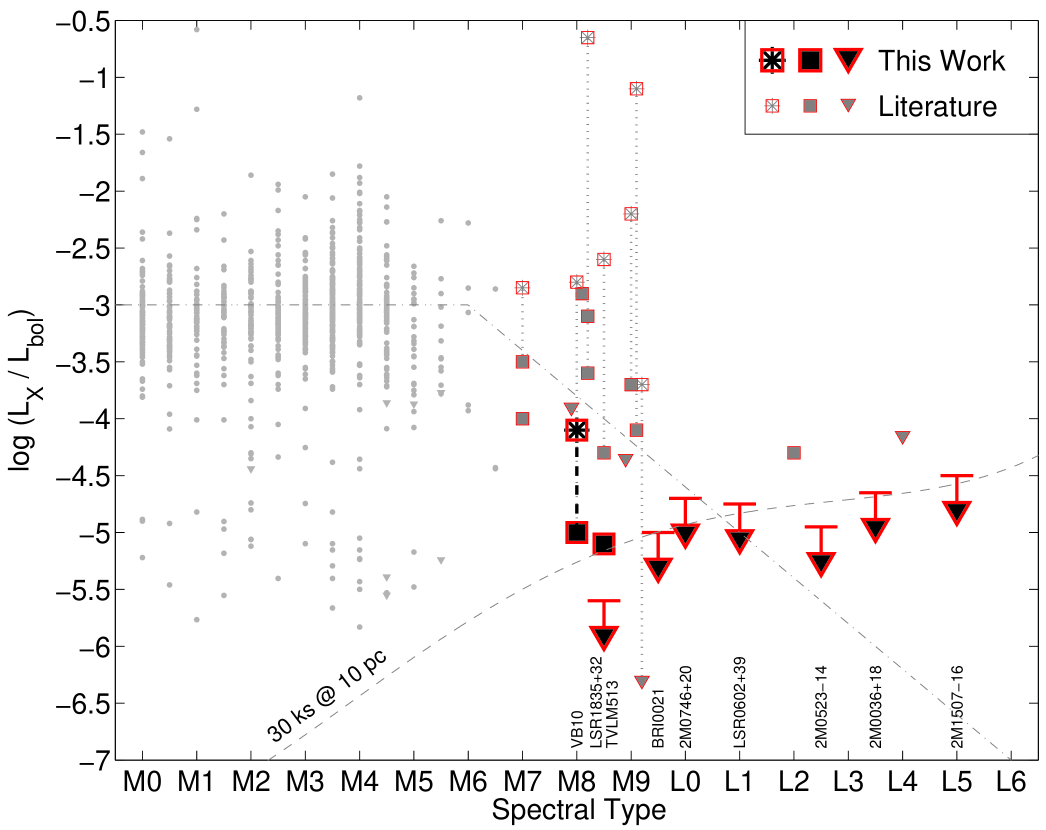
To address this decline, and to assess the X-ray activity level we plot the ratio of quiescent X-ray to bolometric luminosity for spectral types M0-L5 in Figure 3. This ratio exhibits a clear trend of saturated emission () down to a spectral type of about M6, followed by a significant decline to for M7-M9, and beyond M9. With the exception of the very weak and marginal detection of Kelu-1 (4 photons in 24 ks; Audard et al. 2007), no other L dwarf has been detected in the X-rays to date. Our program significantly extends the number of observed L dwarfs from 2 to 7, and also provides the deepest available limits. To quantify the decline in X-ray activity we use a broken power law model:
| (1) |
where SP is the spectral type. This model accounts for the general trend of declining quiescent X-ray emission (Figure 3).
Although the dynamic range for detectable quiescent emission in terms of is more limited for ultracool dwarfs compared to the early- and mid-M dwarfs, we find a dispersion of about two orders of magnitude in the level of activity for spectral types M7-M9, to . If we include non-detections, the spread is at least three orders of magnitude. For comparison, early- and mid-M dwarfs exhibit an overall spread of nearly four orders of magnitude.
Taking into account the detection of X-ray flares, we find that objects with spectral types M7-M9 are capable of reaching values of similar to, or even in excess of, early M dwarfs. Moreover, we find that 7 of the 11 detected sources beyond spectral type M7 produce flaring emission (or 7 out of the 21 observed sources). This suggests that a substantial fraction of the active sources produce flares in addition to quiescent emission. The typical duration of the detected flares is hr, with a range of about s. Summing the total time which the M7-L5 sources spend in a flaring state, we find that it represents about of the total on-source exposure time. Separating the sample into M7-M9 and L dwarfs, we find that the former spend about of the time in flares, while the latter spend of the time in a flare state ( confidence limit assuming a typical flare duration of 1 hr). For our own sample of nine M8-L5 objects, which was observed in a uniform manner with Chandra, we find a fraction of time in a flaring state of only .
3.2. H
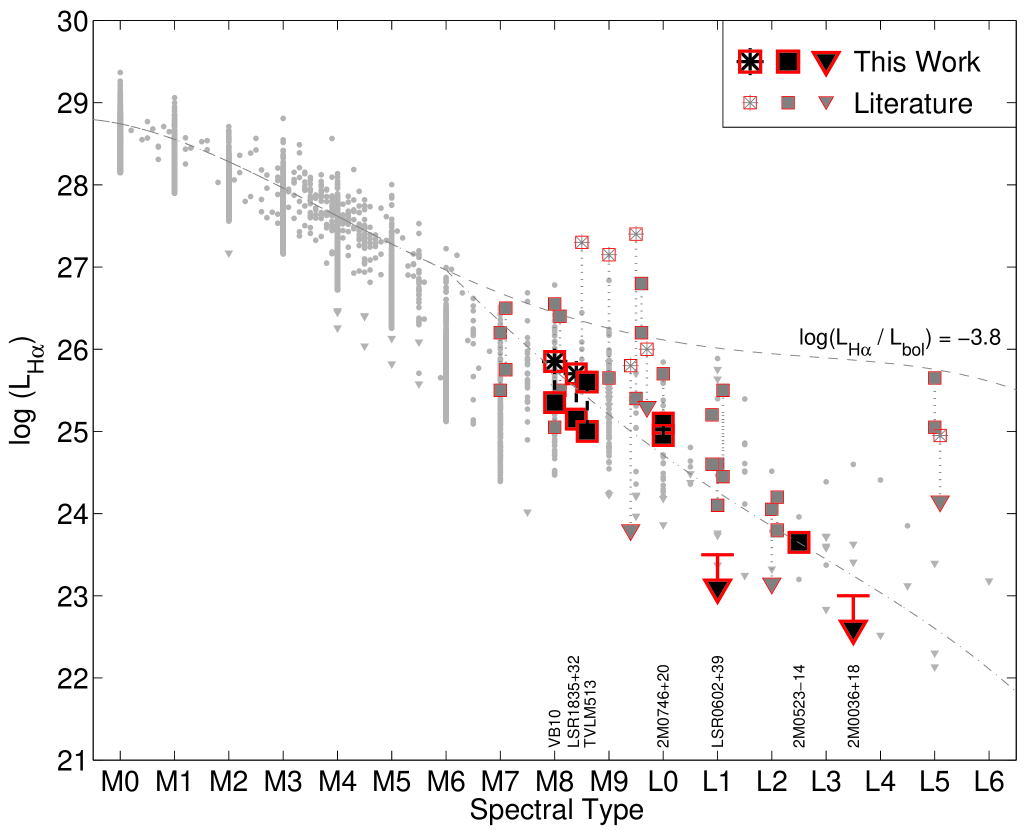
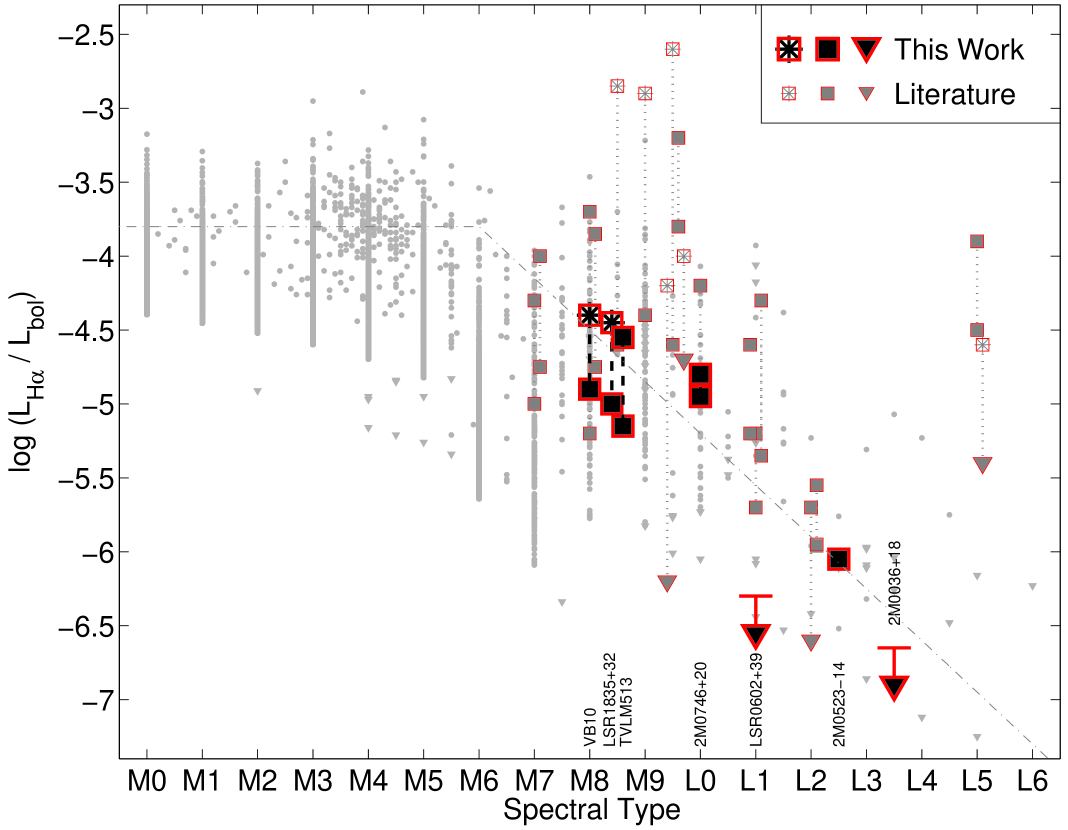
The H luminosities of our targets, and M and L dwarfs from the literature, are shown in Figure 4. We find a continuous decline from a luminosity of about erg s-1 in early-M dwarfs to about erg s-1 in mid-M dwarfs, and about erg s-1 for late-M dwarfs. Early-L dwarfs have a typical H luminosities of only erg s-1. As in the case of the X-ray emission, the overall decline in H luminosity is roughly proportional to the decline in bolometric luminosity for spectral types M0-M6, at a saturated level of . The subsequent decline, however, is more rapid than expected from the same relation. The decline relative to the saturated level occurs at about the same spectral type in both H and X-rays.
The ratio of H to bolometric luminosity (i.e., H activity) is shown in Figure 5. The ratio is relatively constant at a level of down to about spectral type M6, and rapidly declines by at least two orders of magnitude between M6 and L3. The objects we observed in this project exhibit the same trend, although some of our limits are deeper than in past observations due to the long duration of our observations. As in the case of the X-ray emission, we quantify the drop in H activity using a broken power law:
| (2) |
This model accounts for the general behavior of the quiescent H emission, and is in good agreement with the decline in X-ray activity. As in the case of the X-ray emission, the few detected H flares (dominated by objects with spectral types M7-M9) have value of similar to, or in excess of the quiescent emission from early M dwarfs. For M0-L5 objects, the overall spread in within each spectral type bin is about two orders of magnitudes.
The fraction of M7-L5 objects which produce H flares is difficult to assess given the typical short duration of most spectroscopic observations. However, of the such objects that we found in the literature (Figure 5), about 20 exhibit flares or significant variability, leading to a fraction of about . This is a significantly smaller fraction than in the X-rays (). The most likely explanation for this order of magnitude discrepancy is a sample selection bias, namely X-ray observations are expensive and have thus been focused on the nearest and most likely to be active sources. Conversely, H flares are likely to be under-reported, such that only observations of the most extreme flares tend to be published. If we restrict the analysis of flare rates to our uniform sample of ultracool dwarfs, we find that only 1/9 exhibit variable X-ray emission (1/2 of the detected sources), while 5/8 exhibit variable H emission (5/6 of the detected sources). Thus, it appears that in our sample, H variability is more common than X-ray variability.
We note, however, that the typical flares/variability detected in our observations are only a few times brighter than the quiescent emission. On the other hand, some of the flares reported in the literature exceed the quiescent emission by up to two orders of magnitude. The lack of such flares in our observations places a limit of per hour on their rate in the spectral type range M8-L3 ( confidence level). Assuming a typical flare duration of about 0.5 hr, the corresponding limit on the duty cycle is . This is comparable to recent estimates of flare duty cycles of and for late-M and L dwarfs, respectively (Schmidt et al. 2007).
3.3. Radio
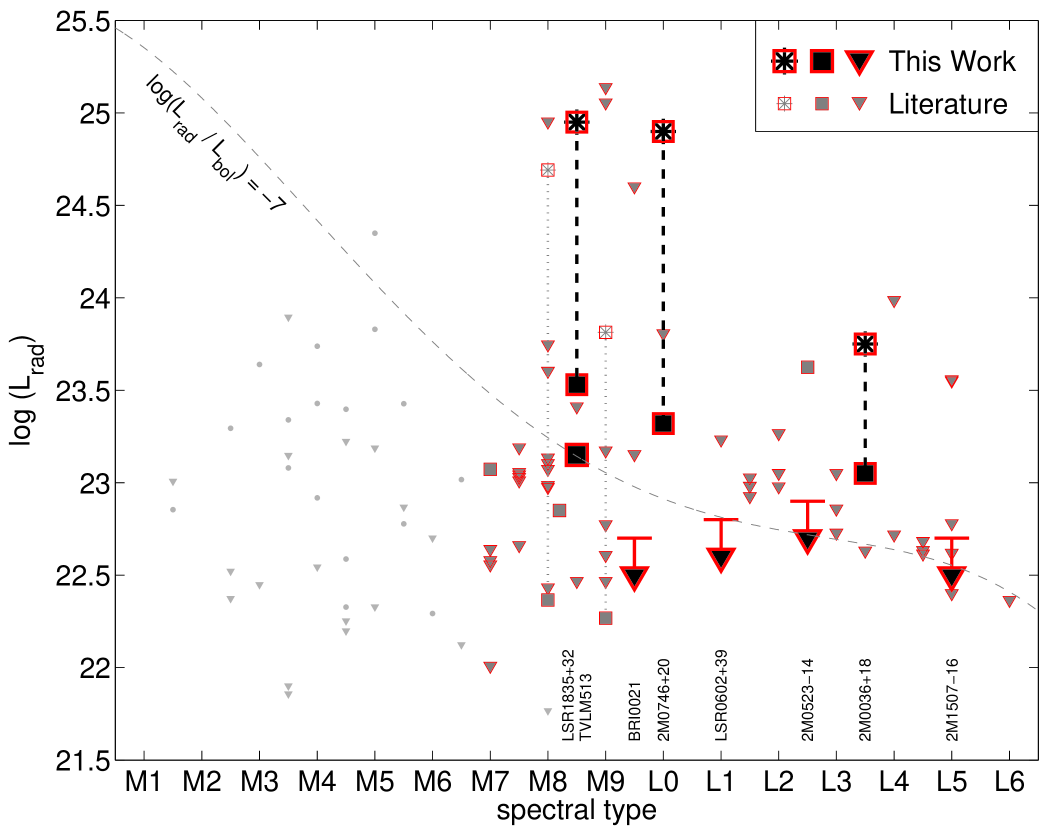
In the radio band, the observed trends in luminosity and exhibit a remarkable contrast to the X-ray and H trends (see also Berger 2006, Papers I and II, and Audard et al. 2007). In particular, the detected sources with spectral types M0-L5 exhibit nearly constant quiescent radio luminosity, erg s-1 (Figure 6). Radio flares (and pulsing emission; Hallinan et al. 2007; Berger et al. 2009) reach higher luminosities of up to erg s-1. At the present, no object beyond spectral type L3.5 has been detected in the radio (Berger et al. 2005).
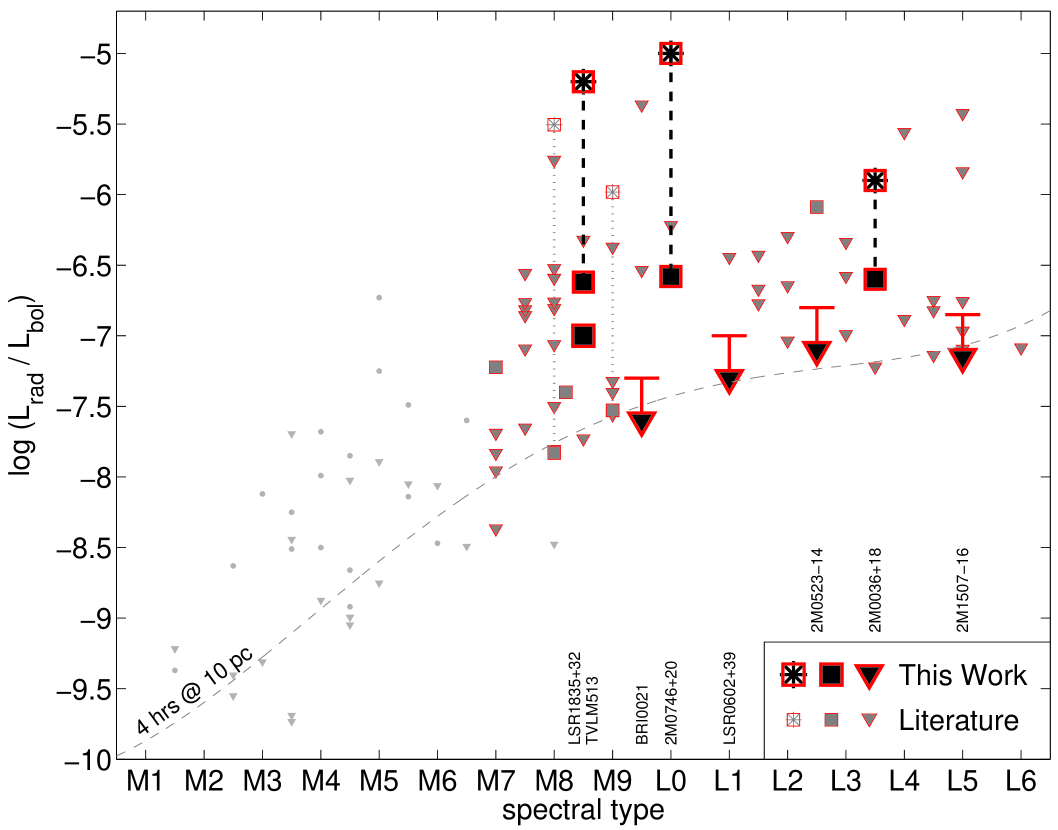
The trend for naturally exhibits an increase, from about for early-M dwarfs, to for mid-M dwarfs, and about for ultracool dwarfs. The flaring and pulsing emission reach . As in the case of the X-ray emission, and unlike in H, the fraction of sources with detectable quiescent emission that also produce flares or pulses is high, .
The bulk of the non-detected ultracool dwarfs have limits that are comparable in luminosity to the quiescent emission from the detected sources. This is simply a reflection of the limited dynamic range of the existing radio observations, which generally consist of hr with the VLA. The fractional detection rate may also be influenced by source variability on long timescales (Berger 2006; Antonova et al. 2007).
3.4. Breakdown of the Radio/X-ray Correlation
Coronally active stars ranging from spectral type F to mid-M exhibit a tight correlation between their radio and X-ray emission, with Hz-1 for (Guedel & Benz 1993; Benz & Guedel 1994). The first detection of radio emission from an ultracool dwarf, with Hz-1 (Berger et al. 2001), indicated that this correlation may be severely violated in these objects. Subsequent radio detections of ultracool dwarfs yielded similar results (Berger 2002). Indeed, one of the main motivations for our simultaneous radio/X-ray observations is to investigate the nature of this breakdown. Prior to our survey, most of the available radio and X-ray observations of ultracool dwarfs were obtained years apart, and could have been influenced by long-term variability.
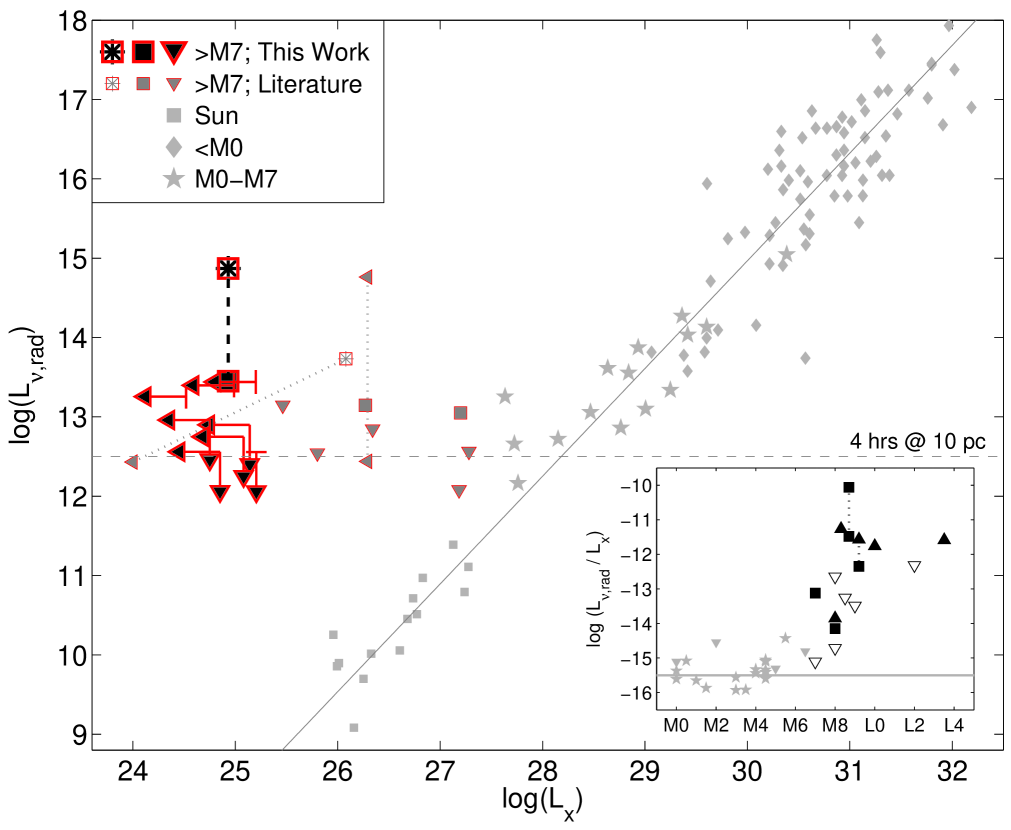
The results for all objects in our survey, supplemented by data from the literature, are shown in Figure 8. The tight correlation for spectral types earlier than M7 is evident, as is the decline in both radio and X-ray luminosity as a function of spectral type. The best-fit linear trend is:
| (3) |
which in the range of X-ray luminosities for M0-M6 dwarfs, , corresponds to Hz-1. Beyond spectral type M6, however, we find a clear trend of increasing ratio of , from about for M7-M8 to beyond M9. We note that not all objects necessarily violate the correlation, since some are detected in the X-rays with no corresponding radio emission. However, with the exception of the marginal detection of Kelu-1, all of these objects have spectral types of M7-M9.
A comparison of the trends in Figures 2 and 6 suggests that the breakdown in the radio/X-ray correlation beyond is largely due to the rapid decline in quiescent X-ray luminosity. This is a surprising result since the strong correlation for objects earlier than M6 suggests that heating (X-ray emission) and particle acceleration (radio emission) are either directly correlated, or share a common origin, presumably through dissipation of the magnetic fields (e.g., Guedel & Benz 1993). Since the radio luminosities remain relatively unchanged from early-M to mid-L dwarfs, it appears that the fraction of magnetic energy that goes into accelerating electrons is roughly constant, and that the process of field dissipation remains uniformly efficient despite the increasing neutrality of the stellar atmospheres. Atmospheric neutrality has been argued to cause the decline in chromospheric444The investigation of this effect by Mohanty et al. (2002) does not directly pertain to X-ray and radio emission since only physical conditions applicable to stellar chromospheres were investigated. heating (i.e., H emission) due to the resulting decrease in magnetic stresses and field dissipation (Mohanty et al. 2002).
Since the field dissipation and electron acceleration efficiency remain relatively unchanged, we are forced to conclude that the breakdown of the radio/X-ray correlation is due to a decrease in the plasma heating efficiency. This may be due to enhanced trapping of the radio-emitting electrons, if these electrons are directly responsible for plasma heating in higher mass stars. Another possibility is a decline in the bulk coronal density leading to a strong suppression in X-ray heating, but with a minor impact on the radio emission, which requires a smaller population of relativistic electrons. Alternatively, the geometry of the radio-emitting regions may evolve to smaller sizes such that their impact on large-scale coronal plasma heating decreases. This latter explanation appears less likely since rotationally-stable quiescent radio emission and periodic H emission from several ultracool dwarfs in our sample point to large magnetic field covering fractions (e.g., Berger et al. 2008a, 2009).
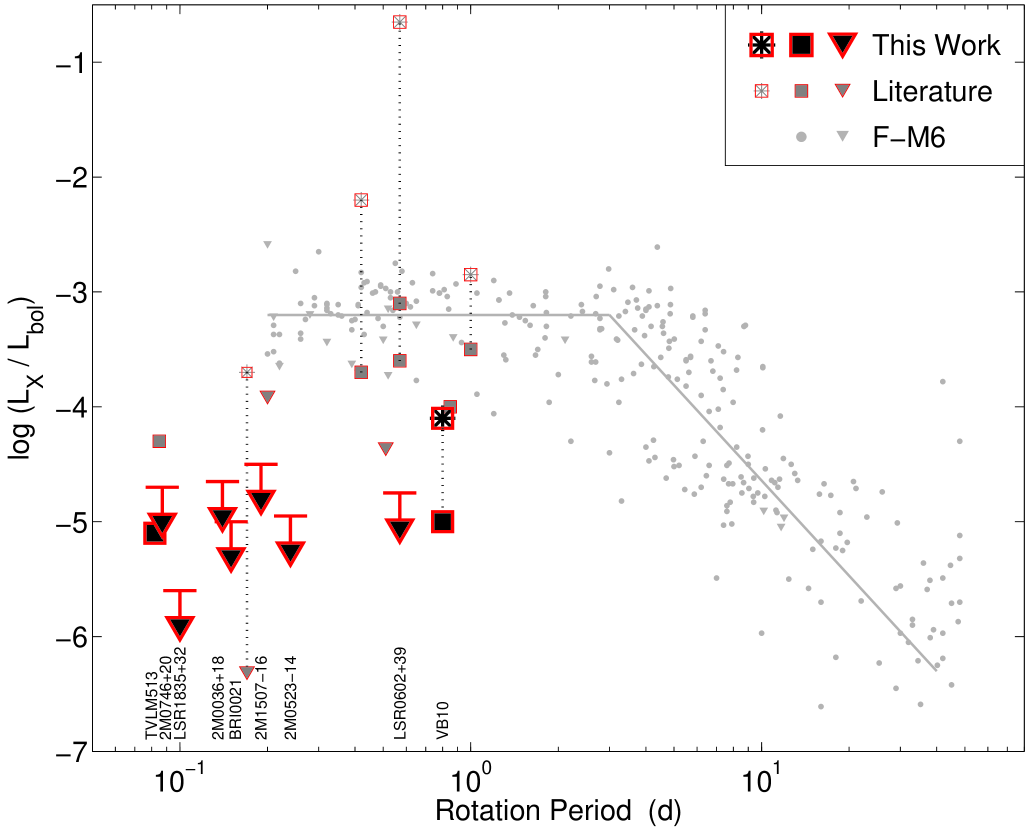
Finally, the combination of rapid rotation and the shrinking co-rotation radius of lower mass stars may lead to a decline in X-ray emission through centrifugal stripping of the corona. In Figure 9 we plot the ratio as a function of rotation period. We find a decline in as a function of decreasing period for objects later than M7, with a median value of for d, and for d (for typical parameters, d corresponds to km s-1). For this decline to be due to coronal stripping, the magnetic field scale height should be a few stellar radii.
4. Summary and Future Prospects
We presented simultaneous X-ray, radio, and H observations of three late-M and L dwarfs, which along with our previous published results double the number ultracool dwarfs and triple the number of L dwarfs observed in X-rays. The overall X-ray detection fraction in our survey, to a typical limit of , is about . Combining our sources with all objects later than M7 from the literature leads to a detection fraction of about . This fraction is dominated by late-M dwarfs, with at most of L dwarfs detected to date (this is based on the marginal detection of Kelu-1). We further find a significant drop in X-ray activity beyond spectral type , to for M7-M9 and for L dwarfs. The decline in X-ray activity, and the observed level of emission, are similar to those measured for low mass stars and brown dwarfs in young star forming regions (Feigelson et al. 2002; Mokler & Stelzer 2002; Preibisch & Zinnecker 2002; Grosso et al. 2007).
A similar decline in activity is observed in H, although of our targets are detected. In the radio band, however, we find that remains relatively unchanged in the range M0-L4, and hence increases by about two orders of magnitudes over the same spectral type range. The rapid decline in X-ray emission and the uniform level of radio emission lead to a breakdown in the radio/X-ray correlation. With our increased sample of objects we find that the ratio transitions sharply, but smoothly, from to Hz-1 over the spectral type range M7-M9. The radio/X-ray correlation in objects earlier than M7 is likely due to a correlated or common origin for particle acceleration and plasma heating. We conclude that its breakdown is due to a decline in the plasma heating efficiency, as a result of efficient electron trapping, increased neutrality, decrease in coronal density, a decline in the size of the radio-emitting regions, or coronal stripping.
In light of our results, we suggest that continued observational progress in the study of X-ray emission from ultracool dwarfs can be achieved with two distinct approaches: (i) deeper observations of a small number of nearby objects; and (ii) a shallower survey of a significantly larger sample of objects than is currently available. In the context of the former approach, our existing survey indicates that most L dwarfs do not produce quiescent X-ray emission at a level of based on 30 ks observations. Since our targets were located within about 15 pc, deeper limits can only be achieved with ks observations of targets within pc. However, the only early-L dwarfs that come close to matching this criterion (2M0036+18 and 2M150716) were already observed as part of our survey. Thus, it is unlikely that we can observe any ultracool dwarfs to limits that are more than a factor of times deeper than our current survey, and we therefore conclude that blind long X-ray observations do not provide the best way forward. Instead, such observations should be targeted at objects with strong radio and/or H emission, for which the likelihood of an X-ray detection may be higher.
In addition, a large shallow survey may be highly fruitful in detecting X-ray emission from ultracool dwarfs. The existing observations indicate that late-M dwarfs are capable of producing flares at a level similar to the saturated X-ray emission from early-M dwarfs, . Such flares can be detected with Chandra or XMM-Newton to a distance of pc in about 10 ks. Thus, a survey of about ultracool dwarfs within this distance would require a similar amount of time to the existing observations of ultracool dwarfs, but it will significantly increase the chance of detecting rare flaring objects. Coupled with simultaneous radio observations, this survey will also allow us to better assess the radio/X-ray correlation and its breakdown.
Beyond additional observations, progress in our understanding of the decline in X-ray emission and the breakdown of the radio/X-ray correlation requires detailed theoretical studies of coronal conditions in ultracool dwarfs. The existing work (Mohanty et al. 2002) investigated atmospheric conditions that are only applicable to the stellar chromosphere, and led to the conclusion that dissipation of the magnetic field is suppressed by the increasing neutrality of the stellar atmospheres. However, particle acceleration in the magnetic fields appears to remain efficient at least to mid-L dwarfs as evidenced by radio observations, suggesting that in the corona the magnetic fields may couple effectively to the tenuous atmosphere.
Appendix A X-ray and Radio Observations of LP 412-31
In addition to the observations presented in this paper, we retrieved from the Chandra archive observations of the M8 dwarf LP 412-31 that were obtained as part of program 09200198 (PI: Stelzer) on 2007 December 22.95 UT for a total of 40.6 ks. This object is located at a distance of pc (Reid & Cruz 2002), and has a bolometric luminosity of L⊙. It was previously detected with XMM-Newton with a quiescent luminosity of erg s-1, and a flare that peaked at erg s-1 (Stelzer et al. 2006b).
We analyzed the data using CIAO version 3.4, and extracted counts in a radius circle centered on the position of LP 412-31. The source is clearly detected, with a total of 239 counts in the keV range, compared to about 1 count expected from the background. To determine the X-ray flux we fit the spectrum using xspec V11. We restrict the fit to the energy range keV over which most of the counts are detected. Using a single-temperature Raymond-Smith model with the abundance set to 0.3, we find a poor fit to the data ( for 15 degrees of freedom) with a temperature of keV (Figure 10a). A significantly improved fit ( for 13 degrees of freedom) is obtained with a two-temperature Raymond-Smith model, with temperatures of and keV (Figure 10b). The resulting flux of LP 412-31 for this model is erg cm-2 s-1 in the keV energy range (and about lower for the keV energy range). Thus, the X-ray luminosity is erg s-1, and the ratio relative to the bolometric luminosity is . This value is about a factor of 3 times lower than the quiescent luminosity measured with XMM-Newton (Stelzer et al. 2006b).
LP 412-31 was also observed with the VLA at 8.46 GHz as part of program AS879 on four separate occasions (2006 October 31 and 2006 November 5, 7, and 9 for a total of about 13.4 hours), and as part of program S90198 simultaneously with the Chandra observation. We obtained the public data from the archive and processed the observations in the manner described in §2.1. The combined 2006 observations reveal a possible weak source coincident with the position of LP 412-31, with a flux of Jy (using only the two longest observations, which account for of the data, we find Jy). In the subsequent simultaneous observation we do not detect any emission at the position of LP 412-31, with a upper limit of Jy. This indicates that the source either fluctuated in brightness by at least a factor of 2, or that the initial weak source was spurious. The resulting limit on the radio luminosity is erg s-1 Hz-1.
Combining the X-ray and radio results, we find a limit of Hz-1, about a factor of 40 times higher than the expected value (Equation 3).
References
- Antonova et al. (2007) Antonova, A., Doyle, J. G., Hallinan, G., Golden, A., & Koen, C. 2007, ArXiv e-prints, 707
- Audard et al. (2007) Audard, M., Osten, R. A., Brown, A., Briggs, K. R., Guedel, M., Hodges-Kluck, E., & Gizis, J. E. 2007, ArXiv e-prints, 707
- Basri & Marcy (1995) Basri, G., & Marcy, G. W. 1995, AJ, 109, 762
- Benz & Guedel (1994) Benz, A. O., & Guedel, M., 285, 621
- Berger (2002) Berger, E. 2002, ApJ, 572, 503
- Berger (2006) Berger, E. 2006, ApJ, 648, 629
- Berger et al. (2001) Berger, E., et al. 2001, Nature, 410, 338
- Berger et al. (2008a) Berger, E., et al. 2008a, ApJ, 676, 1307
- Berger et al. (2008b) Berger, E., et al. 2008b, ApJ, 673, 1080
- Berger et al. (2009) Berger, E., et al. 2009, ApJ, 695, 310
- Berger et al. (2005) Berger, E., et al. 2005, ApJ, 627, 960
- Burgasser & Putman (2005) Burgasser, A. J., & Putman, M. E. 2005, ApJ, 626, 486
- Donati et al. (2008) Donati, J.-F., et al. 2008, MNRAS, 390, 545
- Feigelson et al. (2002) Feigelson, E. D., Broos, P., Gaffney, J. A., III, Garmire, G., Hillenbrand, L. A., Pravdo, S. H., Townsley, L., & Tsuboi, Y. 2002, ApJ, 574, 258
- Fleming et al. (2000) Fleming, T. A., Giampapa, M. S., & Schmitt, J. H. M. M. 2000, ApJ, 533, 372
- Fleming et al. (1993) Fleming, T. A., Giampapa, M. S., Schmitt, J. H. M. M., & Bookbinder, J. A. 1993, ApJ, 410, 387
- Gizis et al. (2000) Gizis, J. E., Monet, D. G., Reid, I. N., Kirkpatrick, J. D., Liebert, J., & Williams, R. J. 2000, AJ, 120, 1085
- Grosso et al. (2007) Grosso, N., et al. 2007, A&A, 468, 391
- Guedel & Benz (1993) Guedel, M., & Benz, A. O. 1993, ApJ, 405, L63
- Hallinan et al. (2007) Hallinan, G., et al. 2007, ApJ, 663, L25
- Hambaryan et al. (2004) Hambaryan, V., Staude, A., Schwope, A. D., Scholz, R.-D., Kimeswenger, S., & Neuhäuser, R. 2004, A&A, 415, 265
- Hawley & Johns-Krull (2003) Hawley, S. L., & Johns-Krull, C. M. 2003, ApJ, 588, L109
- Hook et al. (2004) Hook, I. M., Jørgensen, I., Allington-Smith, J. R., Davies, R. L., Metcalfe, N., Murowinski, R. G., & Crampton, D. 2004, PASP, 116, 425
- James et al. (2000) James, D. J., Jardine, M. M., Jeffries, R. D., Randich, S., Collier Cameron, A., & Ferreira, M. 2000, MNRAS, 318, 1217
- Krishnamurthi et al. (1999) Krishnamurthi, A., Leto, G., & Linsky, J. L. 1999, AJ, 118, 1369
- Martín & Ardila (2001) Martín, E. L., & Ardila, D. R. 2001, AJ, 121, 2758
- Martín & Bouy (2002) Martín, E. L., & Bouy, H. 2002, New Astronomy, 7, 595
- Mohanty & Basri (2003) Mohanty, S., & Basri, G. 2003, ApJ, 583, 451
- Mohanty et al. (2002) Mohanty, S., Basri, G., Shu, F., Allard, F., & Chabrier, G. 2002, ApJ, 571, 469
- Mokler & Stelzer (2002) Mokler, F., & Stelzer, B. 2002, A&A, 391, 1025
- Morin et al. (2008) Morin, J., et al. 2008, MNRAS, 390, 567
- Neuhäuser et al. (1999) Neuhäuser, R., et al. 1999, A&A, 343, 883
- Pizzolato et al. (2003) Pizzolato, N., Maggio, A., Micela, G., Sciortino, S., & Ventura, P. 2003, A&A, 397, 147
- Preibisch & Zinnecker (2002) Preibisch, T., & Zinnecker, H. 2002, AJ, 123, 1613
- Reid & Cruz (2002) Reid, I. N., & Cruz, K. L. 2002, AJ, 123, 2806
- Reid et al. (1999) Reid, I. N., Kirkpatrick, J. D., Gizis, J. E., & Liebert, J. 1999, ApJ, 527, L105
- Reiners & Basri (2006) Reiners, A., & Basri, G. 2006, ArXiv Astrophysics e-prints
- Reiners & Basri (2007) Reiners, A., & Basri, G. 2007, ApJ, 656, 1121
- Reiners & Basri (2008) Reiners, A., & Basri, G. 2008, ApJ, 684, 1390
- Reiners & Basri (2009) Reiners, A., & Basri, G. 2009, A&A, 496, 787
- Robrade & Schmitt (2008) Robrade, J., & Schmitt, J. H. M. M. 2008, A&A, 487, 1139
- Robrade & Schmitt (2009) Robrade, J., & Schmitt, J. H. M. M. 2009, A&A, 496, 229
- Rutledge et al. (2000) Rutledge, R. E., Basri, G., Martín, E. L., & Bildsten, L. 2000, ApJ, 538, L141
- Salim et al. (2003) Salim, S., Lépine, S., Rich, R. M., & Shara, M. M. 2003, ApJ, 586, L149
- Schmidt et al. (2007) Schmidt, S. J., Cruz, K. L., Bongiorno, B. J., Liebert, J., & Reid, I. N. 2007, AJ, 133, 2258
- Schmitt et al. (1995) Schmitt, J. H. M. M., Fleming, T. A., & Giampapa, M. S. 1995, ApJ, 450, 392
- Schmitt & Liefke (2004) Schmitt, J. H. M. M., & Liefke, C. 2004, A&A, 417, 651
- Stelzer (2004) Stelzer, B. 2004, ApJ, 615, L153
- Stelzer et al. (2006a) Stelzer, B., Micela, G., Flaccomio, E., Neuhäuser, R., & Jayawardhana, R. 2006a, A&A, 448, 293
- Stelzer et al. (2006b) Stelzer, B., Schmitt, J. H. M. M., Micela, G., & Liefke, C. 2006b, A&A, 460, L35
- West et al. (2004) West, A. A., et al. 2004, AJ, 128, 426
| Source | Sp. Type | ) | Ref. | ||||
|---|---|---|---|---|---|---|---|
| (pc) | (km s-1) | ||||||
| BRI0021 | M9.5 | 11.5 | 34 | 1-4 | |||
| LSR0602+39 | L1 | 10.6 | 9 | 4-6 | |||
| 2M052314 | L2.5 | 13.4 | 21 | 4,6-8 |
| Source | Date | Time | Exposure | Phase Cal. | Cal. Exposure | |||
|---|---|---|---|---|---|---|---|---|
| (UT) | (UT) | (s) | (s) | (GHz) | (Jy) | |||
| BRI0021 | 2008 Oct 29 | 00:41:03 – 09:38:38 | 220 | J0016002 | 40 | 4.86 | ||
| 8.46 | ||||||||
| LSR0602+39 | 2008 Jan 18 | 01:02:40 – 09:22:30 | 270 | J0555+398 | 30 | 8.46 | ||
| 2M052314 | 2007 Dec 30 | 02:16:00 – 10:07:05 | 280 | J0539158 | 35 | 4.86 | ||
| 8.46 |
Note. — a Limits are .
| Source | Date | Time | Exposure | ||
|---|---|---|---|---|---|
| (UT) | (UT) | (s) | (erg cm-2 s-1) | ||
| BRI0021 | 2008 Oct 29 | 02:44:02 – 11:33:31 | 29797 | ||
| LSR0602+39 | 2008 Jan 18 | 00:27:20 – 09:28:50 | 29664 | ||
| 2M052314 | 2007 Dec 30 | 02:02:46 – 11:01:21 | 29775 |
Note. — a Limits are confidence level.
| Source | Date | Time | Telescope | Exposure | EW | |
|---|---|---|---|---|---|---|
| (UT) | (UT) | (s) | (Å) | |||
| BRI0021 | 2008 Oct 29 | 01:57:58 – 08:10:19 | Gemini-South | |||
| LSR0602+39 | 2008 Jan 18 | 01:13:28 – 09:49:24 | ARC 3.5-m | |||
| 2M052314 | 2007 Dec 30 | 02:02:46 – 11:01:21 | Palomar 60-inch |
Note. — a We did not calibrate the H flux; the purpose of the observations was to search for variability.
| Source | Sp. Type | Ref. | |||||
|---|---|---|---|---|---|---|---|
| VB10 | M8 | / (f) | / (f) | [] | / (f) | [] | Paper II |
| LSR1835 | M8.5 | / (f) | Paper II | ||||
| TVLM513 | M8.5 | / | / (f) | / | / | Paper I | |
| BRI0021 | M9.5 | [ / (f)] | [(f)] | This Paper | |||
| 2M0746+20 | L0 | / | / (f) | 1 | |||
| LSR0602+39 | L1 | This Paper | |||||
| 2M052314 | L2.5 | This Paper | |||||
| 2M0036+18 | L3.5 | / (f) | 2 | ||||
| 2M150716 | L5 | [] | [] | 2 | |||
| Additional Observations from the Literature | |||||||
| VB8 | M7 | / (f) | / (f) | 3,4 | |||
| LHS3003 | M7 | / | / | 3,5,6 | |||
| DENIS1048 | M8 | / (f) | 6,7 | ||||
| Gl234b | M8 | 3,8 | |||||
| LP412-31 | M8 | / (f) | 9-11, This Paper | ||||
| Gl569B | M8.5 | / | 8,12 | ||||
| LHS2924 | M9 | 3 | |||||
| LHS2065 | M9 | / (f) | / (f) | / (f) | 8,13 | ||
| 1RXS1159 | M9 | / (f) | 14,15 | ||||
| LP944-20 | M9 | / (f) | / (f) | (f) / | 16-18 | ||
| Kelu-1 | L2 | 19 | |||||
| HD130948BC | L4 | 20 | |||||
Note. — a The typical value for early and mid M dwarfs is (Hawley & Johns-Krull 2003).
b The expected value at 8.46 GHz based on the radio/X-ray correlation is .
c “(f)” designates flaring emission.
d Values in brackets are from non-simultaneous observations.
e 2M0746+20 is a binary system, and we assume that the observed emission is due to the primary.
References: [1] Berger et al. (2009); [2] Berger et al. (2005); [3] Schmitt et al. (1995); [4] Krishnamurthi et al. (1999); [5] Martín & Ardila (2001); [6] Burgasser & Putman (2005); [7] Schmitt & Liefke (2004); [8] Berger (2006); [9] Stelzer et al. (2006b); [10] Mohanty & Basri (2003); [11] Schmidt et al. (2007); [12] Stelzer (2004); [13] Robrade & Schmitt (2008); [14] Hambaryan et al. (2004); [15] Robrade & Schmitt (2009); [16] Rutledge et al. (2000); [17] Martín & Bouy (2002); [18] Berger et al. (2001); [19] Audard et al. (2007); [20] Stelzer et al. (2006a).