Observation of Single Top Quark Production
Abstract
I report on the observation of electroweak production of single top quarks in collisions at using of data collected with the D0 detector at the Fermilab Tevatron Collider. Using events containing an isolated electron or muon, missing transverse energy, two, three or four jets, with one or two of them identified as originating from the fragmentation of a quark, the measured cross section for the process is pb (for a top quark mass of ). The probability to measure a cross section at this value or higher in the absence of signal is , corresponding to a 5.0 standard deviation significance. Using the same dataset, the measured cross sections for the - and the -channel processes when determined simultaneously with no assumption on their relative production rate are pb and pb respectively, consistent with standard model expectations. The measured -channel cross section has a significance of 4.8 standard deviations, representing the first evidence for the production of an individual single top process to be detected.
I Introduction
The top quark’s large mass, by far the heaviest fundamental particle known, makes it a unique probe of physics at the natural electroweak scale. Although the top quark mass is consistent with other precision electroweak measurements within the framework of the standard model (SM), no fundamental explanation exists for the reasons why top quarks should be so massive. The large mass of the top quark arises from its large couplings to the symmetry breaking sector of the SM. Precision measurements of the top mass, width and couplings may therefore lead to a deeper understanding of electroweak symmetry breaking and the origin of mass. Such measurements are possible in part because the top quark’s natural width of is much greater than the hadronization timescale set by , causing the top quark to decay to a real boson and a bottom quark before hadronization. The top quark can therefore be completely described by perturbative QCD, and studied as a bare quark.
The SM predicts that top quarks are created via two independent production mechanisms in hadron colliders. The primary mode, in which a pair is produced from a vertex via the strong interaction, was used by the D0 and CDF collaborations to establish the existence of the top quark in 1995 top-obs-1995-cdf ; top-obs-1995-d0 , and measure its mass. The second production mode of top quarks at hadron colliders is the electroweak production of a single top quark from a vertex. The predicted cross section for single top production is about half that of pairs, but the signal-to-background ratio is much worse; measurement of the single top quark production cross section has therefore until recently been impeded by its low rate and difficult background environment compared to the top pair production.
Extracting a single top signature would be an independent confirmation of the top quark existence and a means to measure the Cabibbo-Kobayashi-Maskawa (CKM) matrix element , and study the coupling. Measuring the single top quark production cross section is also crucial in understanding the backgrounds to searches for the Higgs Boson and new physics beyond-the-SM. In this paper I describe the analysis that led to the observation of single top production d0_obs by the D0 collaboration, and the measurement of the corresponding production cross sections.
II Single Top Quark Production
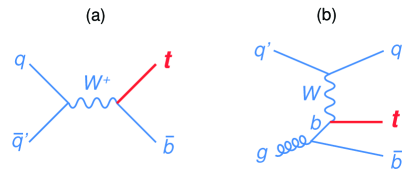
In the SM, single top production at hadron colliders provides an opportunity to study the charged-current weak-interaction of the top quark. Figure 1 shows representative Feynman diagrams for single top quark production at hadron colliders for -channel (Fig. 1a), and -channel production (Fig. 1b). A third process, usually called “associate production”, in which the top quark is produced together with a boson, has negligible cross section at the Tevatron.
The SM predicts that the top quark decays almost exclusively to a boson and a bottom quark with . The rate for the process leads to a firm prediction for the top quark decay width . A direct measurement of is of great importance, because the width would be affected by any non-expected decay modes of the top quark, whether they are observed or not. Unfortunately, cannot be directly measured in the sample at hadron colliders, but its main component can be accessed through single top processes. If there are only three generations, the unitarity constrain of the CKM matrix implies that is very close to unity. But, the presence of a heavy fourth generation quark with a large CKM coupling to the top quark could be consistent with large values of , while resulting in an almost entirely unconstrained value for . A direct measurement of can therefore explore the possibility of a fourth generation, and confirm that the top quark discovered at the Tevatron is indeed the SU(2) partner of the bottom quark.
As can be seen from the Feynman diagrams, the single top production cross section is proportional to . A measurement of the single top quark production cross section therefore provides the only known way to directly measure at a hadron collider.
III Event Selection and Modeling
The D0 detector d0_nim is a multi-purpose apparatus designed to study collisions at high energies. It consists of three major subsystems. At the core of the detector, a magnetized tracking system precisely records the trajectories of charged particles and measures their transverse momenta. A hermetic, finely-grained uranium and liquid argon calorimeter measures the energies of electromagnetic and hadronic showers. A muon spectrometer measures the momenta of muons.
The result presented in this document is based on of data recorded using the D0 detector between 2002 and 2007. The data were collected with a logical OR of many trigger conditions that results in a fully efficient trigger selection for the single top signal. Events are selected containing exactly one isolated high electron or muon, missing transverse energy, and at least two jets, with at least one jet being identified as originating from the fragmentation of a quark. The is required not to be aligned with the direction of the lepton or the leading jet to limit the number of events originating from QCD multijet production entering our candidate samples. The data are divided into 24 mutually exclusive subsamples to take advantage of the different signal:background ratios and dominant sources of background. The sample is divided based on the Tevatron running period (Run IIa or Run IIb), the lepton flavor ( or ), the jet multiplicity (2, 3 jets or 4 jets), and the number of jets identified as originating from quarks (1 or 2 -tags). In each case, the leading -tagged jet is required to have . The efficiency of this selection is for -channel and for -channel single top production.
Single top signal events are modeled using the comphep-based next-to-leading order (NLO) Monte Carlo (MC) event generator singletop singletop-mcgen . The singletop generator is chosen as it preserves the spin information for the decay products of the top quark and resulting boson. pythia pythia is used to model the hadronization of any generated partons. We assume SM production for the ratio of the and cross sections. The , +jets, and +jets backgrounds are simulated using the alpgen leading-log MC event generator alpgen , with pythia used to model hadronization. The background is normalized to the predicted cross section for a top quark mass of ttbar-xsec . The normalization of the +jets background is obtained by scaling the alpgen cross sections by factors derived from calculations of NLO effects mcfm . and are scaled by 1.47, and by 1.38. and are scaled by 1.52 and 1.67. Diboson backgrounds are modeled using pythia.
All MC events are passed through a geant-based simulation geant of the D0 detector. Small additional corrections are applied to all reconstructed objects to improve the agreement between collider data and simulation. In particular, we correct mismodeling of the pseudorapidity of the jets, and the distance between the two leading jets in the +jets sample.
The multijet background is modeled using collider data containing leptons that are not isolated. In the electron channel, the transverse momentum of the lepton is reweighted to properly match the shape of the background events passing the candidate selection. To increase the statistics in the muon channel, the jet closest to the muon is removed and recalculated. Cuts on the total transverse energy of the event () ensure that the multijet background is a small (less than 5%) contribution to the candidate sample. The overall normalization of the multijet and the total +jets background is obtained by comparing the background expectation to collider data in three sensitive variables: , , and the boson transverse mass. This normalization is done after subtracting from the data sample the contributions from the small backgrounds ( , +jets, and dibosons) separately for each running period (Run IIa or Run IIb), leptonic channel ( or ), and jet multiplicity bin (2, 3, or 4 jets). The normalization is performed before -tagging, when the expected signal to background ratio is on average S:B=1:260.
The probability of the -tagging algorithm to identify a jet as originating from a -quark is measured in data containing jets and muons, and is parametrized as a function of jet flavor, , and with so-called tag-rate-functions. We find that after -tagging, an additional empirical correction needs to be applied to the normalization of the and samples. The correction factor of is derived from the two-jet data sample and applied to all jet multiplicity bins; the overall +jets normalization remains unchanged. After -tagging the expected S:B=1:21 for the sample with 1 -tag and 1:15 for the sample with 2 -tags.
Using of data we selected 4,519 events, and expect single top quark events. The summary of event yields as a function of jet multiplicity can be seen in Table 1.
| Source | 2 jets | 3 jets | 4 jets |
|---|---|---|---|
| + signal | |||
| +jets | |||
| +jets and dibosons | |||
| , +jets | |||
| Multijets | |||
| Total prediction | |||
| Data | 2,579 | 1,216 | 724 |
Systematic uncertainties are considered for all corrections applied to the background model. Most affect only the normalization, but the corrections for the jet energy scale (JES), the tag-rate functions (TRF), and the reweighting of the kinematic distributions in +jets events modify in addition the shapes of the background distributions. The largest uncertainties come from JES and TRF, with smaller contributions from MC statistics, the correction for jet-flavor composition in +jets events, and from the +jets, multijets, and normalizations. The total uncertainty on the background is (8–16)% depending on the analysis channel.
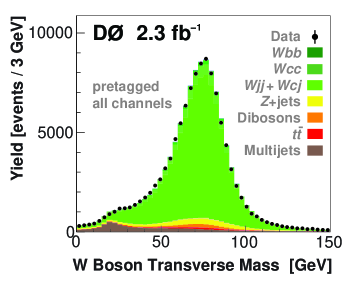
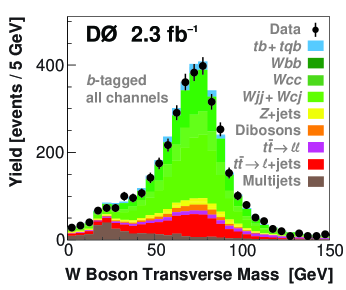
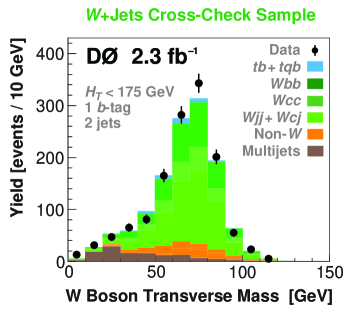
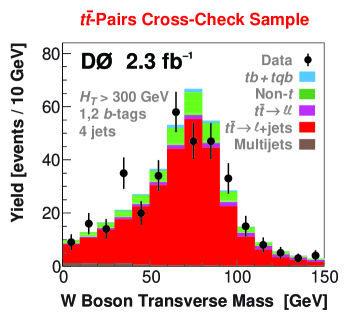
The background model has been checked for normalization and shape in hundreds of distributions in each of the 24 individual analysis channels, before and after tagging. In addition, we also define two cross-check samples to check the background model components separately for the two main backgrounds: +jets, and . The +jets dominated sample has low , exactly two jets, and only one -tagged jet. The dominated sample sample has high , exactly four jets, and one or two -tags. We find good agreement for both normalization and shape in all variables studied for our signal and cross-check samples. Figure 2 shows the transverse mass distribution for all 24 channels combined as an example of such tests.
IV Multivariate Analysis Techniques
As can be seen in Table 1, the uncertainty on the background is larger than the expected signal. We therefore need to improve the discrimination between signal and background employing multivariate analysis (MVA) techniques .
We have improved and optimized three of these techniques following our 2006 single top evidence analysis, described in detail in Ref. d0-prd-2008 : boosted decision trees (BDT) decision-trees ; bdt-benitez ; bdt-gillberg , Bayesian neural networks (BNN) bayesianNNs ; bnn-tanasijczuk , and the matrix element (ME) method matrix-elements ; me-pangilinan . Improvements include a larger set of input variables for the BDT and BNN analysis from five categories: single object kinematics, global event kinematics, jet reconstruction, top quark reconstruction, and angular correlations. The BDT method uses a common set of 64 variables for all analysis channels, while the BNN method uses the RuleFitJF algorithm rulefit to select the most sensitive kinematic variables, keeping between 18 and 28 of these as inputs, depending on the analysis channel. The ME analysis uses only 2-jet and 3-jet events and splits the analysis into low and high regions. An additional improvement is the inclusion of matrix elements for more background sources: , , , and diagrams in the 2-jet bin and in the 3-jet bin.
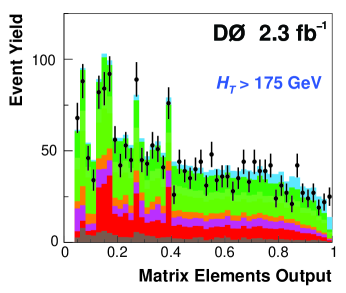
All three analyses transform their output distributions to ensure that every bin has at least 40 background MC events before normalization, so that there are no bins with a nonzero signal prediction or data but not enough background in the model to use that information. Figure 3 shows the discriminant output distributions for the three MVA techniques. It is important to note that the plots show the sum of the individual discriminant outputs for each of the 24 individual analysis channels, which are treated as independent in the cross section extraction.
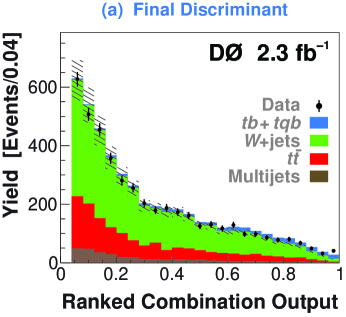
Even though the three MVA techniques use the same data sample they are not 100% correlated, in fact, BDT and BNN are 75% correlated with each other and 60% correlated with ME. We therefore combine these methods using an additional BNN (BNNComb) that takes as input the output discriminats of the BDT, BNN and ME methods, and produces a single combination output discriminant. This BNNComb leads to an increased expected sensitivity and a more precise measurement of the single top cross section.
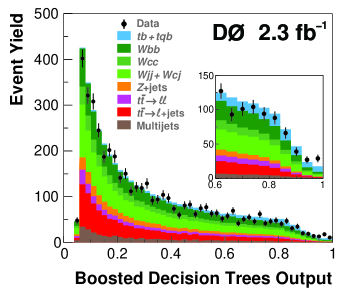
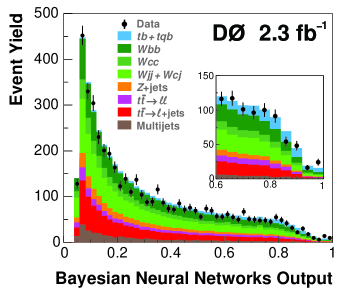
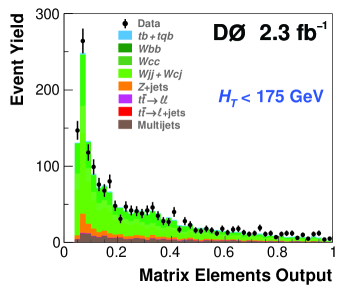
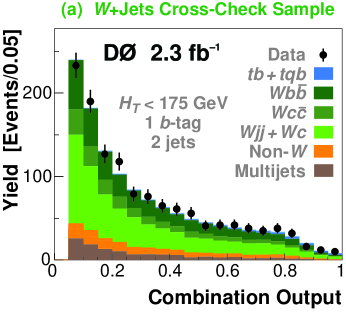
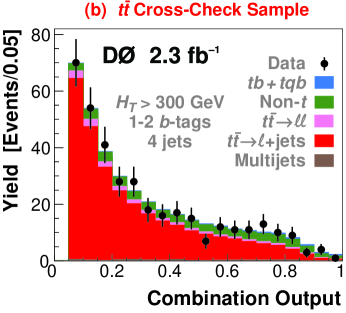
We tested each MVA technique (BDT, BNN, ME and BNNComb) generating ensembles of pseudodatasets created from background and signal at different cross sections to confirm a linear response and an unbiased cross section measurement. The output discriminants have also been produced for the +jets and cross-check samples and demonstrate that the backgrounds are well-modeled across the full range of the discriminant output. Figure 4 shows the combination discriminant outputs for the cross-check samples.
V Cross Sections
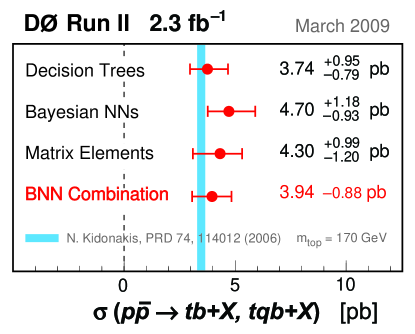
The single top production cross section is measured using a Bayesian approach as in our previous results d0-prl-evidence ; d0-prd-2008 . A binned likelihood is formed as a product over all bins and channels, evaluated separately for each MVA technique. The central value of the cross section is given by the position of the peak in the posterior density, and the interval about the peak gives the uncertainty. The sensitivity of each analysis to a contribution from single top quark production is estimated by generating ensembles of pseudodatasets that sample the background model and its uncertainties in the absence of signal. A cross section is measured from each pseudodataset, which allows us to calculate the probability to measure the SM cross section (“expected significance”) or the observed cross section (“observed significance”). Table 2 summarizes the measured cross section, and the expected and observed significance for each MVA technique. The cross section measured by the BNNComb has a -value of , corresponding to a significance of , and to the observation of single top production.
| MVA | (pb) | Expected (SD) | Observed (SD) |
|---|---|---|---|
| BDT | 4.3 | 4.6 | |
| BNN | 4.1 | 5.2 | |
| ME | 4.1 | 4.9 | |
| BNNComb | 4.5 | 5.0 |
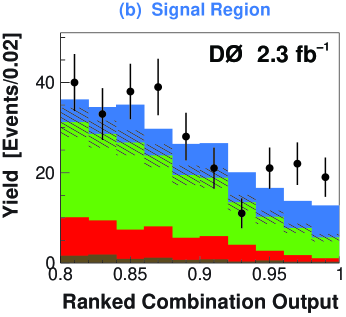
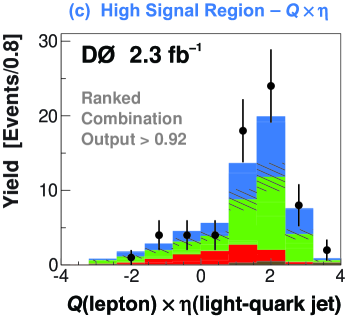
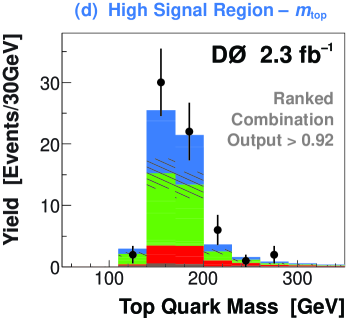
Figure 5 shows the distribution of the combination output and examples of variables with high sensitivity to the signal, which illustrate the importance of the signal to achieve a good modeling of the data. Figure 6 summarizes the cross sections measured by each of the MVA techniques and compares them to theoretical predictions singletop-xsec-kidonakis .
VI -Channel Production
The analysis presented in the previous section measured the combined single top cross production section assuming the ratio between the - and -channel production modes to be fixed, and given by the SM. However, this ratio could be modified by beyond-the-SM physics processes, for instance additional quark generations, new heavy bosons Tait:2000sh , flavor-changing neutral currents d0-fcnc , or anomalous top quark couplings singletop-wtb-heinson ; d0-singletop-wtb ; Abazov:2009ky . It is therefore of interest to measure the two production modes individually, and compare them to theoretical predictions.
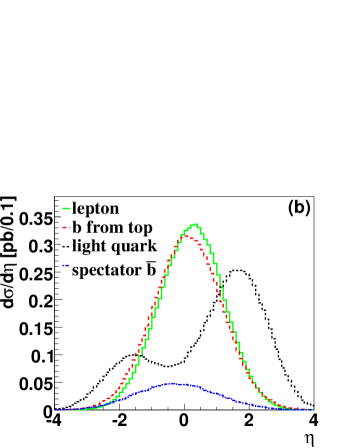
In this section I present a recent D0 analysis tchannel that uses the same dataset, event selection, and signal/background modeling as the observation analysis presented in the previous section, but the MVA filters are specifically trained to extract the single top quark events produced via the -channel mode. This results in a measurement of the -channel cross section that is independent of the -channel cross section model. Even though we use the same set of variables as in the observation analysis, only -channel single top events are considered signal during the optimization. -channel single top events are considered together with other background processes, and its rate is normalized to the SM expectation singletop-xsec-kidonakis . Figure 7 shows the parton-level pseudorapidity distribution of the final state objects in top production (excluding antitop). The most sensitive variable that separates -channel events from both the -channel and the backgrounds is the pseudorapidity distribution of the light quark jet.
We use the same three MVA techniques (BDT, BNN and ME) and a forth one for the combination (BNNComb). We test each of them for linearity and unbiased cross section measurement, and confirm that the backgrounds are well-modeled across the entire range of the output discriminants for the +jets and cross-check samples.
We use the same Bayesian statistical analysis to measure the production cross sections. First, we compute the two-dimensional posterior probability density as a function of both -channel and -channel single top cross sections. The resulting posterior probability density is shown in Fig. 8.
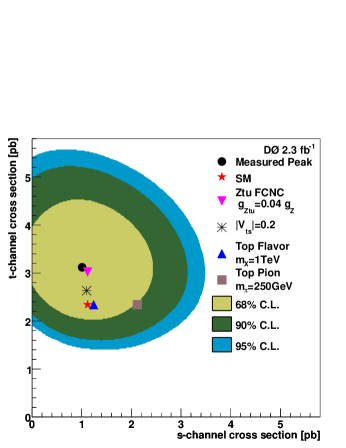
Next, we integrate over the -channel axis in Fig. 8 to obtain the -channel posterior probability density without any assumptions about the value of the -channel cross section. We have verified the linearity of the procedure and its independence of the input -channel cross section with ensembles of pseudo-datasets generated at several different -channel and -channel cross sections. An equivalent procedure is performed to obtain the -channel posterior probability density by integrating over the -channel axis. The resulting production cross section for single top quark production is pb for the -channel and pb for the -channel. Both are in good agreement with the SM predictions singletop-xsec-kidonakis of pb and pb, respectively (for a top quark mass of GeV). The measured -channel cross section has a p-value of , corresponding to a Gaussian significance of 4.8, and represents the first direct evidence of single top quark -channel production.
VII Summary
The D0 collaboration has reported the observation of single top quark production using 2.3 fb-1 of data collected at the Fermilab Tevatron. The measured cross section for the combined + channels is pb, corresponding to an excess of signal over the predicted background with a significance of . This measurement assumes the ratio between the - and -channel production modes is fixed, and given by the SM. Using the same dataset and MVA techniques, the analysis is modified to remove this assumption and uses the -channel characteristics to measure the -channel and -channel cross sections simultaneously. This results in a -channel measurement that is independent of the -channel cross section model. The resulting cross sections are and , in agreement with SM predictions. The measured -channel cross section corresponds to an excess of signal over the predicted background with a significance of , and is the first analysis to isolate an individual single top quark production channel.
Acknowledgements.
We thank the staffs at Fermilab and collaborating institutions, and acknowledge support from the DOE and NSF (USA); CEA and CNRS/IN2P3 (France); FASI, Rosatom and RFBR (Russia); CNPq, FAPERJ, FAPESP and FUNDUNESP (Brazil); DAE and DST (India); Colciencias (Colombia); CONACyT (Mexico); KRF and KOSEF (Korea); CONICET and UBACyT (Argentina); FOM (The Netherlands); STFC (United Kingdom); MSMT and GACR (Czech Republic); CRC Program, CFI, NSERC and WestGrid Project (Canada); BMBF and DFG (Germany); SFI (Ireland); The Swedish Research Council (Sweden); CAS and CNSF (China); and the Alexander von Humboldt Foundation (Germany).References
- (1) F. Abe et al. (CDF Collaboration), “Observation of Top Quark Production in Collisions with the Collider Detector at Fermilab,” Phys. Rev. Lett. 74, 2626 (1995).
- (2) S. Abachi et al. (D0 Collaboration), “Observation of the Top Quark,” Phys. Rev. Lett. 74, 2632 (1995).
- (3) V.M. Abazov et al. (D0 Collaboration), “Observation of Single Top-Quark Production,” Phys. Rev. Lett. 103, 092001 (2009).
- (4) V.M. Abazov et al., D0 Collaboration, “The Upgraded D0 Detector,” Nucl. Instr. and Methods A 565, 463 (2006).
- (5) E.E. Boos et al., “Method for Simulating Electroweak Top-Quark Production Events in the NLO Approximation: SingleTop Event Generator,” Phys. Atom. Nucl. 69, 1317 (2006). We used singletop version 4.2p1.
- (6) T. Sjöstrand, S. Mrenna, and P. Skands, “PYTHIA 6.4 Physics and Manual,” J. High Energy Phys. 05 (2006) 026. We used pythia version 6.409.
- (7) M.L. Mangano et al., “ALPGEN, a Generator for Hard Multiparton Processes in Hadronic Collisions,” J. High Energy Phys. 07 (2003) 001. We used alpgen version 2.11.
- (8) N. Kidonakis and R. Vogt, “Next-to-Next-to-Leading Order Soft Gluon Corrections in Top Quark Hadroproduction,” Phys. Rev. D 68, 114014 (2003). At GeV, pb.
- (9) J.M. Campbell and R.K. Ellis, “Next-to-Leading Order Corrections to =2 Jet and +2 Jet Production at Hadron Colliders,” Phys. Rev. D 65, 113007 (2002). We used mcfm version 5.1.
- (10) R. Brun and F. Carminati, “GEANT: Detector Description and Simulation Tool,” CERN Program Library Long Writeup, Report No. W5013, 1993.
- (11) V.M. Abazov et al. (D0 Collaboration), “Evidence for Production of Single Top Quarks and First Direct Measurement of ,” Phys. Rev. Lett. 98, 181802 (2007).
- (12) V.M. Abazov et al. (D0 Collaboration), “Evidence for Production of Single Top Quarks,” Phys. Rev. D 78, 012005 (2008).
- (13) L. Breiman et al., Classification and Regression Trees (Wadsworth, Stamford, 1984).
- (14) J.A. Benitez, Ph.D. thesis, Michigan State University, 2009.
- (15) D. Gillberg, Ph.D. thesis, Simon Fraser University, 2009.
- (16) R.M. Neal, Bayesian Learning for Neural Networks (Springer-Verlag, New York, 1996).
- (17) A. Tanasijczuk, Ph.D. thesis, Universidad de Buenos Aires, in preparation.
- (18) V.M. Abazov et al. (D0 Collaboration), “A Precision Measurement of the Mass of the Top Quark,” Nature 429, 638 (2004).
- (19) M. Pangilinan, Ph.D. thesis, Brown University, in preparation.
- (20) J.H. Friedman and B.E. Popescu, “Predictive Learning via Rule Ensembles,” Ann. Appl. Stat. 2, 916 (2008).
- (21) N. Kidonakis, “Single Top Quark Production at the Fermilab Tevatron: Threshold Resummation and Finite-Order Soft Gluon Corrections,” Phys. Rev. D 74, 114012 (2006). The cross sections for the single top quark processes ( GeV) are pb (-channel) and pb (-channel).
- (22) T. Tait and C.-P. Yuan, “Single Top Quark Production as a Window to Physics Beyond the Standard Model,” Phys. Rev. D 63, 014018 (2001).
- (23) V.M. Abazov et al. (D0 Collaboration), “Search for Production of Single Top Quarks via Flavor-changing Neutral Currents at the Tevatron,” Phys. Rev. Lett. 99, 191802 (2007).
- (24) A.P. Heinson, A.S. Belyaev, and E.E. Boos, “Single Top Quarks at the Fermilab Tevatron,” Phys. Rev. D 56, 3114 (1997).
- (25) V.M. Abazov et al. (D0 Collaboration), “Search for Anomalous Couplings in Single Top Quark Production,” Phys. Rev. Lett. 101, 221801 (2008).
- (26) V. M. Abazov et al. (D0 Collaboration), “Search for Anomalous Top Quark Couplings with the D0 Detector,” Phys. Rev. Lett. 102, 092002 (2009).
- (27) V.M. Abazov et al. (D0 Collaboration), “Measurement of the -channel Single Top Quark Production Cross Section,” arXiv:0907.4259, submitted to Phys. Lett. B.