V2467 Cygni as possible intermediate polar
Abstract
We present the results of unfiltered and band CCD photometry fast nova V2467Cyg. Our analysis of the data gives two distinct frequencies corresponding to periods of 3.8h and 35 min. The observed light curve of V2467 Cyg is typical for an intermediate polar.
Centre for Astronomy, Nicolaus Copernicus University,
87-100 Torun, ul. Gagarina 11, Poland
1 Introduction
Classical novae belong to wide class of cataclysmic variables characterized by such commonly features as accretion from the Roche lobe filling star to its compact companion (most often white dwarf) and by outbursts connected with rapid rise in brightness. Location of accretion material depends on angular momentum distribution and on magnetic field of primary. In most cases, stream of matter forms keplerian disc around white dwarf before fall onto its surface. In some systems with the magnetic white dwarf, called intermediate polar, field is strong enough () to allow material at the outer edge of disc to become magnetically controlled. Accretion can be channeled by bipolar magnetic field on small fraction of primary surface near poles. Both hot regions are sources of anisotropy of emission observed during rotation of white dwarf in X-ray and optical.
Here we present observations of the fast nova V2467 Cygni, which was discovered by Ahikigo Tago in March 2007 at 7.4 mag Nakano et al, (2007). About twenty days after outburst, extremely strong OI line at 8446 was presented in spectra as result of overabundance of oxygen Tomov et al, (2007). During the transition phase, which was started in April, six quasiperiodic oscillations with period from 19 to 25 days and amplitude about 0.7 mag were observed Kato et al, (2007). One year after this, Ness et al, (2008) reported that V2467 Cygni is a soft X-ray source and blackbody fitted to its spectra gave parameter kT=34eV.
2 Observations and Analysis
We obtained our photometric data using the Cassegrain 60cm telescope with SBIG STL-1001 camera located in Piwnice Observatory near Torun. The data was collected during two observational seasons from 12 April 2007 to 28 May 2007 and from 25 june to 23 October 2008 and include mesurements taken with filters to construct long-term light curve. At the same time, we carried out thirty one-night monitorings to find short time scale variability mainly in V and passband in 2007 and of white light in 2008. First search results was presented in Tomov et al, (2007) and are agreeable with the one presented below.
2.1 2007 data
Transition phase of this nova started about one month after outburst when nova faded about 4 magnitudes. In this time, we monitored this star about 30 hours in and 24 hours in V passband. We analysed data in two filters separately with Fourier methods. The best fitted periods were 3.46.5 min and 3.40.5 min in and V respectively.

2.2 2008 data
In 2008, over year after outburst nova was too faint to observe with our telescope and with filters, so we observed white light. In all, we collected 22 hours of observations which showed two significal variabilities. We confirm that longer variability, about 3.45.5 min, was observed also in 2007.

Our attention was concentrated on stable changes with period about 40 minutes and amplitude about 0.15 mag. We don’t have any evindence for exsist changes with this period in 2007 data. This period is too short to connect its with orbital motion. We used timing methods on maximas to check if this changes are coherent. On base of this measurements we constructed O-C diagram and computed ephemeris .


2.3 X-ray data
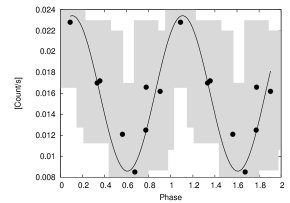
We completed X-ray data obtained in September 2008 using Swift satellite include 1500 second of observation. Eight points, each include information about several minutes of expositions, were phased with ephemeris showed above. We attached to single points also errorbar connected with exposition time (x-axis) and range from maximum and minimum counts rate (y-axis).
3 Conclusion
We found short coherent period in optical light curve and confirm that there changes are also visible in X-ray. Our colour light curve show that amplitude of short variations increase in longer wavelength, so cannot be connected with disc instabillity or with pulsations of white dwarf. We can explain it with intermediate polar model when magnetic field have influence on accretion near white dwarf.
4 Acknowledgments
This work was supported by the Polish MNiSW Grant N203 018 32/2338.
References
- Kato et al, (2007) Kato T., 2007, Vsnet alert, No. 9423
- Nakano et al, (2007) Nakano, S. et al. 2007, IAUC, No. 8821
- Ness et al, (2008) Ness, J.-U. et al. 2008, ATel, No. 1747
- Tomov et al, (2007) Tomov, T. et al 2007, IBVS, No. 5779
M. Friedjung: How much had the nova faded, when you saw the 3h periodicity? Had the optically thick wind stopped by then? Did nova V2467 have oscillations several magnitudes below optical maximum?
E. Swierczynski: Nova had faded quickly about 4 magnitudes to the point when we could observed radiation from the star itself. In the same time, V2467 Cygni was entering brightness oscilations during transition phase with period from 19 to 25 days.
S. Katajainen: Did you calculated beat period using possible spin of 40 min and = 3h48min? Any signs of beat period in fourier analysis? What about Balmer lines in spectrum?
E. Swierczynski: In fact, we observed short variability as superposition of orbital motion and rotaion of white dwarf. In periodogram we can see sign of beat period but not clearly. We have not any spectra obtainted in this time.