Towards the Properties of Long Gamma-Ray Burst Progenitors with Swift Data111Send offprint request to: Enwei Liang (lew@gxu.edu.cn)
Abstract
We investigate the properties of both the prompt and X-ray afterglows of gamma-ray bursts (GRBs) in the burst frame with a sample of 33 Swift GRBs. Assuming that the steep decay segment in the canonical X-ray afterglow lightcurves is due to the curvature effect, we fit the lightcurves with a broken power-law to derive the zero time of the last emission epoch of the prompt emission () and the beginning as well as the end time of the shallow decay segment ( and ). We show that both the isotropic peak gamma-ray luminosity () and gamma-ray energy () are correlated with the isotropic X-ray energy () of the shallow decay phase and the isotropic X-ray luminosity at (). We infer the properties of the progenitor stars based on a model proposed by Kumar et al. who suggested that both the prompt gamma-rays and the X-ray afterglows are due to the accretions of different layers of materials of the GRB progenitor star by a central black hole (BH). We find that most of the derived masses of the core layers are , and their average accretion rates in the prompt gamma-ray phase are /s, with a radius of cm. The rotation parameter is correlated with the burst duration, being consistent with the expectation of collapsar models. The estimated radii and the masses of the fall-back materials for the envelope layers are cm and , respectively. The average accretion rates in the shallow decay phase are correlated with those in the prompt gamma-ray phase, but they are much lower, i.e., /s. The values are smaller than the photospheric radii of Wolf-Rayet (WR) stars. In our calculation, we assume a uniform mass of the central BH (). Therefore, we may compare our results with simulation results. It is interesting that the assembled mass density profile for the bursts in our sample is well consistent with the simulation for a pre-supernova star with mass .
keywords:
radiation mechanisms: non-thermal: gamma-rays: bursts: X-rays1 Introduction
One of the unexpected findings with the X-Ray Telescope (XRT) on-board the gamma-ray burst (GRB) mission Swift is the discovery of a canonical X-ray lightcurve, which shows successively four power-law decay segments with superimposed erratic flares (Zhang et al. 2006; Nousek et al. 2006). It starts with an initial steep decay following the prompt emission. This phase usually lasts hundreds of seconds and could be generally explained as the tail emission of the prompt GRB due to the curvature effect (Kumar & Panaitescu 2000; Qin et al. 2004; Qin 2008; Zhang et al. 2006; Liang et al. 2006; Zhang et al. 2007a, 2009). A shallow decay segment, which lasts from hundreds to thousands of seconds, is usually seen following the GRB tail (O’Brien et al. 2006; Liang et al. 2007). It transits to a normal decay segment or a sharp drop (Troja et al. 2007; Liang et al. 2007).
Phenomenologically, the canonical lightcurves are well fitted with a two-component model (Willingale et al. 2007; Ghisellini 2008), but the physics that shapes the canonical XRT lightcurves is unclear (Zhang 2007). The origin of the shallow decay segment is under debate. The normal decay segments following the shallow decay segment are roughly consistent with the forward shock models (Willingale et al. 2007; Liang et al. 2007), favoring the long lasting energy injection models for the shallow-decay segments (Zhang 2007). The chromatic transition time observed in both the X-ray and optical afterglows challenges this scenario (Fan & Piran 2006; Panaitescu 2007; Liang et al. 2007).
Alternative models were proposed to explain the shallow decay segment(see review by Zhang 2007). The shallow decay would result in a high gamma-ray efficiency (e.g. Zhang et al. 2007), and Ioka et al. (2006) proposed that the efficiency crisis may be avoided if a weak relativistic explosion occurs s prior to the main burst or if the microphysical parameter of the electron energy increases during the shallow decay. Shao & Dai (2007) interpreted the X-ray lightcurve as due to dust scattering of some prompt X-rays(c.f., Shen et al. 2009). The scattering of the external forward-shock or of the internal shock synchrotron emission by a relativistic outflow could also explain the observed X-ray afterglows (Shen et al. 2006; Panaitscu 2007). Uhm & Beloborodov (2007) and Genet, Daigne & Mochkovitch (2007) interpreted both X-ray and optical afterglow as emission from a long-lived reverse shock. Liang et al. (2007) argued that the physical origin of the shallow decay segment may be diverse and those shallow decay segments following an abrupt cutoff might be of internal origin (see also Troja et al. 2007). Ghisellini et al. (2007) suggested that the shallow-to-normal transition in the X-ray afterglows may be produced by late internal shocks, and the transition is due to the jet effect in the prompt ejecta (see also Nava et al. 2007). Racusin et al. (2009) also suggested that the shallow-to-normal transition may be a jet break occurring during energy injection. Interestingly, Yamazaki (2009) recently suggested that the X-ray emission might be an independent component prior to the GRB trigger. By shifting the zero time point of the shallow-to-normal decay segment in the canonical XRT lightcurves, Liang et al. (2009) found that the shallow-to-normal decay behavior might be due to a reference time effect.
It has long been speculated that long GRBs are associated with the deaths of massive stars and hence supernovae (SNe) (Colgate 1974; Woosley 1993; see Zhang & Mészáros 2004; Piran 2005; Mészáros 2006; Woosley & Bloom 2006 for reviews). The collapsar model is the most promising scenario, in which the GRB jets are powered by the accretion of an accretion disk or a torus fed by the fall-back material from the collapsar envelope (e.g., Popham et al. 1999; Narayan et al. 2001; Kohri & Mineshige 2002; Di Matteo et al. 2002; Kohri et al. 2005; Lee et al. 2005; Gu et al. 2006; Chen & Beloborodov 2007; Liu et al. 2007; Kawanaka & Mineshige 2007; Janiuk et al. 2007; Janiuk & Proga 2008). Kumar et al. (2008a, b) proposed that the canonical lightcurves may be produced by the mass-accretion of different layers of progenitor stars. In the framework of their model, the X-ray emission of GRBs may give insight into the properties of the progenitors. In this paper we investigate the characteristics of the X-ray afterglow lightcurves in the GRB rest frame and infer the properties of progenitor stars with a sample of 33 GRBs based on the model of Kumar et al. Our sample selection and the method are presented in §2. In §3, we give the correlations between the prompt gamma-rays and the X-rays in the shallow decay segment. Inferred parameters of progenitor stars are reported in §4. The results are summarized in §5 with some discussion. Throughout, a concordance cosmology with parameters km s-1 Mpc-1, , and are adopted.
2 Data
The XRT data are downloaded from the Swift data archive. The HEAsoft packages, including Xspec, Xselect, Ximage, and Swift data analysis tools, are used for the data reduction. We use an IDL code developed by Zhang et al. (2007b) to automatically process the XRT data for all the bursts detected by Swift/BAT with redshift measurements up to October of 2008. Our sample includes only those XRT lightcurves that have a clear initial steep decay segment, a shallow decay segment, and a normal decay segment. We get a sample of 33 GRBs. We fit the spectra accumulated in the steep and shallow segments with an absorbed power law model and derived their spectral indices222Although the steep decay segment has significant spectral evolution (Zhang et al. 2007b), we derive only the time-integrated spectral index for our analysis.. Regarding the steep decay segment as a GRB tail due to the curvature effect (e.g., Liang et al. 2006, Zhang et al. 2007a, 2009; Qin 2009), we estimate the time of last emission episode of the GRB phase with the relation (Kumar et al. 2000; Liang et al. 2006). We fit the steep-to-shallow decay segment with,
| (1) |
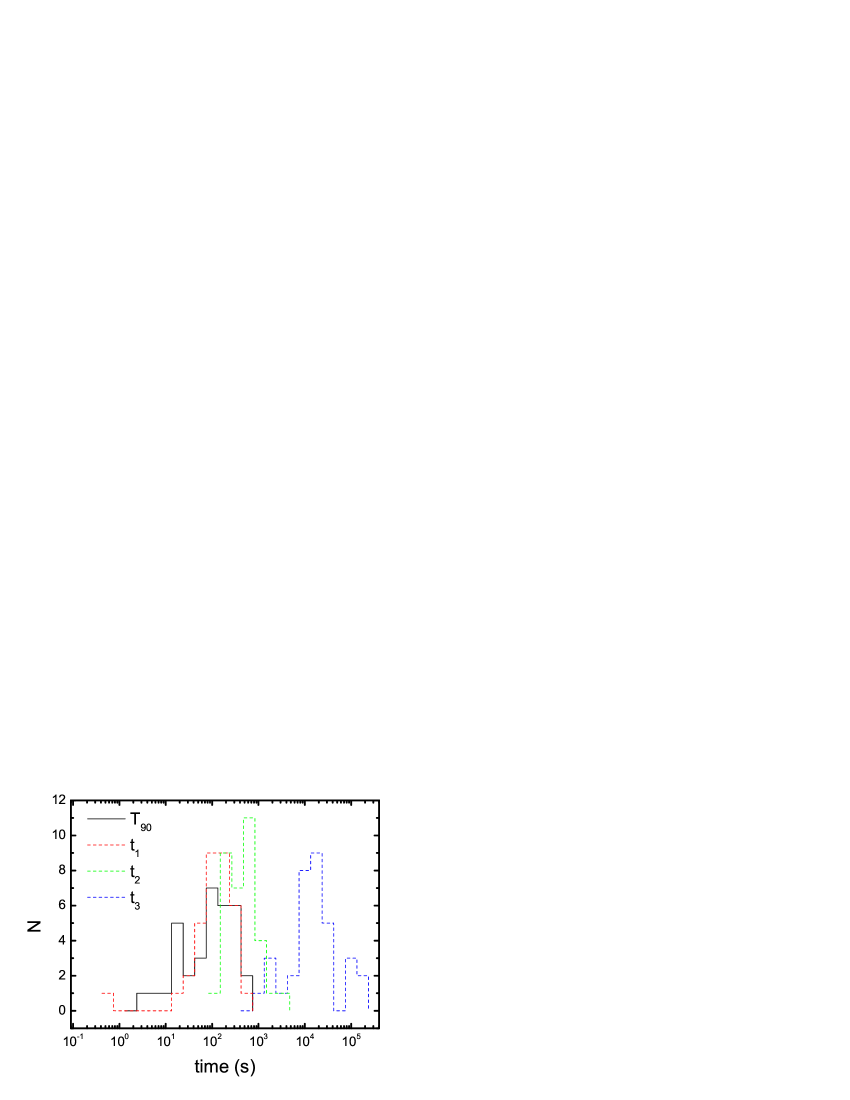
where is zero time point of the last emission epoch of the prompt gamma-rays and is the starting time of the shallow decay segment. The end time of the shallow decay segment () is taken as the break time between the shallow to normal decay phases. Flares in the steep-to-shallow decay segments are removed, if any. Technically, the shallow decay segments are poorly sampled for some GRBs. We fix the value in order to get a reasonable fit. Illustrations of our fitting results for 24 bursts of our sample are shown in Figure. 1. We derive the X-ray fluence in the time interval [, ] in the XRT band and calculate the isotropic X-ray energy with , where is the luminosity distance. The isotropic peak fluxes of the prompt gamma-rays () are in 1024 ms timescale. We take the X-ray luminosity at , , as a characteristic luminosity of the shallow decay segment. Our results are summarized in Table 1. With the data reported in Table 1, we show the distributions of , , and in comparison with GRB duration in Figure 2. It is found that the distribution of is comparable to , is about seconds, and is in seconds.
3 Correlations
The correlations between the prompt gamma-rays and the X-rays in the shallow decay segment may reveal some physical relations between these two phases. We show the pair correlation of the observables between the two phases in Figure 3, and measure these correlations with the Spearman correlation analysis. Our results are reported in Table 2. We find that there are several outliers at s in the correlation of and . It seems natural that for long bursts could be a mark of the end of the prompt emission epoch and will be very likely approximately equal to , since the time of the last pulse should occur close to the end of the overall emission. This breaks down for shorter bursts, where the offset between and becomes important. We also find that is not correlated with the time intervals and , indicating that the break features in the XRT lightcurves are independent of the durations of the prompt gamma-rays. The energy releases in the two phases are strongly correlated. The and are correlated with the X-ray luminosity at (). This fact likely suggests that the two phases may have related energy budgets from the same central engine, and the physical conditions to power the gamma-rays and the X-rays should be similar.
4 Properties of Progenitor Stars
Kumar et al. (2008a, b) proposed that the prompt gamma-rays and X-ray afterglows are due to accretion of different layers of a collapsar by a newly-formed black hole (BH) with 10. In their model, the highly variable lightcurves of the prompt gamma-rays are explained as production of the accretion of the dense, clumpy materials of the stellar core, and the power-law decay X-rays may be due to the accretion of the fall-back materials of the progenitor envelope. In this section, we derive the properties of the progenitor stars based on the model of Kumar et al.
As mentioned by Kumar et al. (2008b) and from the numerical simulations from GRMHD by McKinney (2005), the efficiency of the accreted energy to the radiation is likely to depend on many details. Here we assume a uniform radiation efficiency of of the accreted mass by a rotating BH (McKinney 2005). We also do not consider the beaming effect. Then the masses accreted by the BH during the prompt gamma-ray phase () and during the shallow decay phase () are estimated with . The average accretion rate thus can be estimated with , where is the accretion timescale in the rest frame. Considering the fall-back of total accreted particles as free-fall, the radius for the fall-back time can be estimated with
| (2) |
where cm, , and s. We assume in this work. The rotation rate of the fall-back material at radius is defined as a ratio of the local angular velocity to the local Keplerian velocity of the material at ,
| (3) |
Considering the viscosity among accreted particles before they reach the BH and combining with Eq. (2), one can obtain
| (4) |
where is the viscous parameter and is the viscous accretion timescale of the fall-back material. Please note that the timescale is different from as is the viscous accretion time of the fall-back material after it has circularized but is the accretion time for fall-back material within different layers of the progenitor star, which is given by the fall-back time without considering the viscosity among the particles. Assuming that the observed flux is proportional to the accretion rate and that the timescale of the decrease of mass fall-back rate from to is much larger than , the upper limit of can be obtained by (Kumar et al. (2008a, b)
| (5) |
A lower limit on is derived from the centrifugally supporting condition that the fall-back material is able to form an accretion disk at a radius , i.e., , where ( is the velocity of the light). For a convective envelope, the density profile at is , where is determined by the slope of the shallow decay segment, with . The sharp decline in the steep decay indicates that the density in the transition region decreases sharply. In this region, , so the accretion in this region can be ignored.
With the data of the bursts in our sample, we calculate the radii for stellar core , transient region , and envelope region , the limits of spin parameter , the index of the density profile , the accreted masses ( and ), and the average accretion rates ( and ) in the prompt gamma-ray and the shallow decay phases. They are tabulated in Table 3. We show the distributions of these parameters in Figure 4. We find that the derived radii of the core layers of the progenitor stars for all the bursts are cm with the rotation parameter as . The masses of the core layers for about two-thirds of GRBs in our sample are with a mass density of g cm-3, and their average accretion rates in the prompt gamma-ray phase are /s.
For the envelope layer, the estimated radii, lower limits on the rotation parameters, and the masses of the fall-back materials are cm, the lower limit for the rotation parameter , and , respectively. The average accretion rates in the shallow decay phase are much lower than that in the prompt gamma-ray phase, i.e., /s, but they are correlated. We measure the correlation with the Spearman correlation analysis, which yields with a correlation coefficient and a chance probability , as shown in Figure 5. The estimated mass density in the envelope is g cm-3.
5 Conclusions and Discussion
We have investigated the characteristics of the X-rays in the GRB rest frame, and inferred the properties of progenitor stars with a sample of 33 GRBs based on the model of Kumar et al. Assuming that the steep decay segment is due to the curvature effect, we fit the lightcurves with a broken power-law to derive the zero time of the last emission epoch of the prompt emission (), the beginning () and the end time () of the shallow decay segment. The is roughly consistent with , but it is not correlated with the time intervals of and . The and are correlated with and . This fact likely suggests that the energy budgets for the two phases may be from the same central engine.
Based on a model proposed by Kumar et al. (2008a, b), we inferred the properties of the progenitor star with both the prompt gamma-rays and the X-ray data. The derived radii of the core layers of the progenitor stars for all the bursts are cm with a rotation parameter as . The masses of the core layers for about two-thirds of GRBs in our sample are with a mass density of g cm-3, and their average accretion rates in the prompt gamma-ray phase are /s. The estimated radii, lower limits on the rotation parameters, and the masses of the fall-back materials for the envelope layers are cm, , and , respectively. The average accretion rates in the shallow decay phase are much lower than those in the prompt gamma-ray phase, i.e., /s, but they are correlated. The estimated mass density in the envelope is g cm-3.
The connection between long-duration GRBs and SNe was predicted theoretically (Colgate 1974; Woosley 1993) and has been verified observationally through detecting spectroscopic features of the underlying SNe in some nearby GRBs (Woosley & Bloom 2006). The collapsar model is the most promising scenario to explain the huge release of energy associated with long duration GRBs (Woosley & Weaver 1995; Paczyński 1998; MacFadyen & Woosley 1999; Zhang et al. 2003; Janiuk & Proga 2008). In this scenario GRBs are produced by a jet powered by accretion of the core and the fall-back materials of the progenitor star through a torus. We infer the properties of the progenitor stars by assuming that both the prompt gamma-rays and the X-rays observed with XRT are due to the accretion of different layers of progenitor stars. We compare the distribution of , the radius of envelope region, with the photospheric radii of a sample with 25 WC-type and 61 WN-type Wolf-Rayet (WR) stars (Koesterke & Hamann 1995, Li 2007) in Figure 6. We find that the photospheric radius of a WR star is larger than , consistent with our prediction.
In our calculation, we regard that all GRBs are from a unified collapsar with a central BH of . Our results thus might be compared with simulation results for a collapsar with a given mass. We compare the derived mass density profile as a function of radius with simulations in Figure 7, in which the simulated mass density profile is taken from Woosley & Weaver (1995) for a massive star with (see also Janiuk & Proga 2008). It is found that, although the derived are systematically larger than the results of simulations, they are very consistent with the simulations.
In the collapsar models, the accretion duration should be as long as the material fall-back timescale from the collapsar envelope available to fuel the accretion disk or torus. Rotation of the progenitor star should be high enough to form the disk or torus. One thus might expect a relation between the burst duration and the rotation parameter . For a progenitor star with higher rotation, the angular momentum loss should be longer, and the accretion timescale might be longer, hence a longer GRB event. We show the correlation between and in Figure 8. A tentative correlation is found, with a correlation coefficient of and a chance probability . This correlation indicates that the higher , the longer GRB could be observed, consistent with the model’s expectation.
It is believed that GRBs are highly collimated, with a beaming factor from the optical afterglow observations(Frail et al. 2001). The measurement of the beaming angle has also proven exceedingly difficult in the Swift era (Cenko et al. 2009). In our analysis, we do not considering the beaming effect. The lack of detection of jet-like breaks in the late XRT lightcurve might suggest that the X-ray jet would be less collimated than expected from the optical data (Burrows & Racusin 2006; Liang et al. 2008). In spite of this, the accretion rates and the accreted masses could be up to 2 orders of magnitude lower than those derived in this analysis if beaming is considered.
We appreciate valuable suggestions and comments from the anonymous referee. We also thank Bing Zhang, Li-Xin Li, Zhuo Li, and Tong Liu for helpful discussion.
References
- [] Bloom J. S. et al., 1999, Nature, 401, 453
- [] Bloom J. S. et al., 2002, ApJ, 572, L45
- [] Burrows, D. N. & Racusin, J. 2006, NCimB, 121, 1273
- [] Cenko, S. B., Frail, D. A., Harrison, F. A., et al. astro-ph/0905.0690
- [] Chen, W. X., & Beloborodov, A. M. 2007, ApJ, 657, 383
- [] Cobb B. E. et al., 2006, ApJ, 651, L85
- [] Colgate, S. A. 1974, ApJ, 187, 333
- [] Della Valle M. et al., 2003, A&A, 406, L33
- [] Di Matteo, T., Perna, R., & Narayan, R. 2002, ApJ, 579, 706
- [Fan & Piran 2006] Fan, Y., & Piran, T. 2006, MNRAS, 369, 197
- [] Fynbo J. P. U. et al., 2004, ApJ, 609, 962
- [\citeauthoryearFrail et al.2001] Frail D. A., et al., 2001, ApJ, 562, L55
- [] Galama T. J. et al., 1998, Nature, 395, 670
- [Genet et al. 2007] Genet, F., Daigne, F., & Mochkovitch, R. 2007, MNRAS, 381, 732
- [Ghisellini et al. 2007] Ghisellini, G., Ghirlanda, G., Nava, L., & Firmani, C. 2007, ApJ, 658, L75
- [] Ghisellini, G. 2008, AIPC, 1065, 137
- [] Gu, W. M., Liu, T., & Lu, J. F. 2006, ApJ, 643, L87
- [] Hjorth J. et al., 2003, Nature, 423, 847
- [] Ioka, K., Kobayashi, S., Zhang, B., et al. 2006, AIPC, 836, 301
- [] Janiuk, A., Yuan, Y.F., Perna, R., & Di Matteo, T. 2007, ApJ, 664, 1011
- [] Janiuk, A. & Proga, D. 2008, ApJ, 675, 519
- [] Kawanaka, N. & Mineshige, S. 2007, ApJ, 662, 1156
- [] Kohri K., & Mineshige S. 2002, ApJ, 577, 311
- [] Kohri K., Narayan, R., & Piran, T. 2005, ApJ, 629, 341
- [] Kulkarni S. R. et al., 1998, Nature, 395, 663
- [Kumar & Panaitescu 2000] Kumar, P., & Panaitescu, A. 2000, ApJ, 541, L51
- [] Kumar, P., Narayan, R. & Johnson, J. 2008a, Sci, 321, 376
- [] Kumar, P., Narayan, R. & Johnson, J. Sci, 2008b, MNRAS, 388, 1729
- [] Lee, W. H., Ramirez-Ruiz, E., & Page, D. 2005, ApJ, 632, 421
- [] Li, L. X., 2007, MNRAS, 375, 240
- [Liang et al. 2006] Liang, E. W., et al. 2006, ApJ, 646, 351
- [] Liang, E. W., Zhang, B. B., Zhang, B. 2007, ApJ, 670, 565
- [] Liang, E. W., Racusin, J. L., Zhang, B. et al. 2008, ApJ, 675, 528
- [] Liang, E. W., Lv, H. J., Zhang, B. B. & Zhang, B. 2009, submitted,(astro-ph/0902.3504)
- [] Liu, T., Gu, W. M., Xue, L., & Lu J. F. 2007, ApJ, 661, 1025
- [] MacFadyen A. I. & Woosley S. E., 1999, ApJ, 524, 262
- [] Malesani D. et al., 2004, ApJ, 609, L5
- [] McKinney, J. C. 2005, ApJ 630, L5
- [Mészáros 2006] Mészáros, P. 2006, Reports of Progress in Physics, 69, 2259
- [] Mirabal N., Halpern J. P., An D. et al., 2006, ApJ, 643, L21
- [] Modjaz M. et al., 2006, ApJ, 645, L21
- [] Narayan, R., Piran, T., & Kumar, P. 2001, ApJ, 557, 949
- [] Nava, L., Ghisellini, G., Ghirlanda, G., Cabrera, J. I., Firmani, C., & Avila-Reese, V. 2007, MNRAS, 377, 1464
- [] Nousek, J. A., et al. 2006, ApJ, 642, 389
- [O’Brien et al. 2006] O’Brien, P. T., et al. 2006b, ApJ, 647, 1213
- [] Paczyński B., 1998, ApJ, 494, L45
- [] Panaitescu, A. 2007, MNRAS, 380, 374
- [] Panaitescu, A. 2008, MNRAS, 383, 1143
- [] Pian E. et al., 2006, Nature, 442, 1011
- [] Piran, T. 2005, Reviews of Modern Physics, 76, 1143
- [] Popham, R., Woosley, S. E. & Fryer, C. 1999, ApJ. 518, 356
- [] Qin, Y. P., Zhang, Z. B., Zhang, F. W., et al. 2004, ApJ, 617, 439
- [] Qin, Y. P. 2008, ApJ, 683, 900
- [] Racusin, J. L., Liang, E. W., Burrows, D. N. et al. 2009, ApJ, 698, 43
- [Shao & Dai(2007)] Shao, L., & Dai, Z. G. 2007, ApJ, 660, 1319
- [] Shen R. -F., Kumar P., Robinson E. L., 2006, MNRAS, 371, 1441
- [\citeauthoryearShen et al.2009] Shen R.-F., Willingale R., Kumar P., O’Brien P. T., Evans P. A., 2009, MNRAS, 393, 598
- [] Stanek K. Z. et al., 2003, ApJ, 591, L17
- [Troja et al. 2007] Troja, E., et al. 2007, ApJ, 665, 599
- [Uhm & Beloborodov 2007] Uhm, Z. L., & Beloborodov, A. M. 2007, ApJ, 665L, 93
- [Willingale et al.(2007)] Willingale, R., et al. 2007, ApJ, 662, 1093
- [] Woosley S. E., 1993, ApJ, 405, 273
- [] Woosley S. E. & Weaver, T. A. 1995, pJS, 101, 181
- [] Woosley S. E. & Bloom, J. S. 2006, ARA&A, 44, 507
- [] Yamazaki, R., 2009, ApJ, 690, L118
- [] Zeh, A., Klose, S. & Hartmann, D. H. 2004, ApJ, 609, 952
- [] Zhang B., Kobayashi S., Mészáros P., 2003, ApJ, 595, 950
- [Zhang & Mészáros 2004] Zhang, B., & Mészáros, P. 2004, International Journal of Modern Physics A, 19, 2385
- [Zhang et al. (2006)] Zhang, B., Fan, Y. Z., Dyks, J., et al. 2006, ApJ, 642, 354
- [Zhang et al. (2007a)] Zhang, B., Liang, E. W., Page, K., Grupe, D., et al. 2007a, ApJ, 655, 989
- [] Zhang, B. 2007, ChJAA, 7, 329
- [Zhang et al. (2007c)] Zhang, B. B., Liang, E. W., & Zhang, B. 2007b, ApJ, 666, 1002
- [] Zhang, B. B., Zhang, B.; Liang, E. W., Wang, X. Y. 2009, ApJ, 690, 10
| GRB | 333The X-ray fluence integrated from to and its error in the XRT band (0.3-10 keV) | 444The time-averaged photon index of the steep decay phase | 555The zero time of the emission epoch corresponding to the steep decay segment | 666 and are the begin and the end times of the shallow decay segment | 777The slopes of the shallow decay segment | ||||
| ( erg ) | (ks) | ( erg) | (erg/s) | ||||||
| 050416A | 0.62 0.38 | 2.15 | 1.74 | 0.70 | 0.7 0.4 | 3.7 | |||
| 050803 | 5.96 0.51 | 1.88 | 104 5 | 263 11 | 13.71 | 0.36 | 2.6 0.2 | 0.8 | |
| 050908 | 0.13 0.11 | 3.90 | 120 50 | 684 82 | 8.00 | 1.01 | 2.9 2.4 | 1.4 | |
| 051016B | 2.18 1.10 | 2.82 | 50 5 | 157 12 | 6.64 | 0.14 | 4.9 2.5 | 0.6 | |
| 051109A | 3.46 0.75 | 2.33 | 62 23 | 173 33 | 7.30 | 0.42 | 42.9 9.3 | 109.3 | |
| 060108 | 0.53 0.17 | 1.91 | 40 30 | 186 31 | 22.08 | 0.39 | 5.1 1.6 | 5.4 | |
| 060210 | 4.86 0.69 | 1.93 | 298 8 | 452 11 | 7.00 | 0.80 | 141.0 20.0 | 721.2 | |
| 060418 | 1.38 0.66 | 2.04 | 81 2 | 309 4 | 1.00 | 7.6 3.6 | 51.6 | ||
| 060502A | 5.09 1.19 | 2.43 | 12 6 | 190 13 | 72.57 | 0.59 | 28.6 6.7 | 16.9 | |
| 060510B | 0.28 0.27 | 1.42 | 310 2 | 170.00 | 11.4 10.9 | 0.7 | |||
| 060522 | 0.12 0.20 | 1.97 | 117 15 | 248 16 | 0.73 | 5.2 8.6 | 114.7 | ||
| 060526 | 0.46 0.26 | 1.80 | 266 1 | 1023 18 | 10.00 | 9.6 5.4 | 9.2 | ||
| 060605 | 0.82 0.52 | 1.60 | 59 74 | 455 42 | 7.00 | 22.8 14.5 | 29.3 | ||
| 060607A | 8.45 0.17 | 1.79 | 214 12 | 384 10 | 12.34 | 0.44 | 166.0 3.3 | 408.0 | |
| 060707 | 0.55 0.26 | 2.00 | 56 22 | 505 76 | 10.00 | 0.39 | 12.8 6.0 | 12.5 | |
| 060708 | 0.96 1.06 | 2.51 | 20 2 | 231 19 | 6.66 | 0.39 | 11.5 12.7 | 16.8 | |
| 060714 | 1.48 0.46 | 2.02 | 145 4 | 311 15 | 3.70 | 0.02 | 23.5 7.3 | 33.1 | |
| 060729 | 19.58 0.83 | 2.71 | 120 2 | 425 8 | 72.97 | 0.27 | 14.3 0.6 | 1.0 | |
| 060814 | 6.93 0.87 | 1.84 | 81 13 | 967 74 | 17.45 | 0.15 | 12.5 1.6 | 1.4 | |
| 060906 | 0.96 0.29 | 2.44 | 85 26 | 222 21 | 13.66 | 0.33 | 25.2 7.6 | 20.7 | |
| 061121 | 19.89 6.14 | 1.62 | 103 2 | 176 3 | 2.43 | 0.25 | 85.4 26.4 | 60.5 | |
| 070110 | 3.59 0.23 | 2.11 | 61 3 | 522 19 | 20.40 | 0.17 | 44.7 2.9 | 17.2 | |
| 070306 | 2.53 0.94 | 2.29 | 110 2 | 542 8 | 15.00 | 14.0 5.2 | 4.6 | ||
| 070318 | 0.79 1.45 | 1.40 | 86 12 | 809 47 | 2.00 | 1.4 2.6 | 3.2 | ||
| 070721B | 1.80 1.38 | 1.48 | 289 9 | 450 28 | 7.50 | 0.62 | 46.2 35.4 | 192.2 | |
| 071021 | 0.24 0.39 | 2.12 | 175 3 | 558 74 | 20.00 | 0.37 | 10.1 16.6 | 15.6 | |
| 080310 | 1.19 0.53 | 1.45 | 504 1 | 20.00 | 0.33 | 15.7 7.0 | 9.1 | ||
| 080430 | 0.82 0.23 | 2.42 | 0 5 | 165 12 | 8.80 | 0.52 | 1.2 0.3 | 2.2 | |
| 080607 | 2.85 0.81 | 1.81 | 100 2 | 238 7 | 1.50 | 1.03 | 54.7 15.5 | 954.8 | |
| 080707 | 0.24 0.13 | 2.10 | 34 8 | 192 28 | 7.60 | 0.16 | 0.9 0.5 | 8.4 | |
| 080905B | 3.50 2.34 | 1.49 | 62 5 | 179 7 | 6.50 | 44.4 29.7 | 104.4 | ||
| 081007 | 0.96 0.31 | 3.00 | 188 5 | 40.00 | 0.69 | 0.7 0.2 | 1.4 | ||
| 081008 | 1.59 0.52 | 1.91 | 232 3 | 484 15 | 20.00 | 0.73 | 14.5 4.7 | 35.0 |
| 0.55(8.1E-4)888In the bracket is the chance probability. | 0.58(2.9E-4) | 0.08(0.63) | 0.27(0.13) | 0.46(6.3E-3) | |
| 0.40(0.02) | 0.08(0.66) | -0.30(0.08) | 0.74(1E-4) | 0.66(1E-4) | |
| 0.51(2.2E-3) | 0.33(0.06) | -0.18(0.31) | 0.68(1E-4) | 0.72(1E-4) |
| GRB | 999Radii of the core, transit and envelope region of the progenitor stars. | 101010The range of the rotational parameter of the core layer, . | 111111The lower limit on the rotational parameter of the envelope layer. | 121212The density profile in the stellar envelope: . | 131313The fall-back mass during the prompt phase. | 141414The fall-back mass during the shallow decay phase. | |||
| 0.1 | |||||||||
| 050416A | 9.14 | 0.98 | 0.72 | [0.21 0.02] | 7.85 | 2.56 | 0.02 | 0.04 0.02 | |
| 050803 | 2.151.57 | 2.260.27 | 3.16 | [0.34 0.02] | 3.75 | 2.04 | 0.09 0.01 | 0.14 0.01 | |
| 050908 | 6.343.53 | 2.030.49 | 1.05 | [0.19 0.03] | 6.52 | 3.02 | 0.61 0.06 | 0.16 0.13 | |
| 051016B | 6.051.30 | 1.300.23 | 7.34 | [0.29 0.03] | 2.46 | 1.71 | 0.02 0.01 | 0.27 0.14 | |
| 051109A | 4.862.50 | 0.970.32 | 1.17 | [0.33 0.03] | 6.16 | 2.13 | 0.18 0.03 | 2.38 0.51 | |
| 060108 | 3.873.23 | 1.080.33 | 2.62 | [0.34 0.03] | 4.12 | 2.09 | 0.20 0.02 | 0.28 0.09 | |
| 060210 | 10.740.93 | 1.420.12 | 0.88 | [0.30 0.02] | 7.10 | 2.70 | 12.29 0.66 | 7.81 1.11 | |
| 060418 | 7.090.50 | 1.730.10 | 0.38 | [0.33 0.03] | 10.83 | 1.50 | 2.53 0.08 | 0.42 0.20 | |
| 060502A | 2.011.29 | 1.250.21 | 6.56 | [0.24 0.05] | 2.60 | 2.39 | 0.69 0.03 | 1.59 0.37 | |
| 060510B | 9.760.32 | 4.64 | 6.54 | [0.38 0.02] | 2.61 | 1.50 | 9.27 0.40 | 0.63 0.60 | |
| 060522 | 4.981.28 | 0.820.13 | 0.17 | [0.33 0.03] | 16.26 | 1.50 | 2.77 0.27 | 0.29 0.47 | |
| 060526 | 11.040.30 | 2.710.18 | 1.24 | [0.35 0.02] | 5.99 | 1.50 | 1.47 0.19 | 0.53 0.30 | |
| 060605 | 3.704.30 | 1.450.30 | 0.90 | [0.36 0.03] | 7.05 | 1.50 | 1.07 0.14 | 1.26 0.80 | |
| 060607A | 9.761.46 | 1.440.13 | 1.46 | [0.34 0.02] | 5.53 | 2.15 | 2.84 0.11 | 9.23 0.19 | |
| 060707 | 3.762.02 | 1.640.46 | 1.20 | [0.31 0.03] | 6.09 | 2.09 | 2.08 0.20 | 0.71 0.33 | |
| 060708 | 2.330.57 | 1.180.23 | 1.11 | [0.24 0.04] | 6.32 | 2.09 | 0.33 0.03 | 0.64 0.71 | |
| 060714 | 8.010.76 | 1.330.18 | 0.69 | [0.33 0.02] | 8.00 | 1.53 | 2.65 0.18 | 1.31 0.41 | |
| 060729 | 12.710.91 | 2.950.20 | 9.12 | [0.29 0.02] | 2.21 | 1.91 | 0.11 0.01 | 0.79 0.03 | |
| 060814 | 8.682.55 | 4.530.82 | 3.12 | [0.32 0.02] | 3.78 | 1.72 | 1.50 0.02 | 0.69 0.09 | |
| 060906 | 4.802.21 | 0.910.19 | 1.42 | [0.31 0.03] | 5.59 | 1.99 | 3.22 0.20 | 1.40 0.42 | |
| 061121 | 8.770.61 | 1.250.09 | 3.34 | [0.33 0.02] | 3.65 | 1.88 | 3.27 0.05 | 4.75 1.47 | |
| 070110 | 4.820.58 | 2.020.22 | 2.32 | [0.30 0.03] | 4.38 | 1.75 | 1.11 0.07 | 2.48 0.16 | |
| 070306 | 8.670.54 | 2.510.15 | 2.30 | [0.31 0.02] | 4.40 | 1.50 | 1.65 0.09 | 0.78 0.29 | |
| 070318 | 9.032.41 | 4.030.61 | 0.74 | [0.39 0.02] | 7.77 | 1.50 | 0.25 0.01 | 0.08 0.01 | |
| 070721B | 10.951.08 | 1.470.23 | 0.96 | [0.32 0.02] | 6.80 | 2.43 | 5.13 0.28 | 2.57 1.96 | |
| 071021 | 6.610.42 | 1.430.37 | 1.55 | [0.33 0.03] | 5.35 | 2.06 | 3.05 0.47 | 0.56 0.09 | |
| 080310 | 19.390.39 | 3.67 | 2.26 | [0.37 0.02] | 4.44 | 2.00 | 1.68 0.15 | 0.87 0.39 | |
| 080430 | 0.251.45 | 1.430.25 | 2.03 | [0.11 0.03] | 4.68 | 2.28 | 0.10 0.01 | 0.07 0.02 | |
| 080607 | 5.920.38 | 1.050.10 | 0.36 | [0.34 0.03] | 11.12 | 3.05 | 25.60 | 3.04 0.86 | |
| 080707 | 4.271.60 | 1.360.37 | 1.58 | [0.32 0.03] | 5.31 | 1.74 | 0.11 0.01 | 0.05 0.03 | |
| 080905B | 4.840.96 | 0.980.11 | 0.78 | [0.37 0.03] | 7.55 | 1.50 | 1.27 0.14 | 2.47 1.65 | |
| 081007 | 5.61 | 1.720.15 | 2.43 | [0.25 0.03] | 4.27 | 2.54 | 0.03 0.01 | 0.04 0.01 | |
| 081008 | 12.740.70 | 2.080.21 | 1.56 | [0.33 0.02] | 5.33 | 2.60 | 2.18 0.10 | 0.81 0.26 |
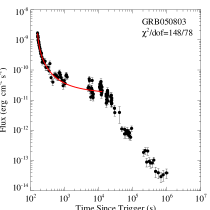
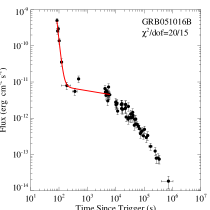
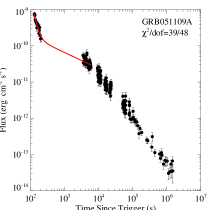
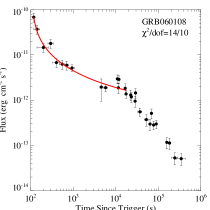
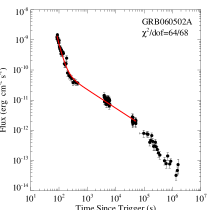
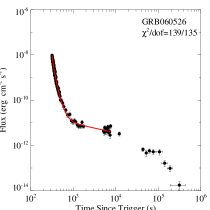
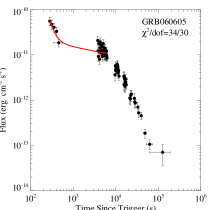

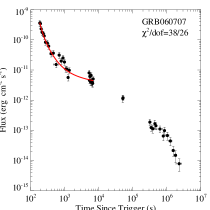
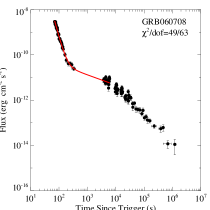
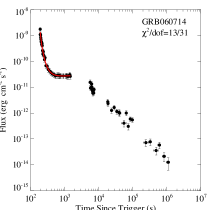
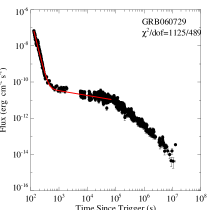
Fig.1 (continued)
![[Uncaptioned image]](/html/0909.5247/assets/x13.png)
![[Uncaptioned image]](/html/0909.5247/assets/x14.png)
![[Uncaptioned image]](/html/0909.5247/assets/x15.png)
![[Uncaptioned image]](/html/0909.5247/assets/x16.png)
![[Uncaptioned image]](/html/0909.5247/assets/x17.png)
![[Uncaptioned image]](/html/0909.5247/assets/x18.png)
![[Uncaptioned image]](/html/0909.5247/assets/x19.png)
![[Uncaptioned image]](/html/0909.5247/assets/x20.png)
![[Uncaptioned image]](/html/0909.5247/assets/x21.png)
![[Uncaptioned image]](/html/0909.5247/assets/x22.png)
![[Uncaptioned image]](/html/0909.5247/assets/x23.png)
![[Uncaptioned image]](/html/0909.5247/assets/x24.png)
Fig.1 (continued)