The Lick AGN Monitoring Project: Photometric Light Curves and Optical Variability Characteristics
Abstract
The Lick AGN Monitoring Project targeted 13 nearby Seyfert 1 galaxies with the intent of measuring the masses of their central black holes using reverberation mapping. The sample includes 12 galaxies selected to have black holes with masses roughly in the range – M⊙, as well as the well-studied AGN NGC 5548. In conjunction with a spectroscopic monitoring campaign, we obtained broad-band and images on most nights from 2008 February through 2008 May. The imaging observations were carried out by four telescopes: the 0.76-m Katzman Automatic Imaging Telescope (KAIT), the 2-m Multicolor Active Galactic Nuclei Monitoring (MAGNUM) telescope, the Palomar 60-in (1.5-m) telescope, and the 0.80-m Tenagra II telescope. Having well-sampled light curves over the course of a few months is useful for obtaining the broad-line reverberation lag and black hole mass, and also allows us to examine the characteristics of the continuum variability. In this paper, we discuss the observational methods and the photometric measurements, and present the AGN continuum light curves. We measure various variability characteristics of each of the light curves. We do not detect any evidence for a time lag between the - and -band variations, and we do not find significant color variations for the AGNs in our sample.
Subject headings:
galaxies: active – galaxies: nuclei – galaxies: Seyfert1. Introduction
The variability of active galactic nuclei (AGNs) has been studied extensively across a wide range of wavelengths extending from radio to X-rays. Many studies have focused on establishing simple relationships between variability and various physical parameters. Variability amplitude has been found to correlate with redshift (e.g., Cristiani, Vio, & Andreani, 1990; Hook et al., 1994; Trevese et al., 1994; Vanden Berk et al., 2004) and black hole mass on longer timescales of ¿100 days (Wold et al., 2007; Wilhite et al., 2008; Bauer et al., 2009), and anticorrelations have been seen with luminosity (e.g., Cristiani et al., 1997; Giveon et al., 1999; Vanden Berk et al., 2004; Bauer et al., 2009), Eddington ratio (Wilhite et al., 2008; Bauer et al., 2009), and rest-frame wavelength (e.g., Cutri et al., 1985; di Clemente et al., 1996; Giveon et al., 1999; Vanden Berk et al., 2004).
A number of models have been developed in order to explain the physical mechanisms driving the variability. Processes that are external to the accretion disk have been discussed, such as variability due to multiple supernovae or starbursts which occur close to the nucleus (Terlevich et al., 1992; Aretxaga & Terlevich, 1994), stellar collisions (Torricelli-Ciamponi et al., 2000), or gravitational microlensing by small compact objects along the line of sight (Hawkins, 1993). Recently, several studies have shown that optical variations on long timescales (i.e., ¿ 100 days) are probably the result of changes in the accretion rate (Wold et al., 2007; Li & Cao, 2008; Arevalo et al., 2008; Wilhite et al., 2008). However, fluctuations in the accretion rate cannot account for the optical variations seen on short timescales, of order days. In order to describe optical variations on short timescales, some have suggested that X-ray reprocessing plays a role. In this scenario, the X-ray continuum heats the accretion disk and changes in this X-ray continuum cause optical continuum variability (e.g., Krolik et al. 1991; Sergeev et al. 2005; Cackett, Horne, & Winkler 2007; Arevalo et al. 2008).
Despite large observational and theoretical efforts to study variability, the physical mechanisms behind AGN variability are still poorly understood. However, studying AGN variability can provide constraints on the sizes of different regions associated with the central engine. Variability has been used very successfully in determining the sizes of the broad-line region (BLR), and consequently the mass of black holes in nearby Type 1 AGNs, through the technique known as reverberation mapping (Blandford & McKee, 1982; Peterson, 1993). The method uses the time delay between variations in the AGN continuum and the subsequent response of the broad emission lines to measure the size of the BLR. By combining the BLR size with the velocity width of an emission line, typically the broad H line, the black hole mass can be determined using a simple viral equation.
The results from reverberation mapping have led to mass measurements of about three dozen black holes at the centers of nearby active galaxies (Peterson et al. 2004, 2005), as well as the discovery of a correlation between the BLR size and the AGN continuum luminosity (the relation; Koratkar & Gaskell 1991; Kaspi et al. 2000, 2005; Bentz et al. 2006, 2009a). The relationship, however, is poorly constrained at the low-luminosity end, for continuum luminosities Å erg s-1. Additionally, the low-mass end of the relationship between AGN black hole mass and bulge stellar velocity dispersion () is even more poorly determined since most of the AGNs making up the relationship contain black holes with masses between and M⊙ (Onken et al., 2004).
In order to increase the number of reverberation measurements at the low ends of the AGN luminosity and mass regimes, we began the Lick AGN Monitoring Project, a reverberation-mapping campaign that targeted 12 nearby Seyfert 1 galaxies containing black holes with expected masses between and M⊙, and also the well-studied AGN NGC 5548 with a black hole mass of M⊙ (Bentz et al., 2007). The project consisted of a mostly contiguous 64-night spectroscopic monitoring campaign at the Lick Observatory 3-m Shane telescope, along with simultaneous nightly and imaging carried out at four smaller telescopes. Most previous reverberation campaigns measured the AGN continuum variations directly from the spectra. However, for our sample of relatively low-luminosity AGNs, measuring the continuum flux from broad-band images is more accurate, as we are able to obtain a better calibration and a higher signal-to-noise ratio using images rather than spectra.
Having regularly sampled light curves with a daily cadence over the course of a few months is useful for determining broad-line reverberation time lags and black hole masses, and also allows us to examine optical continuum variability characteristics. In this paper, we present the results from the imaging campaign. We discuss the sample selection, describe the broad-band observations, and provide details of the aperture photometry. We present the - and -band continuum light curves for the 13 objects, cross-correlate them to search for time delays between the two bands, and attempt to investigate the color for the AGNs. In companion papers, these AGN continuum light curves are compared to the light curves of H (Bentz et al., 2009b, hereafter Paper III) and other optical recombination lines (Bentz et al., 2009c) to measure BLR sizes and black hole masses. The first results from the reverberation mapping project on the object Arp 151 were previously presented (Bentz et al., 2008, hereafter Paper I).
2. Sample Selection
The main goal of the Lick AGN Monitoring Project is to substantially increase the number of reverberation-based black hole masses at the low end of the AGN mass and luminosity range. We selected a sample of 12 nearby () Seyfert 1 galaxies with a single-epoch mass estimate of M⊙ based on the broad H line width. The objects were selected from Greene & Ho (2007) and from our own library of AGN spectra obtained at the Palomar, Lick, and Keck observatories. The estimated time lag based on the 5100 Å continuum luminosity for these AGNs is 3–20 days, which allowed for a monitoring campaign of manageable length, extending over a few months with a nightly cadence. The objects were also required to have a strong, broad H emission line suitable for spectroscopic monitoring. In addition to these 12 objects, NGC 5548, which is among the best-studied reverberation objects and known to be highly variable with a well-determined black hole mass (Bentz et al., 2007, and references therein), was also included in our sample as a control object. By adding NGC 5548 to our sample, we are able to expand the existing set of data on NGC 5548 as well as more reliably compare our new results to those from previous reverberation-mapping campaigns. Properties of all 13 AGNs in the sample are given in Table 1.
| Object | (J2000.0) | (J2000.0) | Alternate | ||
|---|---|---|---|---|---|
| (mag) | Name | ||||
| Mrk 142 | 10 25 31.3 | +51 40 35 | 0.04494 | 0.069 | PG 1022+519 |
| SBS 1116+583A | 11 18 57.7 | +58 03 24 | 0.02787 | 0.050 | |
| Arp 151 | 11 25 36.2 | +54 22 57 | 0.02109 | 0.059 | Mrk 40 |
| Mrk 1310 | 12 01 14.3 | -03 40 41 | 0.01941 | 0.133 | |
| Mrk 202 | 12 17 55.0 | +58 39 35 | 0.02102 | 0.087 | |
| NGC 4253 | 12 18 26.5 | +29 48 46 | 0.01293 | 0.084 | Mrk 766 |
| NGC 4748 | 12 52 12.4 | -13 24 53 | 0.01463 | 0.223 | |
| IC 4218 | 13 17 03.4 | -02 15 41 | 0.01933 | 0.132 | |
| MCG-06-30-15 | 13 35 53.8 | -34 17 44 | 0.00775 | 0.266 | ESO 383-G035 |
| NGC 5548 | 14 17 59.5 | +25 08 12 | 0.01718 | 0.088 | |
| Mrk 290 | 15 35 52.3 | +57 54 09 | 0.02958 | 0.065 | PG 1534+580 |
| IC 1198 | 16 08 36.4 | +12 19 51 | 0.03366 | 0.236 | Mrk 871 |
| NGC 6814 | 19 42 40.6 | -10 19 25 | 0.00521 | 0.790 |
Note. — Units of right ascension are hours, minutes, seconds, and units of declination are degrees, arcminutes, arcseconds. Redshifts come the NASA Extragalactic Database (NED). The Galactic extinction, , is given by Schlegel et al. (1998).
3. Observations
Broad-band Johnson and images were obtained about twice a week from 2008 February 9 to 2008 March 15, and then on most nights between 2008 March 16 and 2008 June 1 (UT dates are used throughout this paper). We began the photometric monitoring prior to the onset of the spectroscopic campaign (which began on 2008 March 25) since the response of the broad-line emission is delayed relative to the variations in the continuum flux. In Table 2, we give typical exposure times and statistical properties of the light curves for each object. The sample was divided between four telescopes, such that each site was primarily responsible for observing a subset of the objects. In Table 3, we list the properties of the four telescopes: the Katzman Automatic Imaging Telescope (KAIT), the Multicolor Active Galactic Nuclei Monitoring (MAGNUM) telescope, the Palomar 60-in telescope (P60), and the Tenagra II telescope. Additionally, standard stars for the flux calibration of several light curves were observed at the Faulkes Telescope North (FTN) on three photometric nights between 2008 June 25 and 2008 July 1.
| Band | Band | ||||||||||
|---|---|---|---|---|---|---|---|---|---|---|---|
| Object | Exposure Time | UT Start | UT End | Exposure Time | UT Start | UT End | |||||
| (s) | (days) | (s) | (days) | ||||||||
| (1) | (2) | (3) | (4) | (5) | (6) | (7) | (8) | (9) | (10) | (11) | |
| Mrk 142 | 2300 | 80 | 0.98 | 2008-02-10 | 2008-06-01 | 2300 | 76 | 0.98 | 2008-02-10 | 2008-05-24 | |
| SBS 1116+583A | 2300 | 56 | 1.02 | 2008-02-09 | 2008-06-01 | 2200 | 56 | 1.01 | 2008-02-09 | 2008-05-24 | |
| Arp 151 | 2300 | 84 | 0.93 | 2008-02-10 | 2008-05-16 | 2300 | 78 | 0.96 | 2008-02-10 | 2008-05-16 | |
| Mrk 1310 | 4130 | 50 | 1.16 | 2008-02-20 | 2008-05-30 | 4130 | 58 | 1.05 | 2008-02-20 | 2008-05-30 | |
| Mrk 202 | 450 | 58 | 1.01 | 2008-02-09 | 2008-06-01 | 200 | 58 | 1.01 | 2008-02-09 | 2008-05-24 | |
| NGC 4253 | 2300 | 58 | 1.00 | 2008-02-13 | 2008-05-16 | 2300 | 63 | 0.97 | 2008-02-13 | 2008-05-16 | |
| NGC 4748 | 2120 | 48 | 1.12 | 2008-02-09 | 2008-06-02 | 290 | 52 | 1.03 | 2008-02-09 | 2008-06-01 | |
| IC 4218 | 2120 | 42 | 1.03 | 2008-02-09 | 2008-06-01 | 2120 | 56 | 1.09 | 2008-02-09 | 2008-06-01 | |
| MCG-06-30-15 | 445 | 48 | 1.08 | 2008-02-20 | 2008-05-30 | 430 | 55 | 1.04 | 2008-02-20 | 2008-05-30 | |
| NGC 5548 | 650 | 45 | 1.08 | 2008-02-12 | 2008-05-29 | 635 | 57 | 1.05 | 2008-02-12 | 2008-05-30 | |
| Mrk 290 | 300 | 50 | 1.01 | 2008-02-09 | 2008-06-01 | 150 | 50 | 1.01 | 2008-02-09 | 2008-05-23 | |
| IC 1198 | 2300 | 61 | 1.02 | 2008-02-13 | 2008-06-01 | 2300 | 66 | 1.02 | 2008-02-13 | 2008-05-23 | |
| NGC 6814 | 445 | 43 | 1.04 | 2008-03-20 | 2008-05-31 | 430 | 46 | 1.02 | 2008-03-20 | 2008-05-31 | |
Note. — Columns 2 and 7 list the typical exposure times for each object. Columns 3 and 8 give the number of observations, and columns 4 and 9 give the median sampling rate. UT dates are given in the format YYYY-MM-DD.
| Telescope | Mirror Diameter | Field of View | Pixel Scale | Galaxies Observed |
|---|---|---|---|---|
| (″pixel-1) | ||||
| KAIT | 0.8 m | 68 68 | 0.80 | SBS A, Mrk 202, Mrk 290 |
| MAGNUM | 2 m | 15 15 | 0.28 | Mrk 1310, MCG-06-30-15, NGC 5548, NGC 6814 |
| P60 | 1.5 m | 129 129 | 0.38 | NGC 4748, IC 4218 |
| Tenagra | 0.8 m | 15′ 15′ | 0.87 | Mrk 142, Arp 151, NGC 4253, IC 1198 |
3.1. KAIT
KAIT is a 0.76-m robotic telescope (Filippenko et al., 2001) located at Lick Observatory. The images were taken with a pixel SITe CCD. The pixel scale is 080 pixel-1, providing a field of view of 68 68. During a portion of the campaign, from 2008 April 12 to 2008 April 25, a similar camera was used in place of the primary camera due to technical problems.
For the duration of the campaign, KAIT observed three AGNs: SBS A, Mrk 202, and Mrk 290. When possible, KAIT also observed NGC 4748, IC 4218, and IC 1198, each for s in the band, as a backup to the P60 and Tenagra telescopes to help ensure that the AGNs were monitored with a nightly cadence. During the last week of the campaign, from 2008 May 27 to 2008 June 1, the P60 and Tenagra telescopes were unable to observe their assigned objects due to scheduling conflicts at Palomar and technical problems at Tenagra. Consequently, during this time, KAIT observed Mrk 142, NGC 4748, IC 4218, and IC 1198 on a nightly basis in the band only, each for s. Observations of SBS 1116, Mrk 202, and Mrk 290 were also limited to the band during this period.
3.2. MAGNUM
MAGNUM is a 2-m telescope (Kobayashi et al., 1998b; Yoshii, 2002) located at Haleakala Observatory on Maui. The observations were made using the multicolor imaging photometer (MIP; Kobayashi et al., 1998a), which provides simultaneous optical and near-infrared images. The optical detector is a pixel SITe CCD with a scale of 028 pixel-1 and a field of view of 15 15.
MAGNUM monitored four targets for the duration of the campaign: Mrk 1310, MCG-06-30-15, NGC 5548, and NGC 6814. Infrared images were also simultaneously obtained for all four AGNs, and the data will be described in a future paper. Despite MAGNUM’s small field of view, comparison stars for Mrk 1310, MCG-06-30-15, and NGC 6814 were simultaneously observed along with the target AGN. However, the comparison stars for NGC 5548 did not fall within the field of view, and were instead observed with an alternating pattern as described by Suganuma et al. (2006). The comparison stars for NGC 5548 were calibrated using photometric observations of Landolt (1992) standard stars (see Suganuma et al. 2006). The flux-calibrated comparison stars for NGC 5548 were then used to calibrate the comparison stars for the remaining three objects.
3.3. P60
The Palomar 60-in (1.5-m) telescope (P60; Cenko et al., 2006) is equipped with a SITe pixel CCD, with a pixel scale of 038 pixel-1 and a 129 129 field of view. Over the course of the campaign, the P60 observed two objects: NGC 4748 and IC 4218. Photometric observations of the comparison stars for NGC 4748 and IC 4218 were obtained by MAGNUM at the conclusion of the campaign, and their fluxes were calibrated using the Landolt (1992) standard star SA-105 815.
3.4. Tenagra
The 0.80-m Tenagra II telescope is located at the Tenagra Observatories complex in southern Arizona. The science camera contains a SITe pixel CCD, with a scale of 0 87 pixel-1, yielding a field of view of 15′ 15′.
Throughout the campaign, Tenagra monitored four AGNs: Mrk 142, Arp 151, NGC 4253, and IC 1198. Often, multiple epochs of data were obtained each night. Landolt (1992) SA-101 and SA-109 standard-star fields were observed a total of 16 times at a range of airmasses in each band on one photometric night, and these observations were used to flux calibrate the light curves for the four AGNs.
3.5. FTN
The Faulkes Telescope North is a 2-m telescope located at Haleakala Observatory. The science camera has a field of view of 5′ 5′ with a pixel scale of 028 pixel-1. Since KAIT did not observe standard stars for this program, after the completion of the campaign FTN was used to observe Landolt (1992) fields on photometric nights for the flux calibration of the SBS 1116, Mrk 202, and Mrk 290 light curves. The Landolt (1992) standard areas PG1323-086 and SA-107 were each observed twice for the flux calibration of Mrk 290. On a separate night, FTN observed the Landolt (1992) standard area SA-104 four times at a range of airmasses for the flux calibration of Mrk 202. Finally, on a third night, SA-104 was observed twice for the flux calibration of SBS 1116.
4. Data Reduction and Photometry
The images were reduced using the automatic pipelines from each of the telescopes. The pipelines incorporated standard data-reduction methods, such as overscan and bias subtraction, and flat fielding. The P60 CCD is read out using two amplifiers; thus, an additional data-reduction step, which combines the separate image extensions produced by the two amplifiers into a single image, was performed after the overscan subtraction. The P60 reduction pipeline also included sky subtraction. As a final step, cosmic rays were removed from the KAIT, Tenagra, and P60 images using the LA-COSMIC task (van Dokkum, 2001), and from the MAGNUM images by a manual procedure.
4.1. KAIT, P60, and Tenagra Photometry
For each of the individual images, the flux of the AGN and the background were measured through a circular aperture and a surrounding annulus using the IRAF task phot within the daophot package. The AGN flux was then compared to stars within the field. We checked the consistency of the comparison stars by plotting each star’s magnitude as a function of time. Any stars that appeared to fluctuate were not included as comparison stars. For the AGNs observed with KAIT and P60, the AGN magnitude was determined by averaging over the multiple exposures taken during a single night. Tenagra often obtained several individual observations of an AGN throughout the course of a night, and in these instances, the average AGN magnitude was calculated for exposures separated by less than one hour.
While there exists an optimal photometric aperture size that maximizes the signal-to-noise ratio for point sources (Howell, 1989), for extended sources the choice of aperture size is less clear. Fluctuations in the seeing affect the extended host galaxy less than they affect a point source, which can introduce spurious variability in the AGN flux. Therefore, the aperture needs to be large enough to minimize the effect of variations in the seeing, but also small enough so that excessive amounts of noise from the sky background and host-galaxy light are not added to the measurements.
In order to determine the ideal aperture size, we experimented with a range of sizes for each of the objects, while keeping the same sky annulus. We used apertures and sky annuli whose radii were an integer number of pixels. We ultimately chose a single aperture size for each set of AGNs observed with the same telescope. The best aperture size was determined by selecting a representative AGN for each telescope, cross-correlating the -band photometric light curve and the H emission-line light curve (see Paper III), and calculating the time lag. The aperture size which resulted in the smallest formal error on the time lag was selected as the best choice. The final apertures had radii of 320 for the three AGNs observed with KAIT, 265 for the two AGNs observed with P60, and 435 for the four AGNs observed with Tenagra.
When P60 or Tenagra were unable to observe their assigned targets due to weather conditions, technical problems, or scheduling conflicts, we were sometimes able to obtain the observations with KAIT. We used the same comparison stars and the same photometric aperture size as was used for the images from the primary telescope, but the flux measured using the KAIT images appeared to be systematically lower than the flux measured using the P60 images. This offset is most likely the result of different filter transmission curves between the two telescopes, since the transmission curves for the broad-band filters used by P60 are known to deviate significantly from standard Johnson transmission curves (Cenko et al., 2006). In order to correct the issue, we compared the flux measured with a set of KAIT and P60 images taken on the same night. In total, there were 18 nights when both KAIT and P60 observed NGC 4748 in the band and one night when both telescopes observed NGC 4748 in the band. Similarly, KAIT and P60 simultaneously observed IC 4218 a total of 17 nights in the band and three nights in the band. We determined the average offset for the set of pairs of points and found that for NGC 4748, mag in the band and 0.007 mag in the band. For IC 4218, we found that mag in the band and 0.14 mag in the band. We adjusted the KAIT measurements accordingly. We applied a similar comparison between a set of observations taken with KAIT and Tenagra, but did not find evidence for a significant offset; hence, no adjustments were made to the KAIT measurements before combining them with the Tenagra measurements.
Finally, the - and -band light curves were flux calibrated. We first determined the fluxes of the comparison stars using Landolt (1992) standard stars, as described in §3, and fit the constant, color, and extinction terms of the transformation equation over the data sets where both the comparison stars and the Landolt (1992) standard stars were observed in the same night. We determined the offset between the instrumental magnitude and the calibrated magnitude for each one of the comparison stars and then applied the average offset to the AGN light curve.
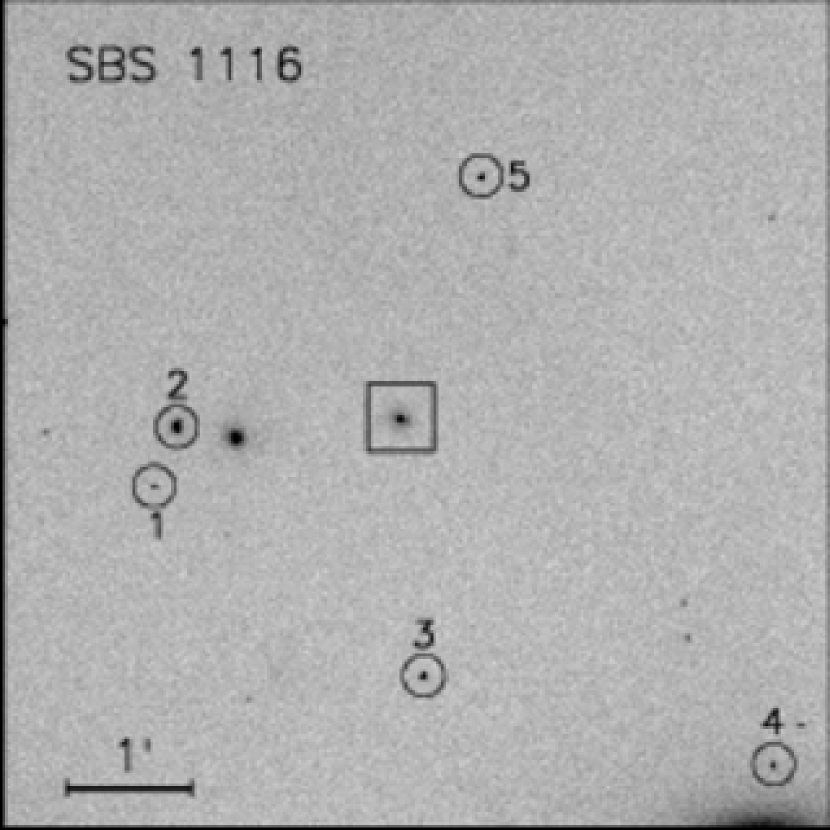
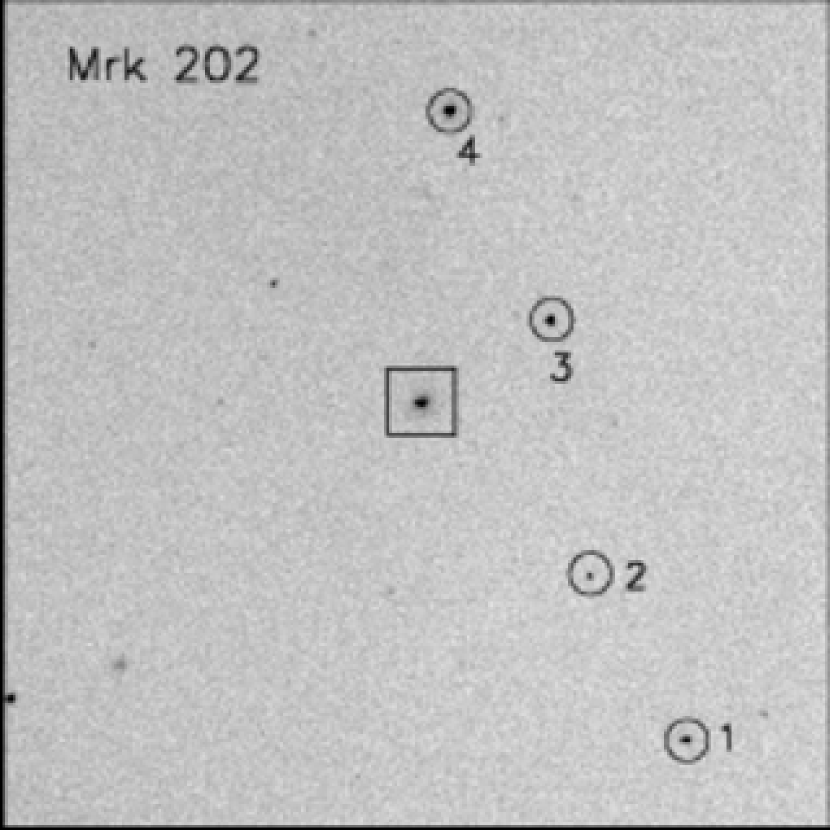
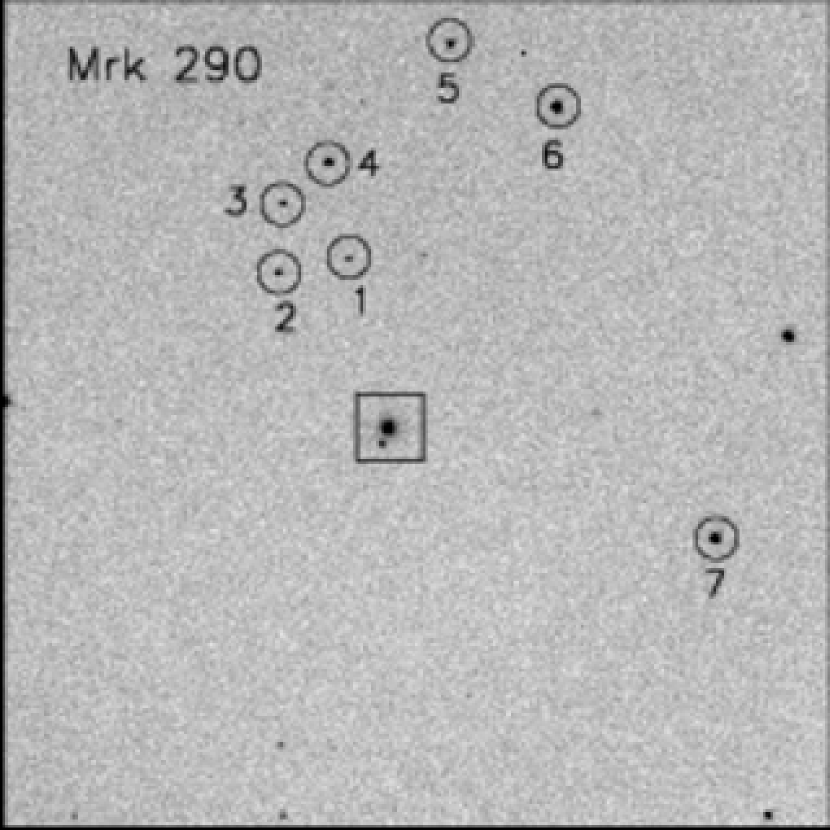
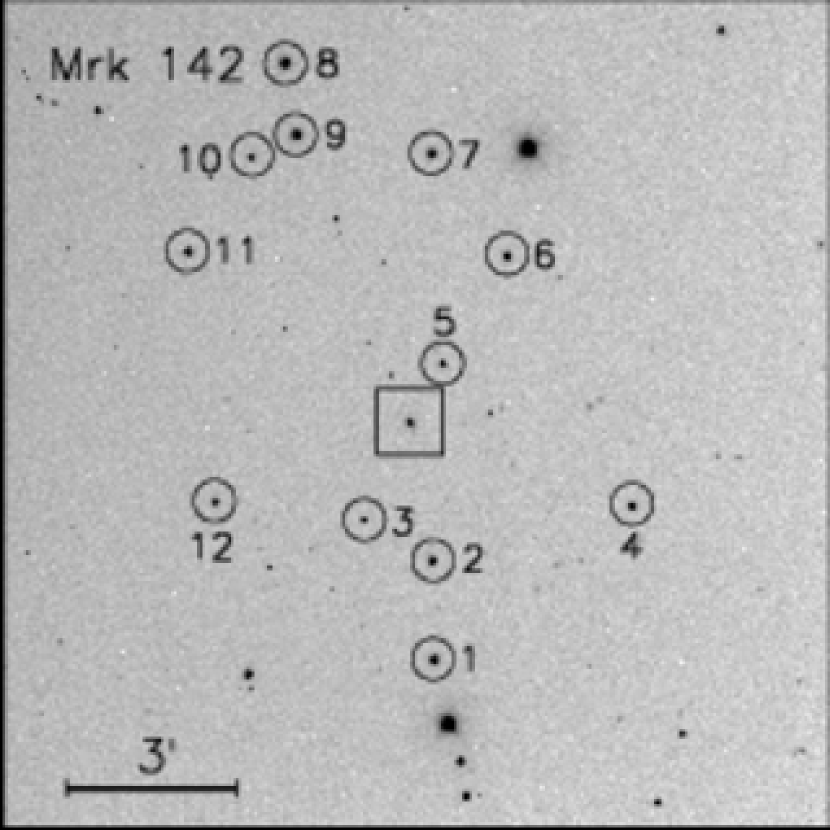
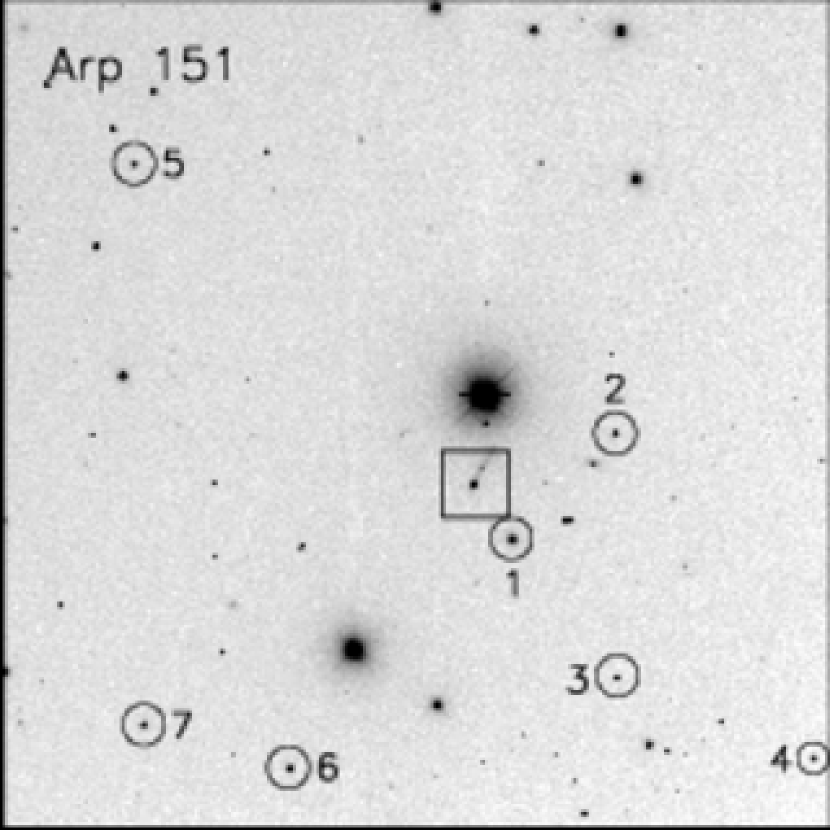
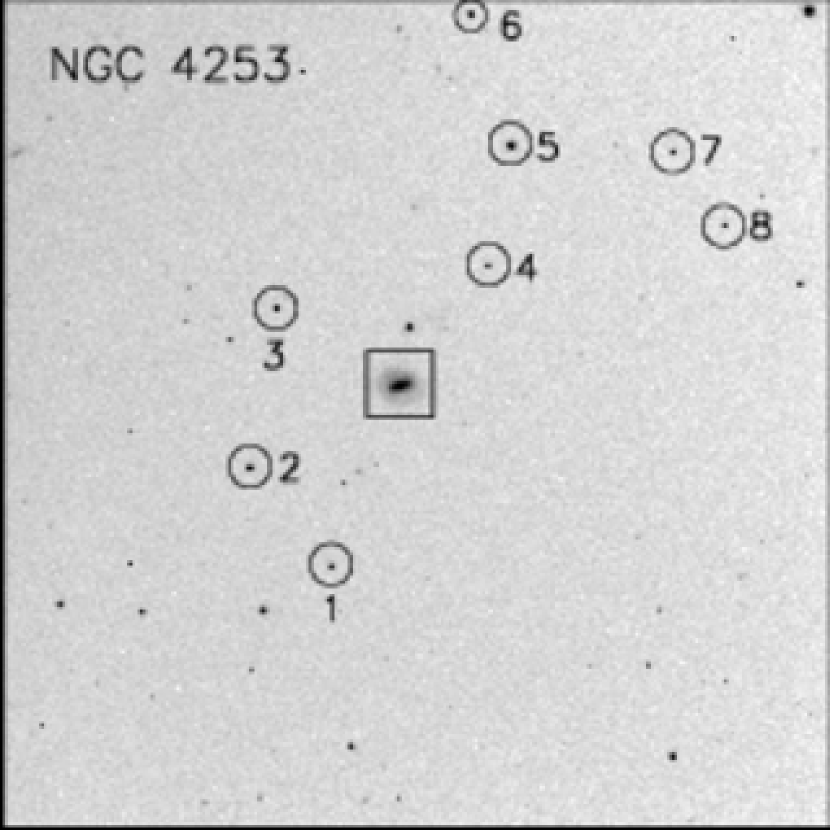
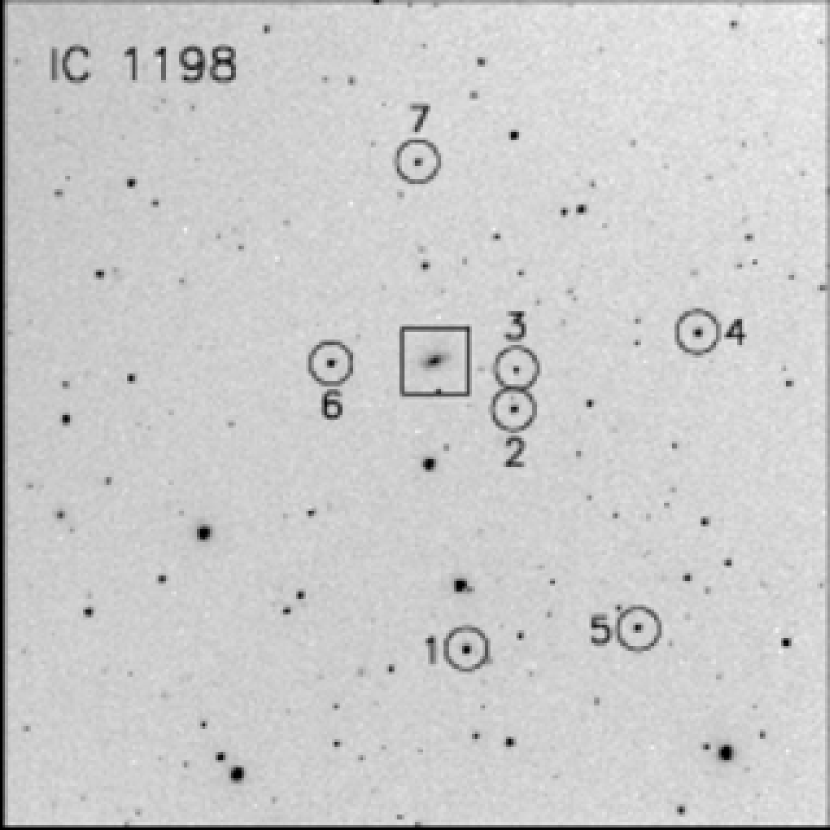
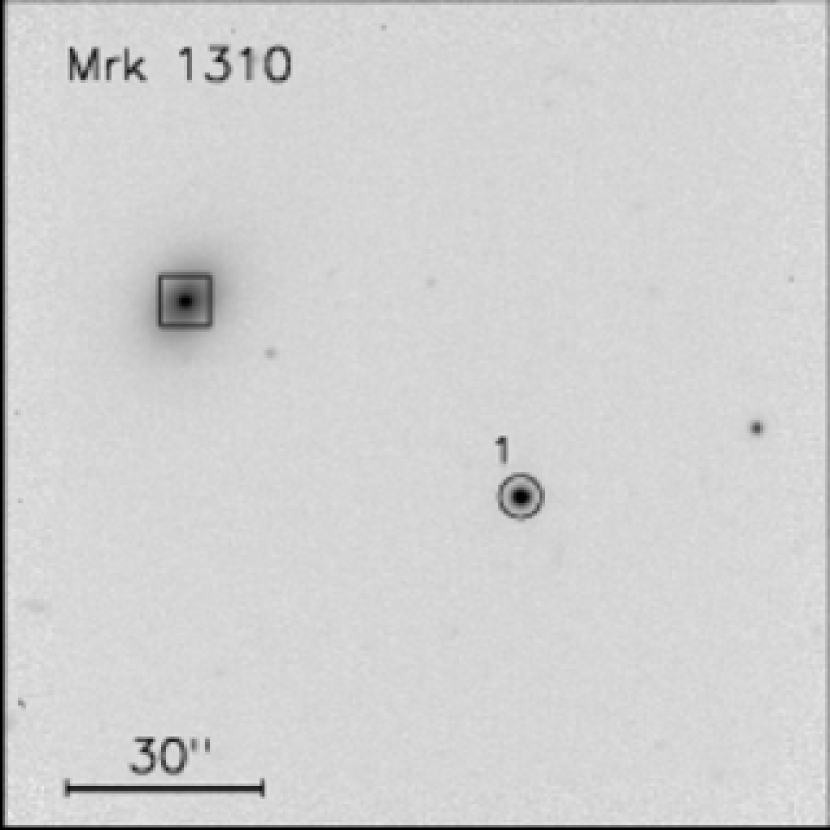
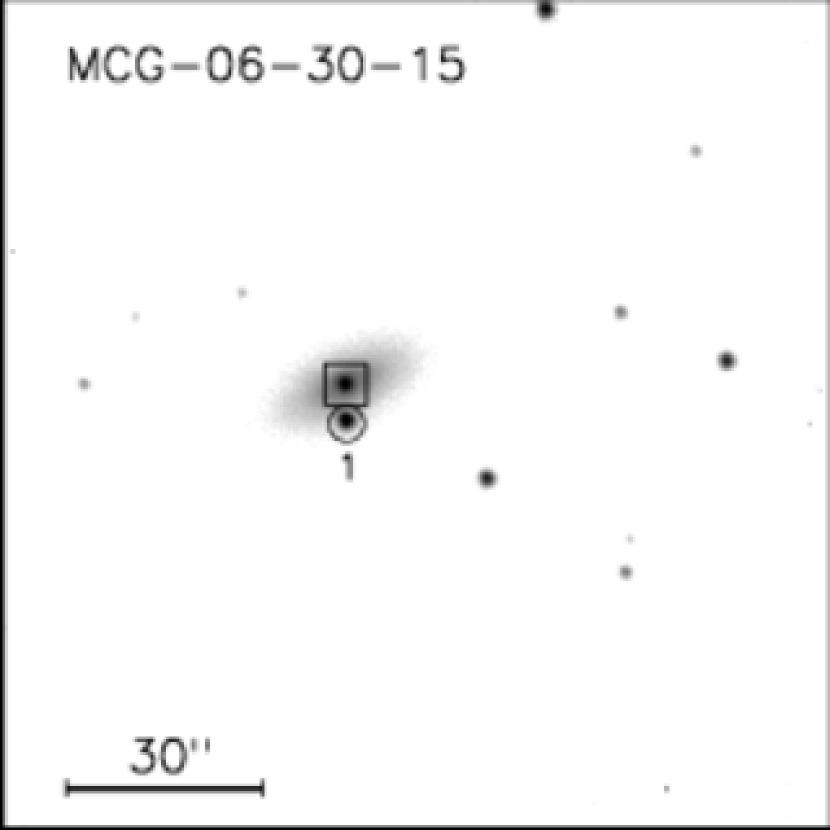
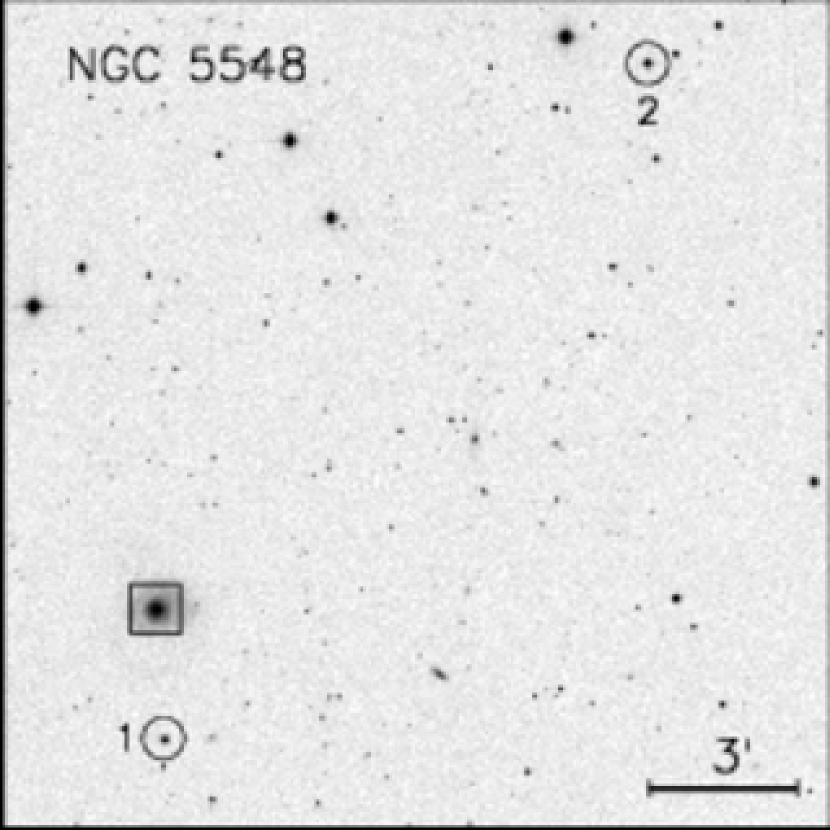
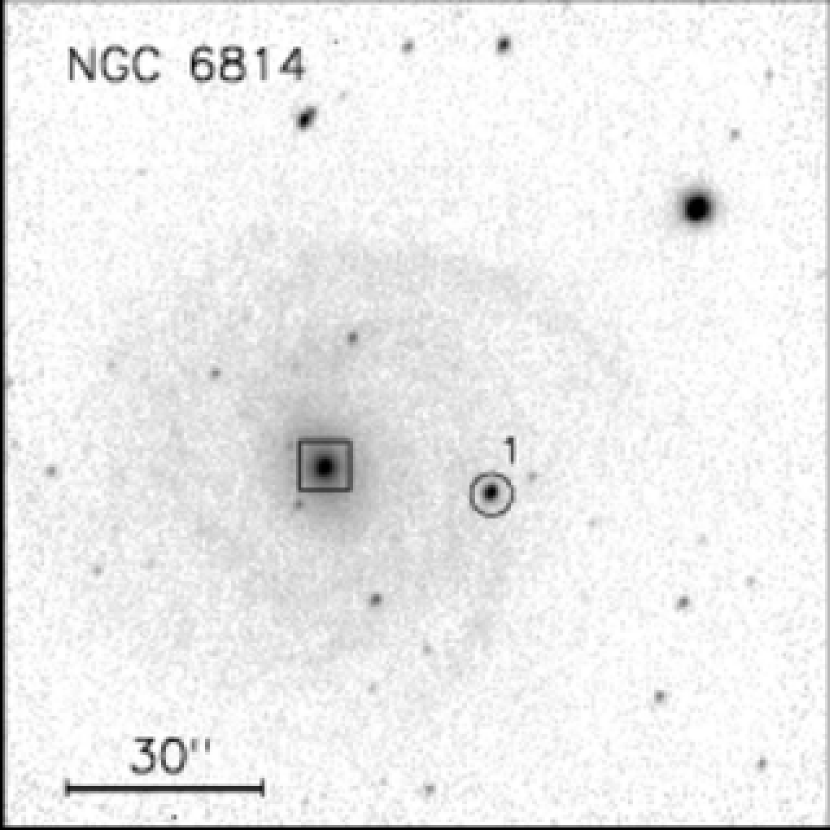
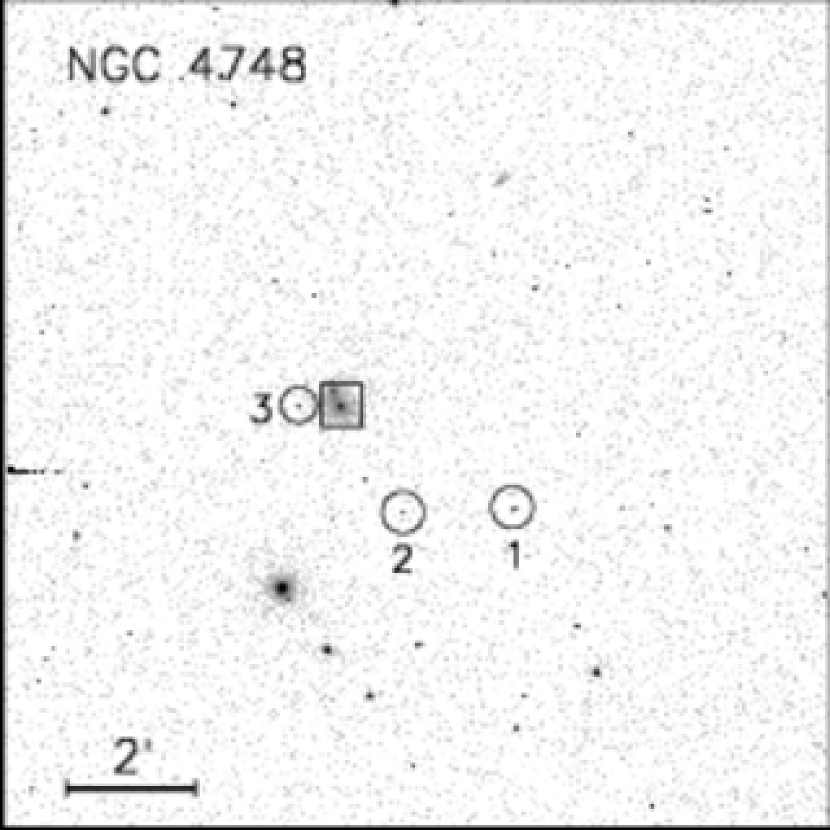
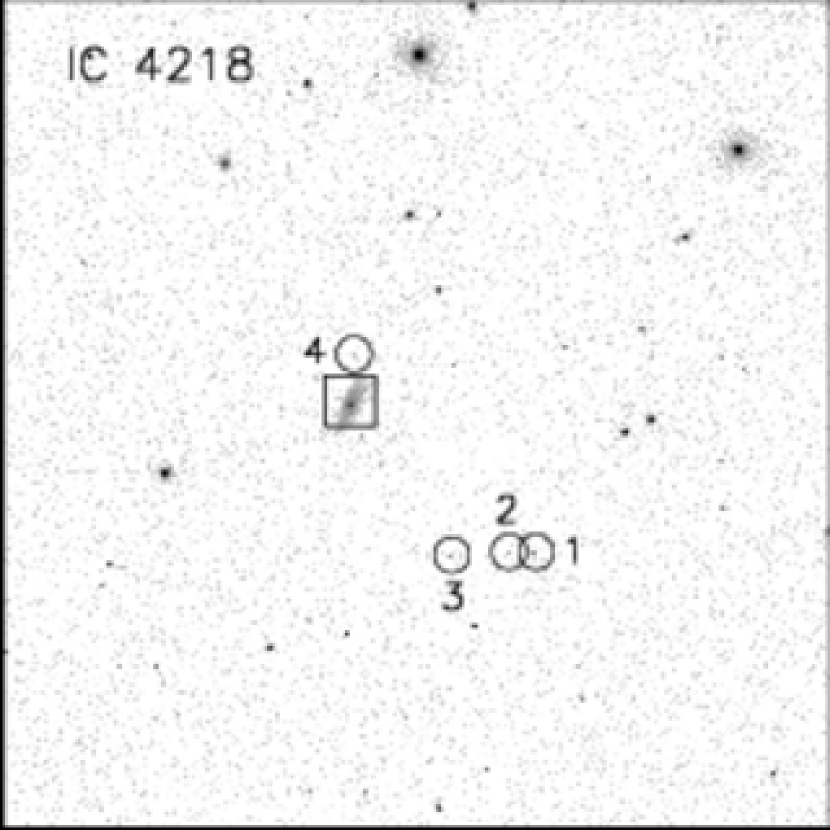
While the calibration of the comparison stars relative to one another and to the AGN is accurate, the absolute calibration is more uncertain, especially in the cases when only a small number of Landolt fields were observed over a limited airmass range from a single night. We estimate the accuracy of the photometric zeropoint calibration to be better than mag, which we determined by measuring the standard deviation of the various measurements of a single comparison star over the course of a photometric night. The absolute flux calibration, however, does not affect our results since we are only interested in relative changes. The final comparison stars for each object are shown in Figures 1–4 and their calibrated magnitudes are listed in Table 4.
| Object | Star | ||
|---|---|---|---|
| (mag) | (mag) | ||
| Mrk 142 | 1 | 14.672 0.004 | 14.023 0.007 |
| 2 | 15.191 0.005 | 14.658 0.006 | |
| 3 | 16.648 0.053 | 16.063 0.014 | |
| 4 | 15.303 0.015 | 14.604 0.019 | |
| 5 | 15.805 0.032 | 15.175 0.015 | |
| 6 | 15.667 0.013 | 14.649 0.011 | |
| 7 | 14.811 0.003 | 14.116 0.010 | |
| 8 | 13.869 0.013 | 13.275 0.016 | |
| 9 | 14.626 0.016 | 13.385 0.017 | |
| 10 | 16.416 0.012 | 15.508 0.014 | |
| 11 | 15.656 0.016 | 14.692 0.015 | |
| 12 | 15.956 0.027 | 15.237 0.022 | |
| SBS 1116+583A | 1 | 17.392 0.004 | 17.161 0.046 |
| 2 | 14.242 0.006 | 13.775 0.014 | |
| 3† | 17.167 | 16.311 | |
| 4† | 17.166 | 16.537 | |
| 5 | 17.036 0.008 | 16.468 0.005 | |
| Arp 151 | 1 | 14.300 0.079 | 13.166 0.078 |
| 2 | 15.487 0.084 | 14.814 0.082 | |
| 3 | 15.496 0.072 | 15.442 0.083 | |
| 4 | 15.674 0.073 | 15.027 0.081 | |
| 5 | 15.610 0.069 | 15.107 0.084 | |
| 6 | 15.054 0.074 | 14.306 0.086 | |
| 7 | 15.417 0.076 | 14.720 0.087 | |
| Mrk 1310 | 1 | 16.780 0.003 | 15.752 0.002 |
| Mrk 202 | 1† | 17.221 | 16.429 |
| 2† | 17.907 | 17.412 | |
| 3 | 17.253 0.013 | 15.710 0.019 | |
| 4 | 15.309 0.008 | 14.560 0.001 | |
| NGC 4253 | 1 | 17.247 0.115 | 15.848 0.025 |
| 2 | 16.157 0.045 | 15.166 0.014 | |
| 3 | 16.293 0.037 | 15.602 0.021 | |
| 4 | 17.236 0.082 | 16.323 0.029 | |
| 5 | 14.708 0.023 | 14.218 0.021 | |
| 6 | 16.483 0.013 | 15.599 0.035 | |
| 7 | 16.833 0.042 | 15.943 0.031 | |
| 8 | 16.153 0.045 | 16.195 0.019 | |
| NGC 4748 | 1 | 16.340 0.020 | 15.660 0.010 |
| 2 | 17.130 0.010 | 16.650 0.010 | |
| 3† | 17.430 | 16.854 | |
| IC 4218 | 1 | 16.760 0.010 | 15.990 0.010 |
| 2 | 18.290 0.020 | 17.680 0.010 | |
| 3† | 17.480 | 17.060 | |
| 4† | 18.750 | 18.008 | |
| MCG-06-30-15 | 1 | 16.128 0.014 | 15.163 0.010 |
| NGC 5548 | 1 | 14.422 0.006 | 13.782 0.003 |
| 2 | 13.742 0.004 | 13.192 0.002 | |
| Mrk 290 | 1 | 18.298 0.015 | 17.648 0.001 |
| 2 | 18.435 0.007 | 17.302 0.003 | |
| 3 | 18.849 0.001 | 17.395 0.047 | |
| 4 | 17.471 0.013 | 16.513 0.016 | |
| 5 | 17.213 0.021 | 16.636 0.002 | |
| 6 | 16.107 0.001 | 15.474 0.003 | |
| 7† | 15.667 | 15.480 | |
| IC 1198 | 1 | 14.855 0.009 | 14.146 0.007 |
| 2 | 15.773 0.018 | 15.146 0.010 | |
| 3 | 16.889 0.016 | 16.385 0.044 | |
| 4 | 15.437 0.019 | 14.537 0.013 | |
| 5 | 15.893 0.010 | 14.860 0.045 | |
| 6 | 15.705 0.016 | 14.856 0.016 | |
| 7 | 16.263 0.035 | 15.547 0.011 | |
| NGC 6814 | 1 | 16.779 0.010 | 15.690 0.005 |
Note. — The quoted error is the standard deviation of all the measurements for the comparison star taken during the photometric night, and represents an estimate of the accuracy of the photometric calibration. The comparison stars marked with a dagger were not observed on a photometric night, and therefore were not directly calibrated using Landolt (1992) standard stars. Instead, these stars were calibrated based on the other comparison stars for the AGN.
4.2. MAGNUM Photometry
The photometry for the MAGNUM objects was carried out in a manner similar to the photometry for the KAIT, Tenagra, and P60 objects. For each of the MAGNUM images, the IRAF task phot within the daophot package was used to measure the flux of the AGN and the sky background through a circular aperture and a surrounding annulus. For Mrk 1310, MCG-06-30-15, and NGC 6814, the AGN flux was compared to a single star that fell within the MAGNUM field of view. For NGC 5548, the AGN flux was compared to two stars which did not fall within the same field of view, but were observed in an alternating pattern with the AGN as described by Suganuma et al. (2006). The AGN magnitude was found by averaging over the multiple exposures taken throughout the night.
The size of the aperture and sky annulus for the MAGNUM objects was set based upon past photometry of NGC 5548, and we did not experiment with a range of aperture sizes as was discussed above for the KAIT, Tenagra, and P60 objects. Following Suganuma et al. (2006), we used an aperture size of 415 and a sky annulus of 554–692 for NGC 5548. For the remaining MAGNUM objects, we reduced the aperture radius to 208 because the comparison stars were located in the same field of view as the object. The sky annulus for Mrk 1310 and NGC 6814 was the same size as the one used for NGC 5548. Since the nucleus of MCG-06-30-15 and the comparison star were located close together, about 5″ apart, we enlarged the sky annulus for this object to 913–1052.
As a final step, the and -band light curves were flux calibrated using Landolt (1992) standard stars as discussed in §3. Unlike the flux calibration for the KAIT, Tenagra, and P60 images, we did not fit the color term, but the correction is expected to be small. We found the difference between the instrumental and calibrated magnitude for each of the comparison stars, and applied the average offset to the AGN light curve. The accuracy of the photometric zeropoint calibration for the MAGNUM objects is estimated to be better than mag.
4.3. Host-Galaxy Subtraction
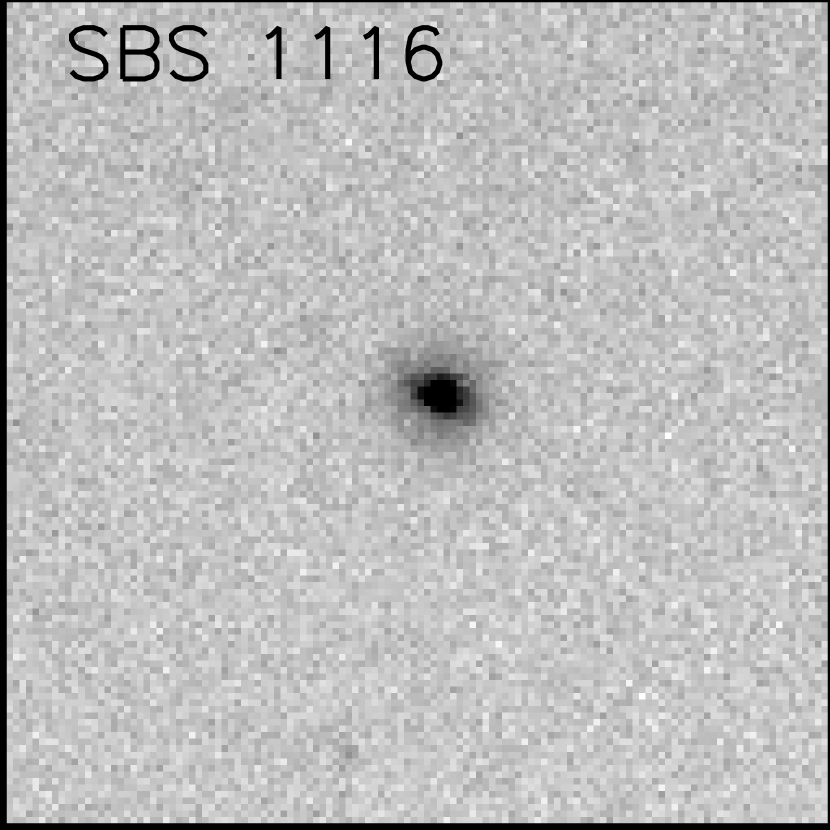
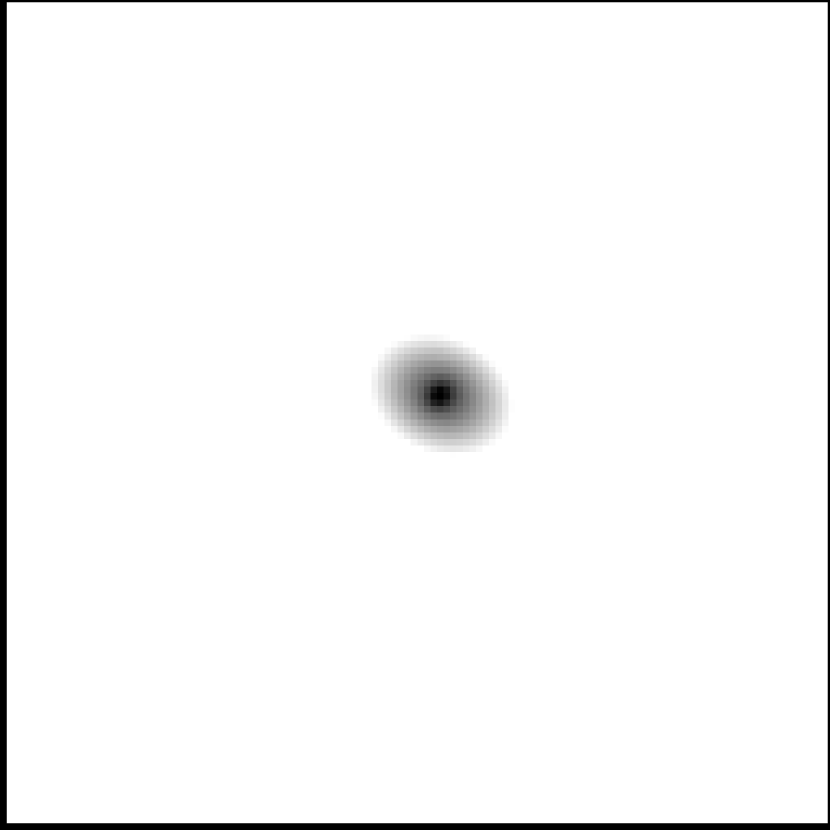
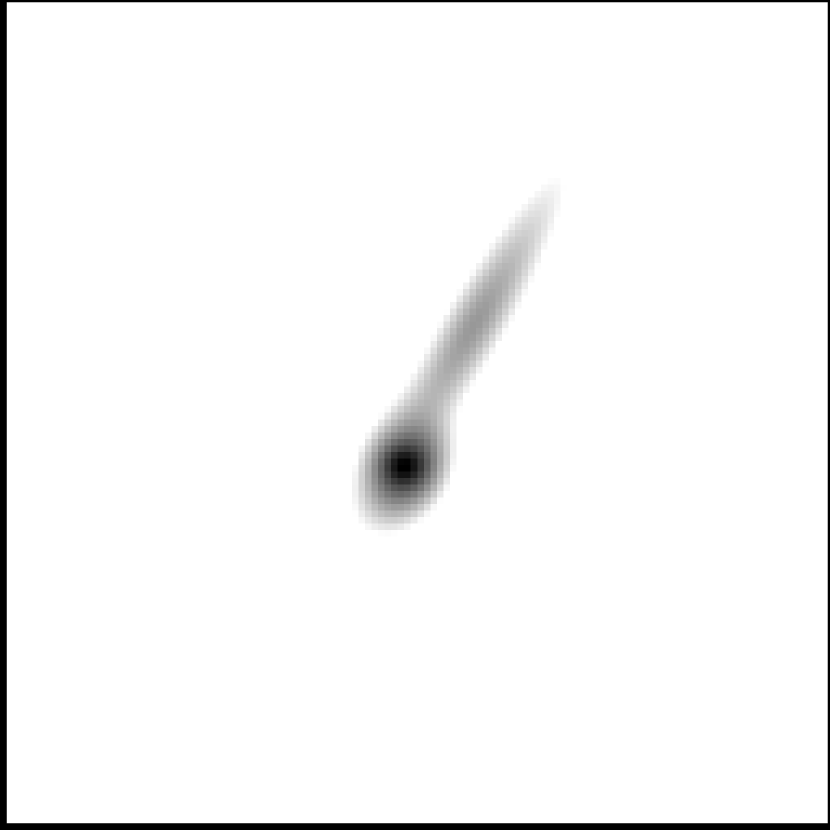
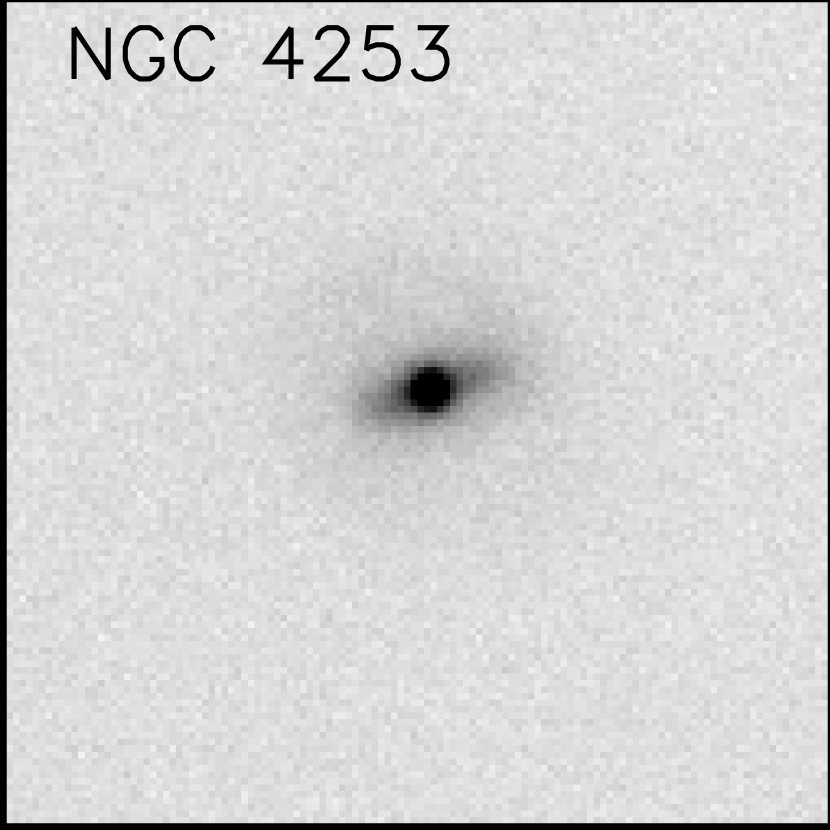
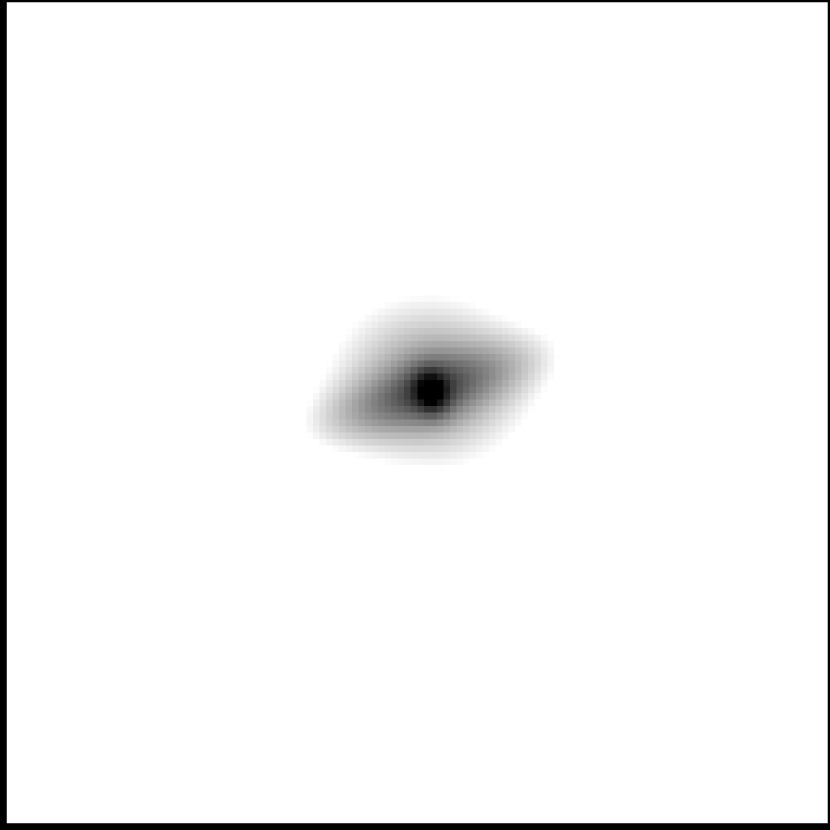
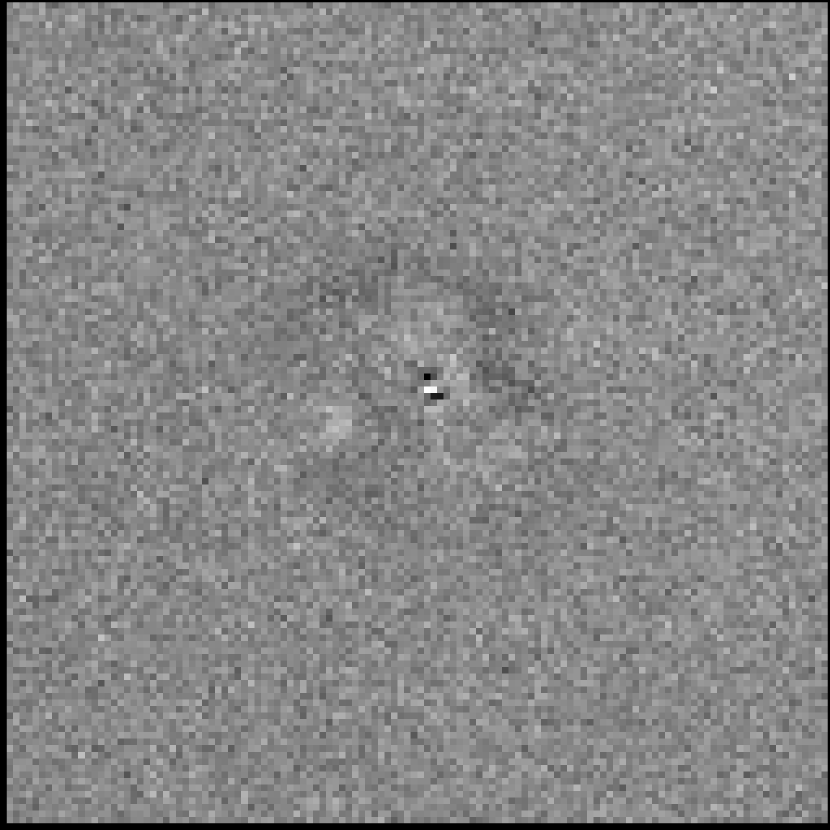
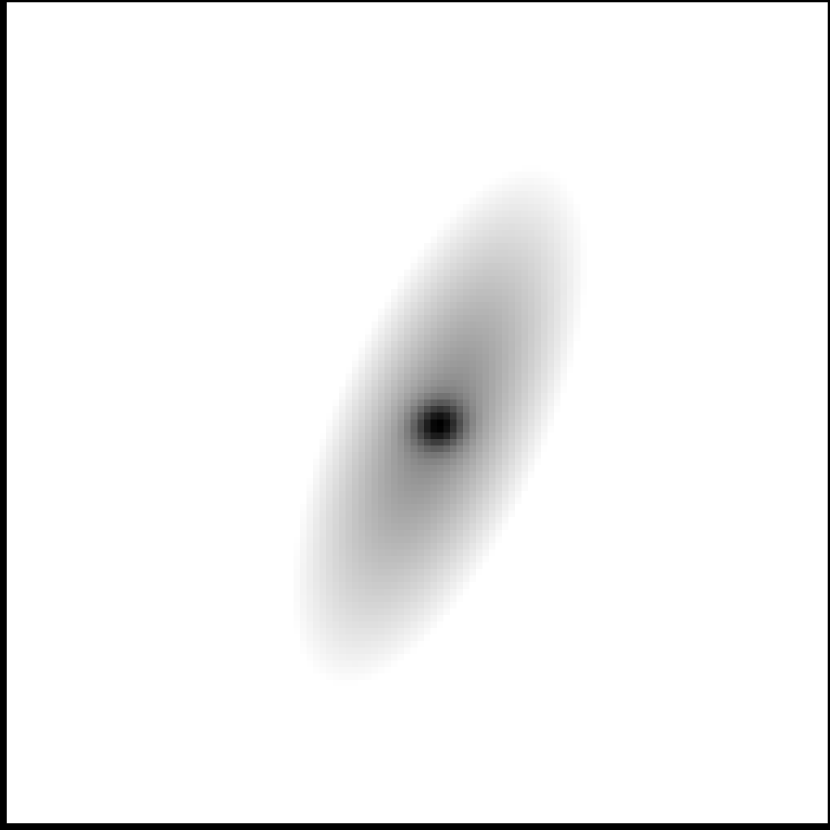
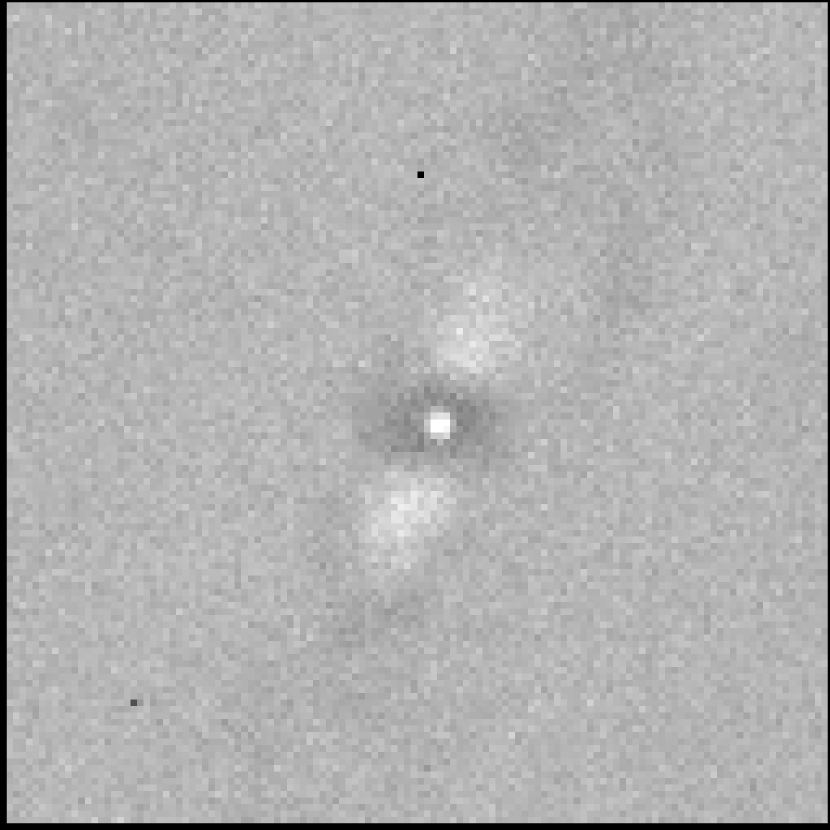
The - and -band photometric light curves include a combination of AGN light and flux from the host-galaxy starlight, which dilutes the observed AGN variations in the light curve. We removed host-galaxy starlight by selecting the best image in each band and using the two-dimensional image decomposition package Galfit (Peng et al., 2002).
We first fit a Moffat function to a nearby, bright comparison star. We used the resultant model as the input point-spread function (PSF). We focused on a subsection of the image centered on the galaxy and used Galfit to fit a single exponential function for the disk, a PSF for the nucleus, and a sky component. Due to the seeing effects and the low resolution of the ground-based images, we are unable to properly disentangle the bulge of the galaxy from the nucleus (or even discern whether a bulge is present). Consequently, we do not include a bulge component in the model. More complete modeling will be done in the future based on Cycle 17 Hubble Space Telescope (HST) high-resolution images (GO-11662, PI: Bentz). Two exponential functions were needed in the cases of NGC 4253 and IC 1198 to account for both the disk and the bar in these objects. Also, Arp 151 and NGC 4748 were fit with two exponential functions. The second exponential function was used to fit the tidal tail seen in Arp 151 and the disk of the second galaxy near NGC 4748. Stars projected close to the galaxy were masked out during the fitting process. In Figure 5, we present a few examples of the Galfit models.
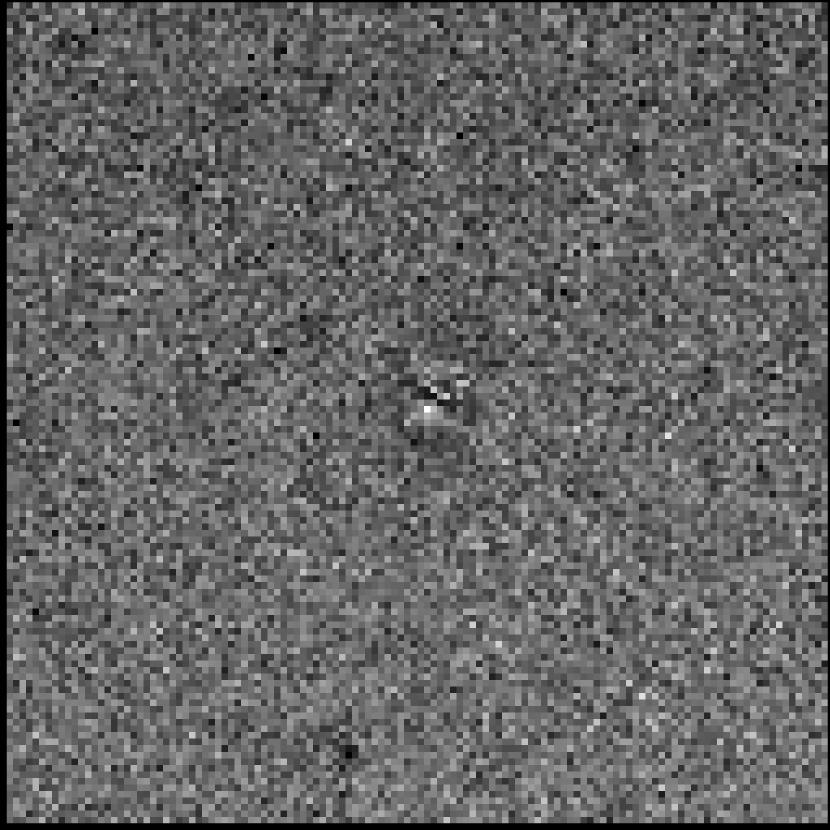
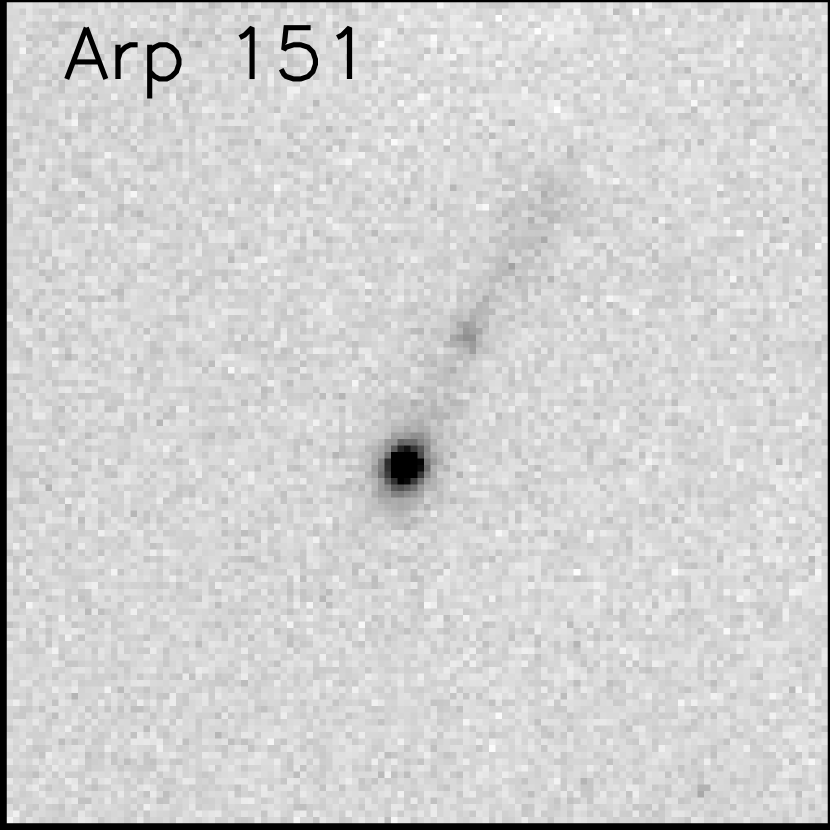
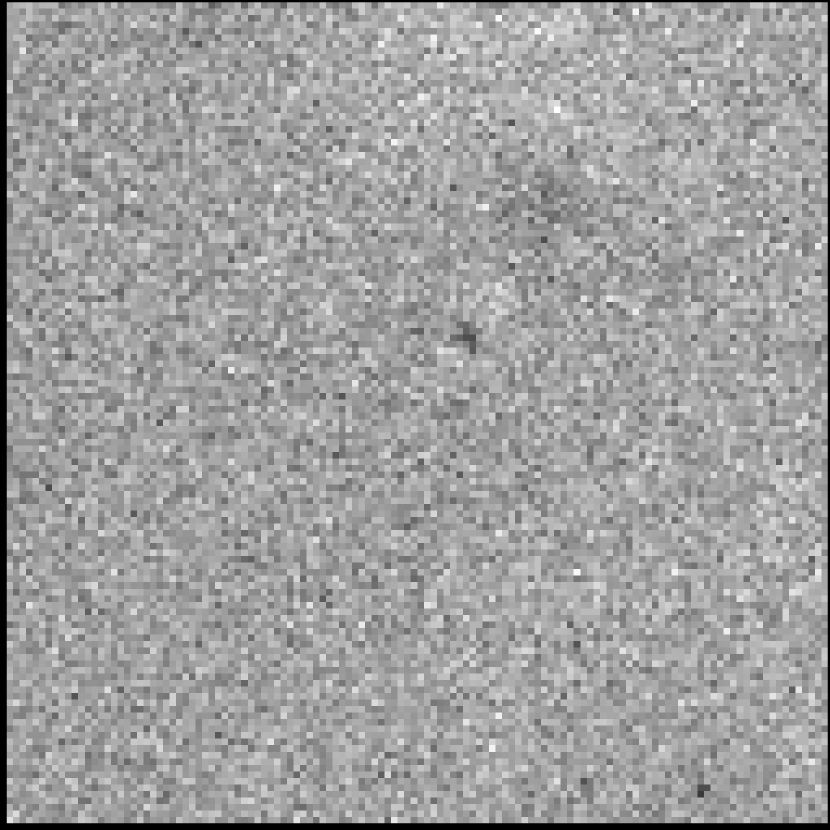

We then measured the galaxy magnitude from the model through the appropriate aperture. We converted the data points in the light curve from magnitudes to flux units, subtracted the constant galaxy flux from each of the points in the light curve, and converted back to magnitudes. In Table 5, we list the host-galaxy magnitude measured through the aperture in each band.
| Object | Aperture Radius | ||
|---|---|---|---|
| (″) | (mag) | (mag) | |
| (1) | (2) | (3) | (4) |
| Mrk 142 | 4.35 | 18.47 | 17.28 |
| SBS 1116+583A | 3.20 | 16.92 | 16.07 |
| Arp 151 | 4.35 | 17.30 | 16.30 |
| Mrk 1310 | 2.08 | 17.56 | 16.71 |
| Mrk 202 | 3.20 | 17.83 | 17.22 |
| NGC 4253 | 4.35 | 16.08 | 15.36 |
| NGC 4748 | 2.65 | 17.50 | 16.66 |
| IC 4218 | 2.65 | 17.90 | 16.96 |
| MCG-06-30-15 | 2.08 | 16.72 | 15.82 |
| NGC 5548 | 4.15 | 16.17 | 14.96 |
| Mrk 290 | 3.20 | 18.36 | 17.02 |
| IC 1198 | 4.35 | 16.89 | 15.94 |
| NGC 6814 | 2.08 | 16.64 | 15.61 |
Note. — Columns 3 and 4 provide the estimated - and -band host-galaxy magnitude measured through the aperture given in column 2. Host-galaxy contributions were estimated based on the simple Galfit models described in §4.3.
The simple host-galaxy subtraction method was applied to all of the light curves except those for NGC 5548. Suganuma et al. (2006) provide a measurement of the - and -band host-galaxy flux of NGC 5548 though an aperture with a radius of 415. They additionally supply a correction to the host-galaxy flux which depends on the seeing. Since we used the same observational setup for our work, we used the results from Suganuma et al. (2006) to remove the host-galaxy starlight of NGC 5548. We determined the median seeing over all the images in each band and applied the seeing correction to the - and -band host-galaxy flux. The host-galaxy offset was then subtracted from each of the points on the light curve.
4.4. Error Estimation
The uncertainty in the measurements was first calculated by the IRAF package daophot, which uses photon statistics and accounts for the total number of pixels in the aperture and sky annulus, as well as the read noise and gain of the detector. However, using photon statistics alone can underestimate the error. Both seeing variations, which affect the extended host galaxy differently than a point source, and large color differences between the AGN and the comparison stars, can increase the measurement errors. Therefore, we applied a secondary uncertainty estimation method. We selected a relatively flat or slowly varying portion of each light curve and calculated the average difference between pairs of points closely spaced in time. This method assumes that the objects do not exhibit microvariability [but Klimek et al. (2004) found that narrow-line Seyfert 1 galaxies can show signs of variability over timescales of hours]. For each point on the light curve, we adopted the larger of the two uncertainty measurements. Most often, the secondary method produced the larger error measurement. However, in instances where there was poor seeing or bad weather, the photon-counting error was greater. The uncertainty in the photometric measurements affects our ability to determine the average time lag between continuum and emission-line variation. Choosing the larger error will result in a more conservative estimate of the time lag and its associated uncertainties.
5. Results
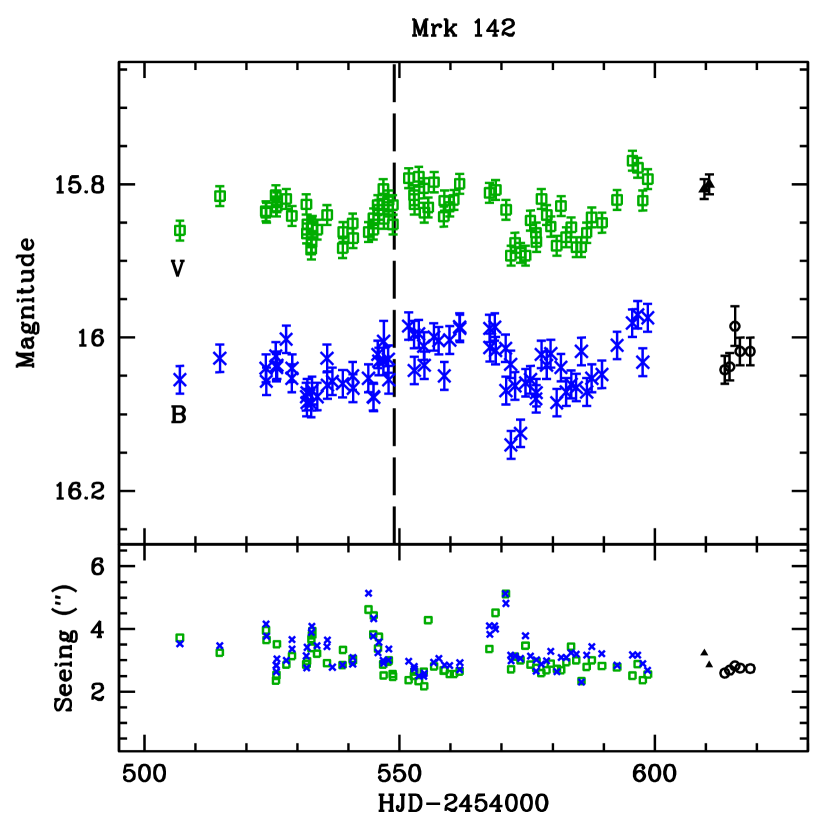
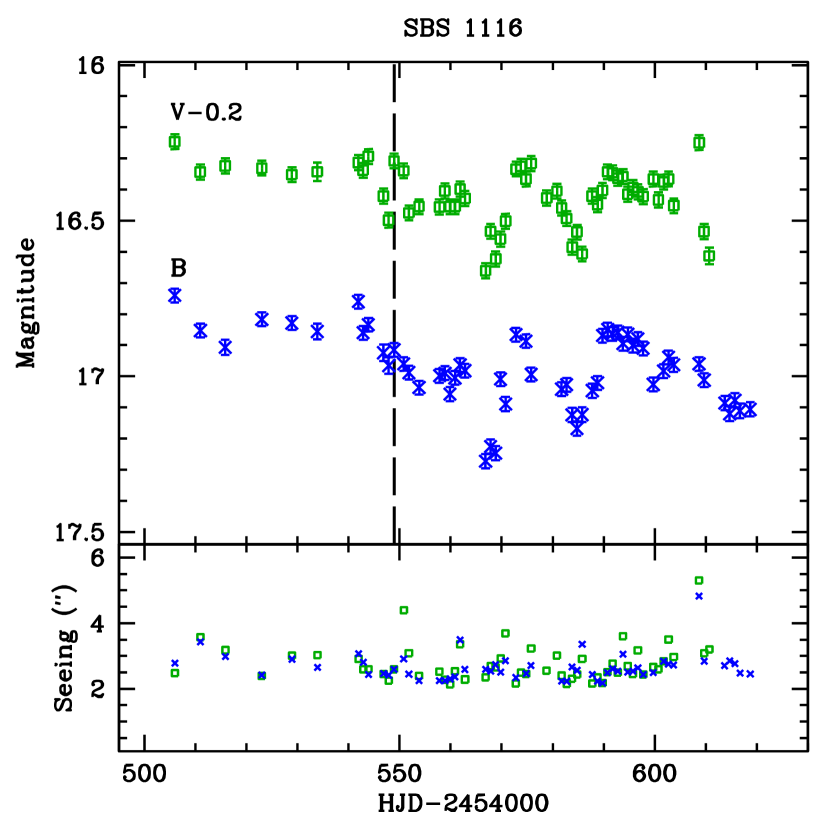
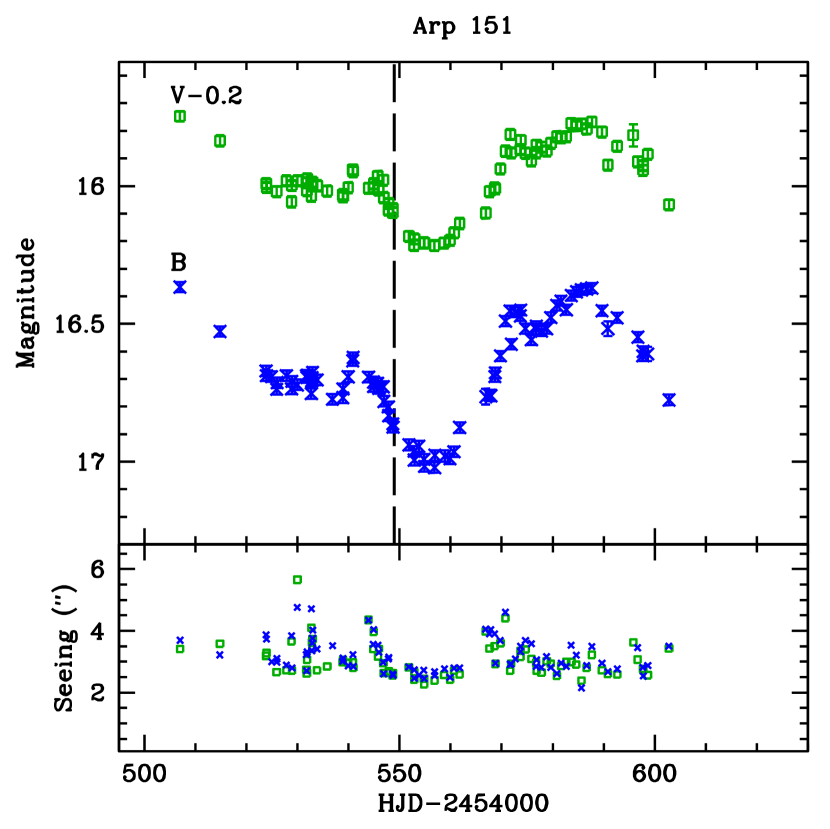
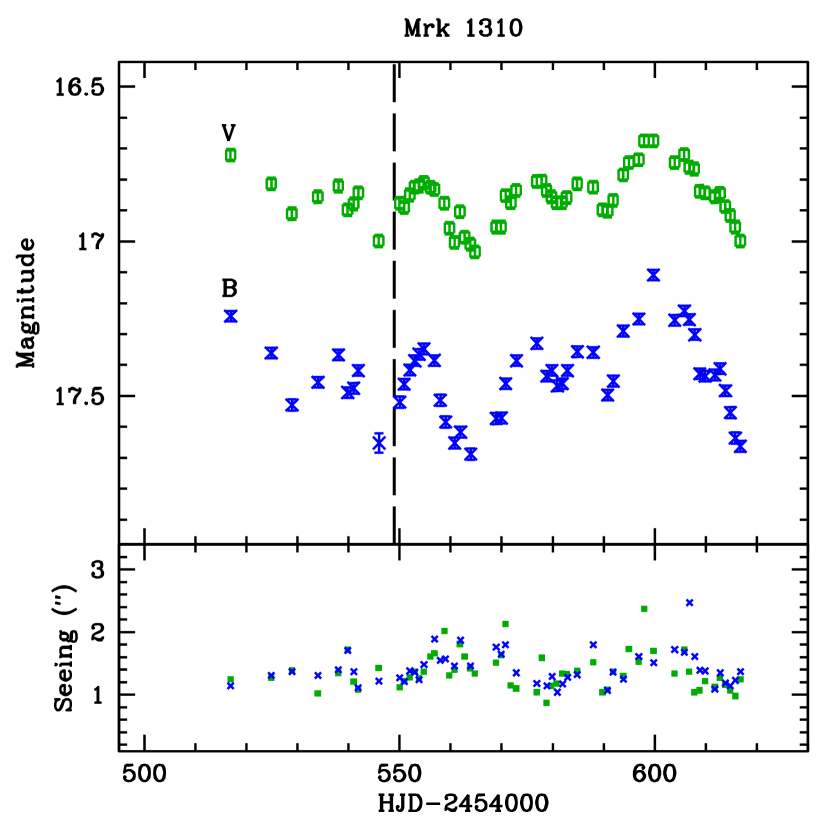
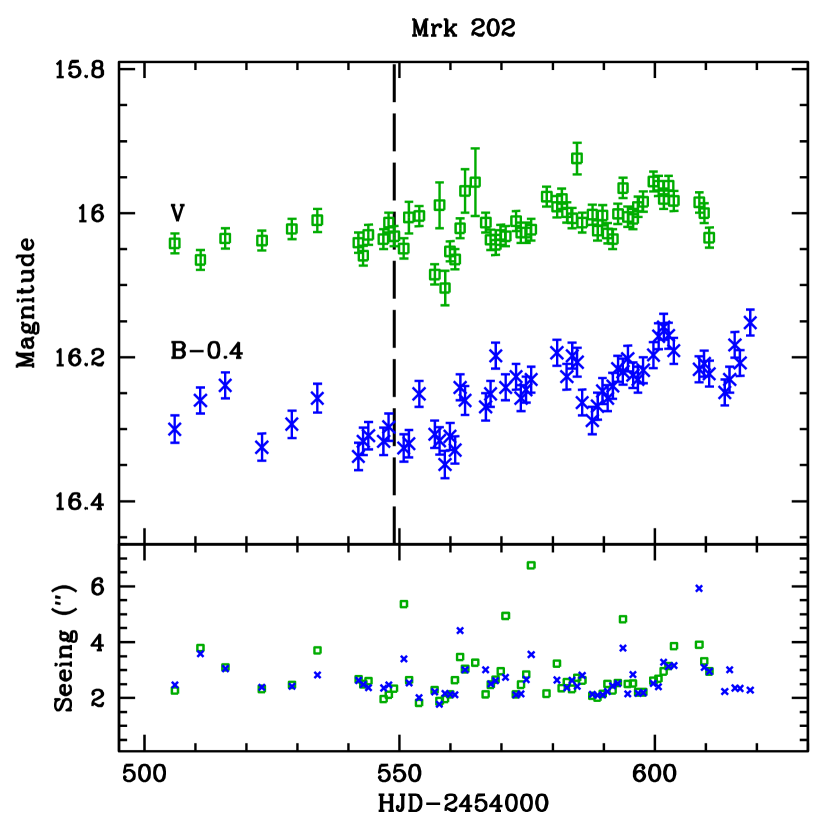
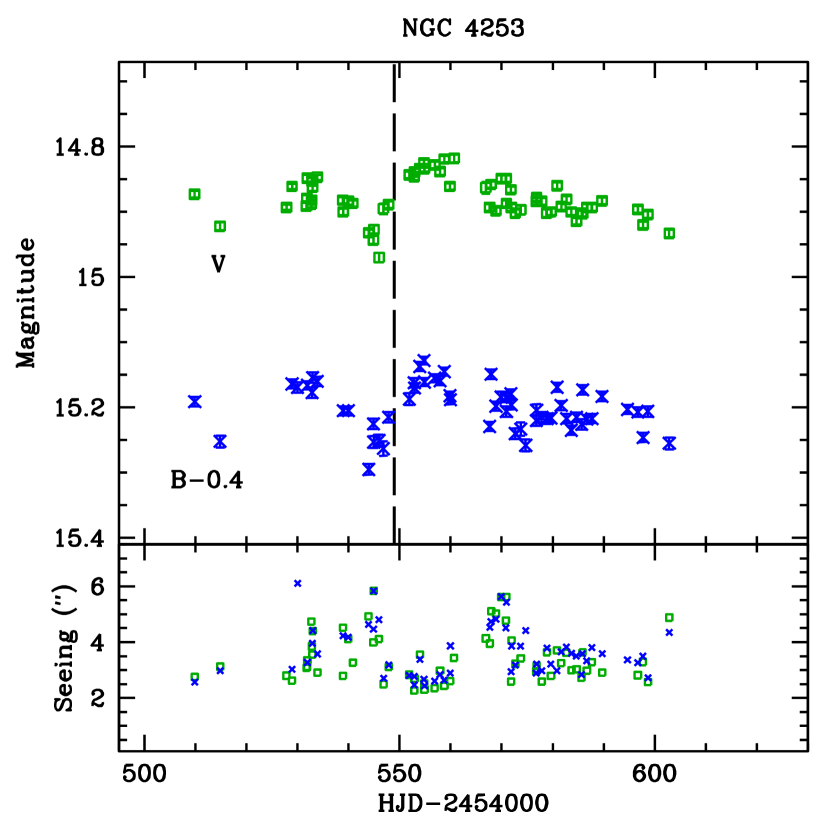
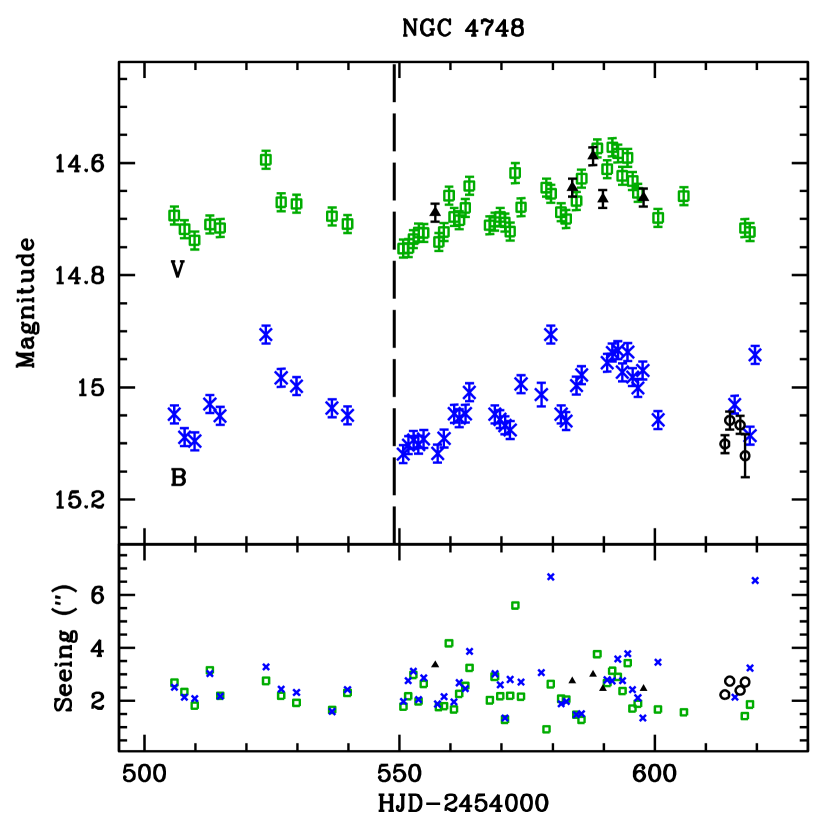
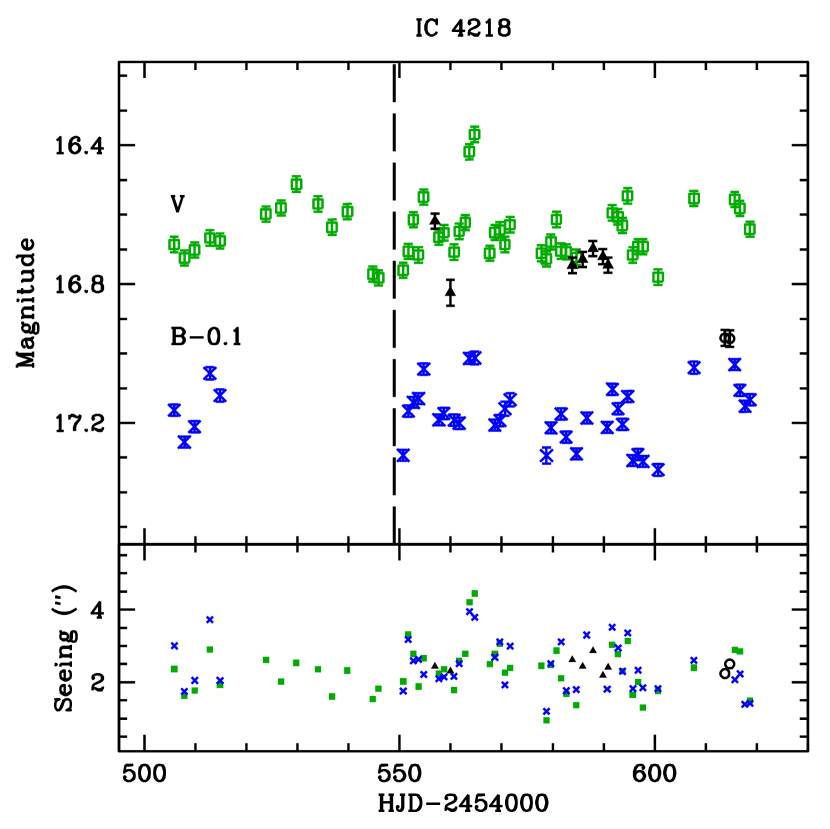
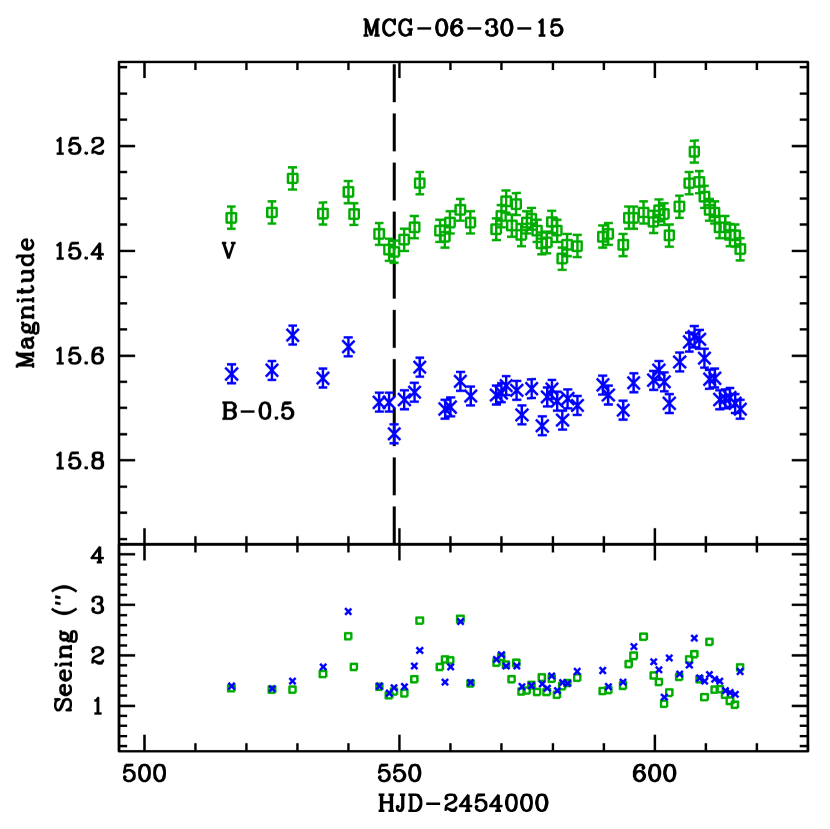
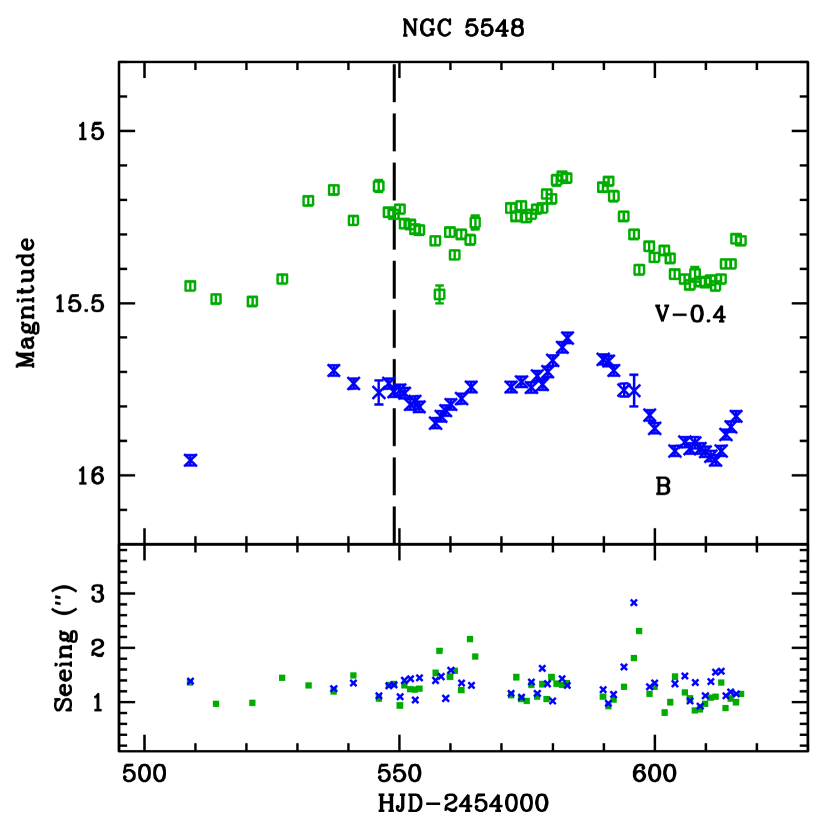
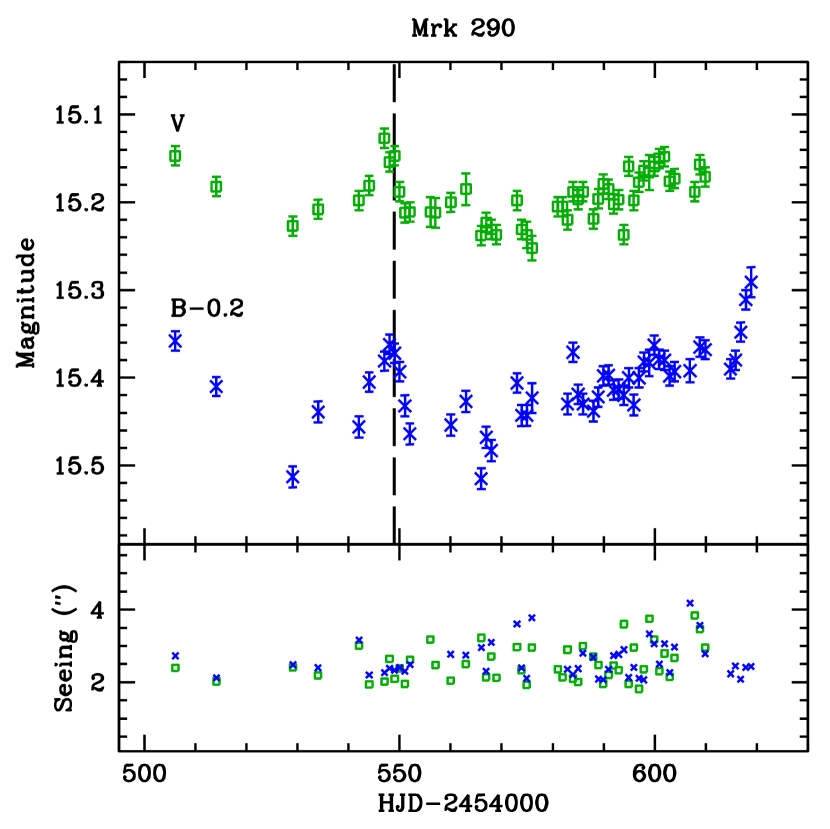
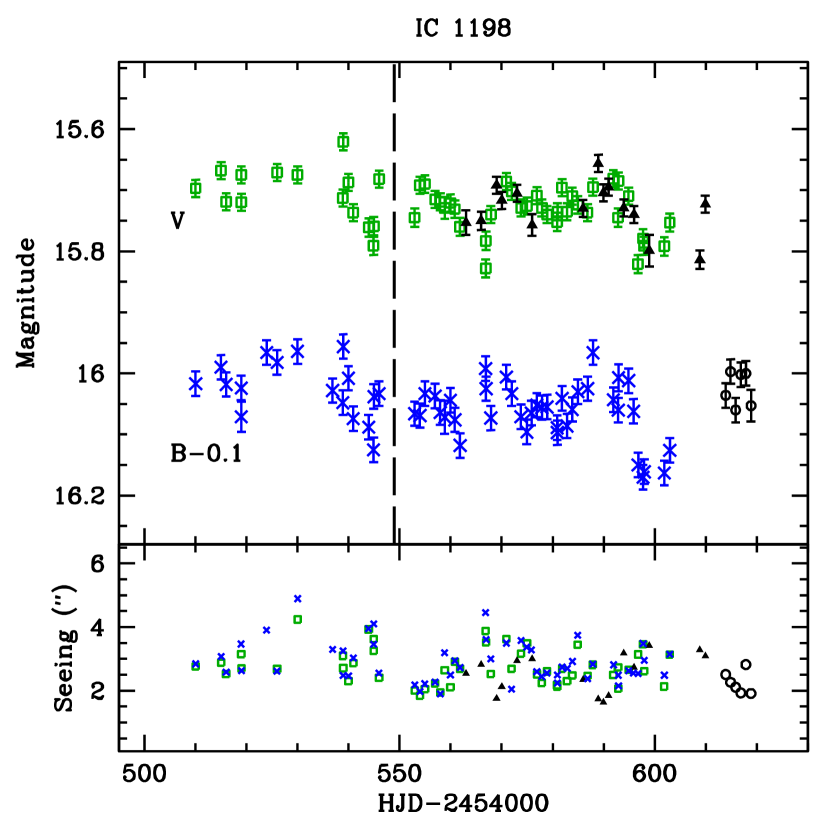
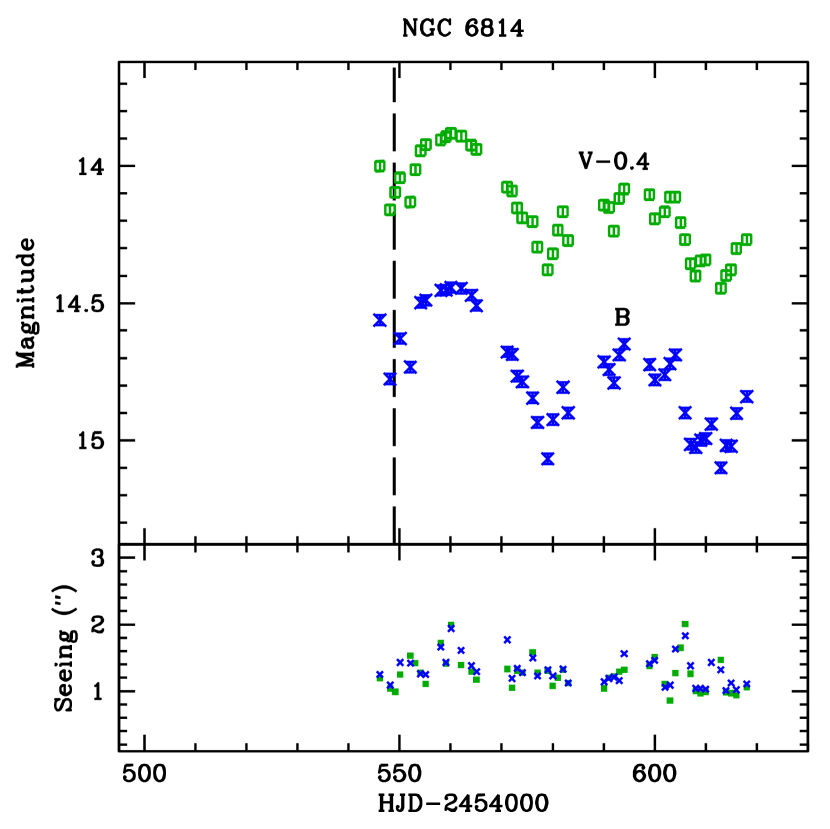
We present the nuclear - and -band light curves for the full sample, along with the estimated seeing for each image, in Figures 6–18 and in Table 6. These light curves include the host-galaxy pedestal subtraction and have been corrected for Galactic extinction using the values given in Table 1.
| Band | Band | |||||||||
|---|---|---|---|---|---|---|---|---|---|---|
| Object | UT | HJD | error | FWHM | HJD | error | FWHM | |||
| Date | 2454000 | (mag) | (mag) | (arcsec) | 2454000 | (mag) | (mag) | (arcsec) | ||
| Mrk 142 | 2008 Feb 10 | 506.9393 | 16.055 | 0.018 | 3.5 | 506.9473 | 15.860 | 0.013 | 3.7 | |
| Mrk 142 | 2008 Feb 18 | 514.7661 | 16.027 | 0.018 | 3.5 | 514.7742 | 15.815 | 0.013 | 3.2 | |
| Mrk 142 | 2008 Feb 27 | 523.8112 | 16.040 | 0.018 | 4.2 | 523.8193 | 15.835 | 0.013 | 4.0 | |
| Mrk 142 | 2008 Feb 27 | 523.9006 | 16.057 | 0.018 | 3.8 | 523.9085 | 15.837 | 0.013 | 3.6 | |
| Mrk 142 | 2008 Feb 29 | 525.7402 | 16.024 | 0.018 | 2.8 | 525.7496 | 15.814 | 0.013 | 2.4 | |
| Band | Band | ||||||||
|---|---|---|---|---|---|---|---|---|---|
| Object | |||||||||
| (mJy) | (mJy) | (mJy) | (mJy) | ||||||
| (1) | (2) | (3) | (4) | (5) | (6) | (7) | (8) | (9) | |
| Mrk 142 | 1.57 | 0.05 | 0.03 | 1.17 | 1.64 | 0.04 | 0.02 | 1.12 | |
| SBS 1116+583A | 0.66 | 0.07 | 0.10 | 1.63 | 0.80 | 0.07 | 0.08 | 1.47 | |
| Arp 151 | 0.89 | 0.14 | 0.16 | 1.83 | 1.22 | 0.14 | 0.11 | 1.54 | |
| Mrk 1310 | 0.44 | 0.05 | 0.12 | 1.70 | 0.65 | 0.05 | 0.07 | 1.39 | |
| Mrk 202 | 0.89 | 0.04 | 0.04 | 1.20 | 1.40 | 0.04 | 0.03 | 1.18 | |
| NGC 4253 | 2.35 | 0.08 | 0.03 | 1.17 | 3.97 | 0.11 | 0.03 | 1.15 | |
| NGC 4748 | 3.96 | 0.22 | 0.05 | 1.22 | 4.80 | 0.22 | 0.04 | 1.18 | |
| IC 4218 | 0.51 | 0.05 | 0.09 | 1.42 | 0.78 | 0.06 | 0.08 | 1.52 | |
| MCG-06-30-15 | 1.40 | 0.06 | 0.04 | 1.19 | 2.59 | 0.10 | 0.03 | 1.21 | |
| NGC 5548 | 1.97 | 0.17 | 0.08 | 1.39 | 1.87 | 0.18 | 0.09 | 1.40 | |
| Mrk 290 | 2.33 | 0.09 | 0.04 | 1.23 | 2.98 | 0.08 | 0.02 | 1.12 | |
| IC 1198 | 1.42 | 0.06 | 0.04 | 1.22 | 1.82 | 0.07 | 0.03 | 1.21 | |
| NGC 6814 | 5.15 | 0.92 | 0.18 | 1.83 | 5.40 | 0.79 | 0.14 | 1.68 | |
Note. — Columns 2–5 list the mean flux (), the rms variation (), the normalized excess variance (), and the ratio of maximum to minimum fluxes () for the band. Similarly, columns 6–9 list the variability characteristics for the band. Magnitudes given in Tables 6–18 were first converted to fluxes using the calibration of Vega in the Johnson system before calculating the variability statistics.
5.1. Variability Characteristics
In order to quantify the variability of the - and -band light curves, in Table 7 we present variability characteristics for each of the objects. We determine the mean flux (), the root mean square (rms) deviation in the flux (), the ratio of the maximum to minimum flux (), and the normalized excess variance (). The normalized excess variance gives an estimate of the intrinsic variability of the source corrected for measurement uncertainties and normalized by the mean flux. It is defined according to Rodriguez-Pascual et al. (1997) as
| (1) |
where is the average uncertainty of the individual flux measurements.
As expected, there is a wide range in the level of variability between the 13 objects in the sample. About a third of the sample (including Arp 151, Mrk 1310, NGC 5548, and NGC 6814) shows large variations of about mag in both the and bands throughout the course of the campaign. However, most of the objects (including SBS 1116, Mrk 202, NGC 4253, NGC 4748 and Mrk 290) exhibit a single event or an occasional moderate change in the continuum, where the magnitude changes by mag. Single coherent variations like those seen at the beginning of the imaging campaign in NGC 4253 and Mrk 290 further emphasize the need for continuous daily monitoring lasting several months, even for objects expected to have short time lags. The remaining objects (Mrk 142, IC 4218, MCG-06-30-15, and IC 1198) display only small variations (as little as mag) in the continuum flux. In most cases, and are higher in the band than in the band, probably due to the larger host-galaxy contribution that remains in the band.
5.1.1 Contribution to the Variability from Broad Emission Lines
For the objects in our sample, the H and H emission lines contribute of order 10% to the measured AGN -band flux. The flux of both the broad H and H lines varies throughout the campaign, and thus some of the variability seen in the photometric -band light curve is due to the variability of the emission lines, and is not part of the continuum variability. For example, if the broad emission-line flux varies by 10%, we expect the effect of the broad emission-line variability on the variability of the photometric light curve to be small, of order 1%.
We estimated the size of this effect in Arp 151 by subtracting the H and H spectroscopic light curves (determined through the spectroscopic campaign; see Paper III for the H light curve) from the photometric -band light curve. Before performing the subtraction, we created a modified photometric light curve by averaging together all photometric AGN measurements taken on a single night, and removed measurements that were taken on nights when spectroscopic measurements were not made as well. We converted the photometric AGN measurements into flux units. We also scaled the H and H spectroscopic light curves so that the measurements would represent the integrated flux of the emission lines as measured through a Johnson -band filter. Finally, we subtracted the scaled H and H spectroscopic light curves from the modified photometric light curve, producing a light curve with variability that is independent of the H and H broad-line variability. We measured the variability characteristics of the resultant light curve, finding that and . These values can be compared to the variability characteristics, and , measured from the modified photometric light curve. This verifies that the effect of the emission-line variability on the variability of the photometric -band light curve is small, less than 1%. Since Arp 151 is one of the most highly variable objects in the sample, we expect the effect of emission-line variability on the variability of the photometric light curves to be smaller in the other objects. The broad-band filter contains a similar contribution of flux from the H line (about 6% for Arp 151) as the -band filter, so the emission-line variations will not contribute significantly to the -band photometric variability.
5.2. Cross-Correlation between - and -Band Light Curves
One of the possible mechanisms driving the optical continuum variability on short timescales is the reprocessing of higher energy continuum fluctuations, such as X-ray variations, within the accretion disk. The reprocessing scenario predicts that variations should be seen first at short wavelengths, since the short-wavelength emission originates from a region close to the nucleus, followed by variations at longer wavelengths, since the long-wavelength emission arises from portions of the accretion disk at larger radii. The time delay between the short- and long-wavelength variations corresponds to the light travel time between the emitting portions of the accretion disk. Another possibility is that fluctuations in the accretion disk drive the continuum variability. In this scenario, long-wavelength variations should precede short-wavelength variations as the disk fluctuations propagate inward on a viscous or thermal timescale. A number of studies have searched for time delays between X-ray and optical variations (e.g., Nandra et al. 1998; Maoz, Edelson, & Nandra 2000; Edelson et al. 2000; Suganuma et al. 2006; Arevalo et al. 2008; Breedt et al. 2009), optical and ultraviolet variations (e.g., Collier et al. 1998; Desroches et al. 2006), optical and near-infrared variations (e.g., Minezaki et al. 2004; Suganuma et al. 2006), and even between various optical bands or UV bands (e.g., Wanders et al. 1997; Sergeev et al. 2005; Doroshenko et al. 2005; Cackett, Horne, & Winkler 2007). The past work has found differing results. In some cases the variations seen at shorter wavelengths precede the fluctuations at longer wavelengths. However, the converse has also been observed, as well as no strong wavelength dependence, and a clear picture has yet to emerge.
For each of the objects in the sample, the variations in the - and -band light curves are well correlated, and we can search for a time delay between those variations. We measured the time delay relative to the -band light curve using the interpolation cross-correlation method (Gaskell & Sparke, 1986; Gaskell & Peterson, 1987) with the White & Peterson (1994) modifications, and found the lag at the cross-correlation function (CCF) peak () and the CCF centroid (). The CCF centroid is determined using points near the CCF peak () with the correlation coefficient greater than or equal to 0.8. We list the values for and , along with , for each of the objects in Table 8. The uncertainties were determined by using the Monte Carlo flux randomization/random subset sampling (FR/RSS) technique of Peterson et al. (1998, 2004). In Figure 19 we present the CCFs for each of the objects, as well as the -band autocorrelation function.
| Object | |||
|---|---|---|---|
| (days) | (days) | ||
| (1) | (2) | (3) | (4) |
| Mrk 142 | 0.85 | 0.01 | 0.00 |
| SBS1116+583A | 0.84 | 0.12 | 0.25 |
| Arp 151 | 0.99 | 0.50 | 0.25 |
| Mrk 1310 | 0.98 | 0.13 | 0.25 |
| Mrk 202 | 0.69 | 0.01 | 0.25 |
| NGC 4253 | 0.81 | 0.24 | 0.00 |
| NGC 4748 | 0.85 | 0.85 | -0.25 |
| IC 4218 | 0.75 | 0.26 | 0.25 |
| MCG-06-30-15 | 0.90 | 0.00 | 0.00 |
| NGC 5548 | 0.93 | 0.02 | 0.25 |
| Mrk 290 | 0.80 | 0.00 | 0.00 |
| IC 1198 | 0.78 | 0.12 | 0.25 |
| NGC 6814 | 0.99 | 0.25 | 0.00 |
Note. — Columns 2–4 list the peak value of the CCF, the position of the centroid of the CCF, and the position of the peak of the CCF.
We do not find significant positive or negative lags between the variations of the - and -band light curves for any of the objects in the sample. We measure both positive and negative lags that range up to a few tenths of a day, but these measurements all have ¡ 1 significance since they are well below our nightly sampling cadence, and hence are all consistent with zero lag. These results are not surprising since the and bands do not differ much in wavelength, and previous photometric monitoring campaigns (e.g., Sergeev et al. 2005) have found that lag times between and band variations are typically only a few tenths of a day. Due to the near-simultaneity of variations between optical bands and between optical and UV bands, past work has also disfavored variability models in which photometric variability results from disk instabilities that propagate inward at a speed much slower than the speed of light, and instead has favored a reprocessing scenario (e.g., Krolik et al. 1991, Edelson et al. 1996, Collier et al. 1998). Higher-frequency sampling is required to carry out a more definitive search for time lags between variations in different optical bands.

5.3. Color Variability
In addition to searching for time delays between variations in the and bands, we use the light curves to measure colors. Since we employed a simple method of galaxy subtraction (§4.3) which did not account for a bulge component, the color represents the color of the AGN and some portion of the host galaxy. We present the results for all of the objects in Figure 20.

We find that the color ranges from mag to mag. There is no convincing evidence for color variability, with the exception of Arp 151, Mrk 1310, and NGC 6814. The color varied from a maximum of 0.6 mag to a minimum of 0.4 mag for Arp 151, from mag to mag for Mrk 1310, and from mag to mag for NGC 6814. In each case, as the AGN became fainter the color became redder. The simplest explanation for this trend is that some of the host-galaxy starlight remains in the - and -band light curves, which is the result of not properly accounting for the bulge component. Therefore, as the AGN becomes fainter, the host-galaxy contamination becomes more significant, resulting in a redder color. The effect will be most obvious for the highly variable objects, such as Arp 151, Mrk 1310, and NGC 6814. The color variability seen in these objects shows the limitations of our simple host-galaxy subtraction method.
Work by Sakata et al. (2009) further explores color variability in a sample of bright, highly variable Seyfert 1 galaxies using well-sampled data from MAGNUM spanning seven years. They found that the optical spectral shape is independent of flux variations. Also, Woo et al. (2007) studied a sample of moderate-luminosity AGNs and found that the spectral shape remains the same on weekly timescales over a rest-frame wavelength range of 2800–5200 Å. The results found by Sakata et al. (2009) and Woo et al. (2007) are consistent with the constant colors found for our lower luminosity sample, and further supports our interpretation that the color variability seen in Arp 151, Mrk 1310, and NGC 6814 is the result of a residual host-galaxy contribution.
6. Conclusions
As part of the Lick AGN Monitoring Project, aimed at extending the number of black hole mass measurements below M⊙, we have carried out an imaging campaign in order to generate continuum light curves for the 13 nearby Seyfert 1 galaxies in our sample. We used relative aperture photometry to measure the flux variability of the AGNs compared to several nearby stars. We attempted a simple host-galaxy starlight subtraction by removing a constant offset from each flux measurement based on an exponential model of the galaxy disk. More complete host-galaxy subtraction requires higher resolution images in order to disentangle the bulge component from the nucleus, which we will do using future HST observations. These AGN continuum light curves are compared to H emission-line light curves in Paper III and other optical recombination lines in Bentz et al. (2009c) to measure BLR sizes and black hole masses.
There is a wide range of variability in our sample of 13 AGNs. About a third of the objects (notably Arp 151, Mrk 1310, NGC 5548, and NGC 6814) exhibit large variations in both the - and -band light curves throughout most of the campaign. Many of the objects, however, show a single event or an occasional moderate change in the continuum level. Other objects (Mrk 142, IC 4218, MCG-06-30-15, and IC 1198) show very little change in the continuum flux.
We do not find convincing evidence of a measurable time lag between the - and -band light curves for any of the objects in the sample. For all but the most variable objects, we found no significant variations in the color. We attribute the color variability that is seen in Arp 151, Mrk 1310, and NGC 6814 to incomplete host-galaxy subtraction.
In addition to the comparison of these AGN continuum light curves to the H emission-line light curves and the HST program to quantify the amount of host galaxy starlight, future work will compare the AGN continuum light curves to other emission-line light curves, such as H, H, and He II in order to determine time lags and black hole masses. With the measured black hole masses, we will place the objects in the sample on the and the relationships. Since MAGNUM has the capability of simultaneously obtaining optical and near-infrared images, for Mrk 1310, MCG-06, NGC 5548, and NGC 6814 we have near-infrared images in addition to the optical images. Future work will use the near-infrared and optical continuum light curves to learn more about the size and structure of the dust torus of AGNs. Finally, future work will investigate whether a structure function analysis can be used to determine characteristic timescales of variability for these objects.
References
- Aretxaga & Terlevich (1994) Aretxaga, I., & Terlevich, R. 1994, MNRAS, 269, 462
- Arevalo et al. (2008) Arevalo, P., Uttley, P., Kaspi, S., Breedt, E., Lira, P., & McHardy, I. M. 2008, MNRAS, 389, 1479
- Bauer et al. (2009) Bauer, A., Baltay, C., Coppi, P., Ellman, N., Jerke, J., Rabinowitz, D., & Scalzo, R. 2009, ApJ, 696, 1241
- Bentz et al. (2006) Bentz, M. C., Peterson, B. M., Pogge, R. W., Vestergaard, M., & Oken, C. A. 2006a, ApJ, 644, 133
- Bentz et al. (2007) Bentz, M. C., et al. 2007, ApJ, 662, 205
- Bentz et al. (2008) Bentz, M. C., et al. 2008, ApJ, 689, L21 (Paper I)
- Bentz et al. (2009a) Bentz, M. C., Peterson, B. M., Netzer, H., Pogge, R. W., & Vestergaard, M. 2009a, ApJ, 697, 160
- Bentz et al. (2009b) Bentz, M. C., et al. 2009b, accepted for publication in ApJ, astro-ph/0908.0003 (Paper III)
- Bentz et al. (2009c) Bentz, M. C., et al. 2009c, in preparation
- Blandford & McKee (1982) Blandford, R. D., & McKee, C. F. 1982, ApJ, 255, 419
- Breedt et al. (2009) Breedt, E., et al. 2009, MNRAS, 394, 427
- Cackett, Horne, & Winkler (2007) Cackett, E. M., Horne, K, & Winkler, H. 2007, MNRAS, 380, 669
- Cenko et al. (2006) Cenko, S. B., et al. 2006, PASP, 118, 1396
- Collier et al. (1998) Collier, S. J., et al. 1998, ApJ, 500, 162
- Cristiani, Vio, & Andreani (1990) Cristiani, S., Vio, R., & Andreani, P. 1990, AJ, 100, 56
- Cristiani et al. (1997) Cristiani, S., Trentini, S., La Franca, F., & Andreani, P. 1997, A&A, 321 123
- Cutri et al. (1985) Cutri, R. M., Wisniewski, W. Z., Rieke, G. H., & Lebofsky, M. J. 1985, ApJ, 296, 423
- Desroches et al. (2006) Desroches, L.-B., et al. 2006, ApJ, 650, 88
- di Clemente et al. (1996) di Clemente, A., Giallongo, E., Natali, G., Trevese, D., & Vagnetti, F. 1996, ApJ, 463, 466
- Doroshenko et al. (2005) Doroshenko, V. T., Sergeev, S. G., Merkulova, N. I., Sergeeva, E. A., & Golubinsky, Y. V. 2005, A&A, 437, 87
- Edelson et al. (1996) Edelson, R. A., et al. 1996, ApJ, 470, 364
- Edelson et al. (2000) Edelson, R., et al. 2000, ApJ, 534, 180
- Filippenko et al. (2001) Filippenko, A. V., Li, W. D., Treffers, R. R., & Modjaz, M. 2001, in ASP Conf. Ser. 246, Small-Telescope Astronomy on Global Scales, ed. W. P. Chen, C. Lemme, & B. Paczyński (San Francisco: ASP), 121
- Gaskell & Sparke (1986) Gaskell, C. M., & Sparke, L. S. 1986, ApJ, 305, 175
- Gaskell & Peterson (1987) Gaskell, C. M., & Peterson, B. M. 1987, ApJS, 65, 1
- Giveon et al. (1999) Giveon, U., Maoz, D., Kaspi, S., Netzer, H., & Smith, P. S. 1999, MNRAS, 306, 637
- Greene & Ho (2007) Greene, J. E., & Ho, L. C. 2007, ApJ, 670, 92
- Hawkins (1993) Hawkins, M. R. S. 1993, Nature, 366, 242
- Hook et al. (1994) Hook, I. M., McMahon, R. G., Boyle, B. J., & Irwin, M. J. 1994, MNRAS, 268, 305
- Howell (1989) Howell, S. B. 1989, PASP, 101, 616
- Kaspi et al. (2000) Kaspi, S., Smith, P. S., Netzer, H., Maoz, D., Jannuzi, B. T., & Giveon, U. 2000, ApJ, 533, 631
- Kaspi et al. (2005) Kaspi, S., Maoz, D., Netzer, H., Peterson, B M., Vestergaard, M., & Jannuzi, B. T. 2005, ApJ, 629, 61
- Klimek et al. (2004) Klimek, E. S., Gaskell, M., & Hedrick, C. H. 2004, ApJ, 609, 69
- Kobayashi et al. (1998a) Kobayashi, Y., Yoshii, Y., Peterson, B. A., Minezaki, T., Enya, K., Suganuma, M., & Yamamuro, T. 1998a, Proc. SPIE, 3354, 769
- Kobayashi et al. (1998b) Kobayashi, Y., et al. 1998b, in Proc. SPIE, 3352, 120
- Koratkar & Gaskell (1991) Koratkar, A. P., & Gaskell, C. M. 1991, ApJ, 370, L61
- Krolik et al. (1991) Krolik, J. H., Horne, K., Kallman, T. R., Malkan, M. A., Edelson, R. A., & Kriss, G. A. 1991, ApJ, 371, 541
- Landolt (1992) Landolt, A. U. 1992, AJ, 104, 340
- Li & Cao (2008) Li, S. L. & Cao, X. 2008, MNRAS, 387, 41L
- Maoz, Edelson, & Nandra (2000) Maoz, D., Edelson, R., & Nandra, K. 2000, AJ, 119, 119
- Minezaki et al. (2004) Minezaki, T., Yoshii, Y., Kobayahi, Y., Enya, K., Suganuma, M., Tomita, H., Aoki, T., & Peterson, B. A. 2004, ApJ, 600, L35
- Nandra et al. (1998) Nandra, K., Clavel, J., Edelson, R. A., George, I. M., Malkan, M. A., Mushotzky, R. F., Peterson, B. M., & Turner, T. J 1998, ApJ, 505, 594
- Onken et al. (2004) Onken, C A., Ferrarese, L., Merritt, D., Peterson, B. M., Pogge, R. W., Vestergaard, M., & Wandel, A. 2004, ApJ, 615, 645
- Peng et al. (2002) Peng, C. Y., Ho, L. C., Impey, C. D., & Rix, H.-W. 2002, AJ, 124, 266
- Peterson (1993) Peterson, B. M. 1993, PASP, 105, 247
- Peterson (1997) Peterson, B. M. 1997, An Introduction to Active Galactic Nuclei (Cambridge: Cambridge Univ. Press)
- Peterson et al. (1998) Peterson, B. M., et al. 1998, ApJ, 501, 82
- Peterson et al. (2004) Peterson, B. M., et al. 2004, ApJ, 613, 682
- Peterson et al. (2005) Peterson, B. M., et al. 2005, ApJ, 632, 799
- Rodriguez-Pascual et al. (1997) Rodriguez-Pascual, P. M., et al. 1997, ApJS, 110, 9
- Sakata et al. (2009) Sakata, Y., et al. 2009, ApJ, submitted
- Schlegel et al. (1998) Schlegel, D. J., Finkbeiner, D. P., & Davis, M. 1998, ApJ, 500, 525
- Sergeev et al. (2005) Sergeev, S. G., Doroshenko, V. T., Golubinsky, Y. V., Merkulova, N. I., & Sergeeva, E. A. 2005, ApJ, 622, 129
- Suganuma et al. (2006) Suganuma, M., et al. 2006, ApJ, 639, 46
- Terlevich et al. (1992) Terlevich, R. J., Tenorio-Tagle, G., Franco, J, & Boyle, B. J. 1992, MNRAS, 225, 713
- Torricelli-Ciamponi et al. (2000) Torricelli-Ciamponi, G., Foellmi, C., Courvoisier, T. J.-L., & Paltani, S. 2000, A&A, 358, 57
- Trevese et al. (1994) Trevese, D, Kron, R. G., Majewski, S. R., Bershady, M. A., & Koo, D. C. 1994, ApJ, 433, 494
- van Dokkum (2001) van Dokkum, P. G. 2001, PASP, 113, 1420
- Vanden Berk et al. (2004) Vanden Berk, D. E., et al. 2004, ApJ, 601, 692
- Wanders et al. (1997) Wanders, I., et al. 1997, ApJS, 113, 69
- White & Peterson (1994) White, R. J., & Peterson, B. M. 1994, PASP, 106, 879
- Wilhite et al. (2008) Wilhite, B. C., Brunner, R. J., Grier, C. J., Schneider, D. P., & Vanden Berk, D. E. 2008, MNRAS, 383, 1232
- Wold et al. (2007) Wold, M., Brotherton, M. S., & Shang, Z. 2007, MNRAS, 375, 989
- Woo et al. (2007) Woo, J.-H., Treu, T., Malkan, M. A., Ferry, M. A., & Misch, T. 2007, ApJ, 661, 60
- Yoshii (2002) Yoshii, Y. 2002, in New Trends in Theoretical and Observational Cosmology, ed. K. Sato & T. Shiromizu (Tokyo: Universal Academy Press), 235