119–126
Membership Probability via Control Field
Colour-Magnitude Decontamination
Abstract
The open clusters’ fundamental physical parameters are important tools to understand the formation and evolution of the Galactic disk and as grounding tests for star formation and evolution models. However only a small fraction of the known open clusters in the Milky Way has precise determination of distance, reddening, age, metallicity, radial velocity and proper motion. One of the major problems in determining these parameters lies on the difficulty to separate cluster members from field stars and to assign membership. We propose a decontamination method by employing 2MASS data in the encircling region of the clusters NGC1981, NGC2516, NGC6494 and M11. We present a decontaminated CMD of these objects showing the membership probabilities and structural parameters as derived from King profile fitting.
keywords:
Galaxy: open clusters and associations, methods: data analysisIntroduction
Despite the large number of known open clusters many of them have been discovered recently and have not been studied in detail or do not have their parameters determined (DAML02 - Dias et al., 2002; Mermilliod, 1995; Kharchenko et al., 2005). Sky surveys like 2MASS (Skrutskie et al., 2006) produced large amounts of near-IR data and have contributed to the discovery of even more objects.
The determination of the fundamental parameters of open clusters provide important tools to the investigation of the Galactic disk and star formation models. However, contamination by field-stars and strong reddening severely hamper the detection and characterization of clusters, specially towards the Galactic plane or the Galactic center.
We devised a method to remove the field-star contamination on colour-magnitude diagrams (CMD) by sampling the population from a nearby control field and then removing it from the cluster’s CMD. The 2MASS catalog was selected owing to its whole sky coverage and freedom to extract data from spatially unlimited regions. Also, near-IR wavelengths are particularly sensitive to discriminate cluster stars from the contaminating field for young stellar systems (e.g., Santos Jr. et al., 2005).
Data
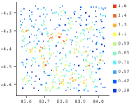
Vizier (http://vizier.u-strasbg.fr/viz-bin/VizieR) was used to extract near-infrared photometric data from 2MASS in circular fields centered on objects NGC 1981, NGC 2516, NGC 6494 and M 11; with the clusters’ center coordinates taken from DAML02. The data comply with the 2MASS Level 1 Requirement (namely , mag.) and was extracted within 30 arcmin of the cluster’s center coordinates.
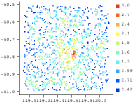
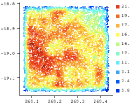
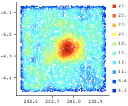
Comparison fields were selected for the targets with the same area of the cluster data and similar reddening, as deduced from near-infrared (2MASS) and mid-infrared (IRAS) images. NGC 1981 comparison field was extracted 1 deg. northwest due to the southward nebulosity associated with NGC 1977. For the remaining targets circular annular fields centered in the cluster were used. Figure 1 compares spatial density profiles for the targets built from raw data and the decontaminated subsample, discussed below.
New Center Determination
Precise determination of the clusters’ central coordinates is an essential step before a reasonable radial density profile can be obtained. Catalogued center values are mainly intended for identification purposes and generally imprecise. Therefore, we have estimated the center of the targets by first selecting a region around the coordinates given by DAML02. Furthermore the selected region was divided in bins of right ascension and declination and star counts were made inside them. We used these star counts to build spatial profiles and fit a gaussian function to the star’s distribution on RA and DEC. The center coordinates were initially taken as the center of the fitted gaussian.
This procedure was applied to different bin sizes and the corresponding center coordinates were used to create histograms showing the most recurrent RA and DEC. No trends were found between the coordinates and bin size and we adopted these most recurrent values as the new center coordinates of the cluster. Table 1 show the results of the applied method.
| Center Determination | King profile parameters | |||||
|---|---|---|---|---|---|---|
| Cluster | ||||||
| NGC1981 | +05h 35m 07.9s | -04∘ 20′ 34 | 3.57′ | 2.61 (0.3) | 1.0 (0.2) | 0.51 (0.05) |
| NGC2516 | +07h 57m 42.0s | -60∘ 43′ 22.8′′ | 3.35′ | 14.9 (2.0) | 0.5 (0.1) | 0.95 (0.07) |
| NGC6494 | +17h 56m 37.7s | -19∘ 00′ 32.4′′ | 5.49′ | 17.8 (0.8) | 2.9 (0.2) | 10.7 (0.4) |
| M11 | +18h 51m 02.2s | -06∘ 15′ 32.4′′ | 0.71′ | 42.9 (2.5) | 2.1 (0.2) | 4.0 (1.3) |
Membership Probability Assignment
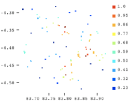
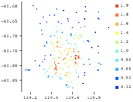
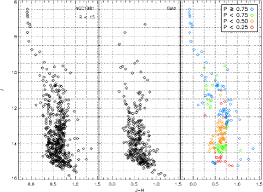
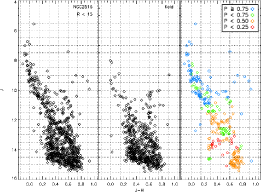
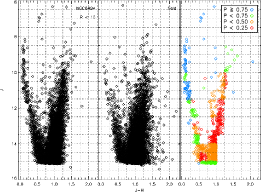
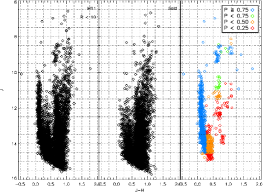
For membership assignment we built CMDs for both cluster and field stars and divided the diagrams into small cells in and axes. The cells are small enough to detect local variations of field-star contamination on the various sequences in the CMD, but large enough to accommodate a significant number of stars. Typical cell sizes are mag. and mag., with dense clusters accepting smaller cells while the sparse ones requiring larger ones. Membership probabilities are assigned to cluster’s stars within each cell based on the overdensity of cluster stars with relation to the field stars, according to the relation . Null probability was assigned whenever an excess of field stars over cluster stars occurred in a given cell.
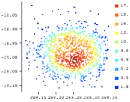
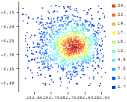
For the decontamination of the CMD, a subset of the original cluster sample was created by removing from each cell in the cluster’s CMD, the expected number of field stars as measured in the control field CMD. Stars where removed based on their distance to the center of the cluster, and cells without cluster overdensity had all stars inside their limits removed. We will refer to this final subsample as clean subsample hereafter. Fig. 1 shows the spatial density profiles of the targets using the raw data and the clean subsample. Fig. 2 shows the cluster, field and clean CMD for the target clusters.
Radial Density Profile
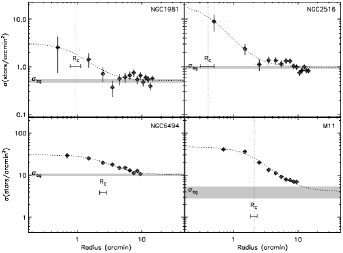
In order to probe the spatial profile and derive structural properties of the targets, radial density profiles (RDP) were built by counting stars inside rings of one arcmin width, centered in the cluster and then dividing by the area of the ring. King profile fitting used the modified function , as introduced in King (1962). Fig. 3 shows RDP around the new center coordinates for the target clusters using the clean subsample.
Table 1 shows the central surface density , core radius and background surface density , with their respective uncertainties, for the decontaminated samples. The values found for M 11 agree, within the uncertainties, to those determined by Santos Jr. et al. (2005).
Conclusion
By removing stars similar to the field population in the cluster region, the method effectively leaves the final subsample of stars less contaminated by the background. Additionally it provides membership probabilities for all cluster stars, removing stars with null probability from the sample. This subsample allows for a much better defined cluster sequences in the CMD, providing good conditions for subsequent isochrone fitting and more accurate values for cluster’s parameters, as can be clearly seen in Fig. 1 and Fig. 2.
References
- Bonatto et al. (2006) Bonatto, C., Santos Jr., J. F. C., & Bica, E. 2006, A&A, 445, 567
- Dias et al. (2002) Dias, W. S., Alessi, B. S., Moitinho, A., & Lepine, J. R. D. 2002, A&A, 389, 871
- Kharchenko et al. (2005) Kharchenko, N. V., Piskunov, A. E., Röser, S., et al. 2005, A&A, 438, 1163
- King (1962) King, I. 1962, AJ, 67, 471
- Mermilliod (1995) Mermilliod, J.-C. 1995, Information & On-Line Data in Astronomy, 203, 127
- Santos Jr. et al. (2005) Santos Jr., J. F. C., Bonatto, C., & Bica 2005, A&A, 442, 201
- Skrutskie et al. (2006) Skrutskie, M. F., Cutri, R. M., Stiening, R., et al. 2006, AJ, 131, 1163