Himansu Sahoo on behalf of the Belle Collaboration
Department of Physics and Astronomy, University of Hawaii, Honolulu, HI 96822, USA
himansu@phys.hawaii.edu
Abstract
In this proceeding, we discuss recent results on exclusive radiative
meson decays from the Belle Collaboration. These decays are sensitive
to right-handed currents from New Physics. In particular, we measure
time-dependent violation parameters in and
decays, using high-statistics data samples collected
at the
resonance with the Belle detector at the KEKB
asymmetric-energy collider. With the present statistics,
these measurements are consistent with the standard model predictions.
We also search for the radiative decay
and report the first observation with a significance of ,
including systematic uncertainties.
I Introduction
Rare radiative decays of B mesons play an important role in the
search for physics
beyond the standard model (SM) of electroweak interactions.
These flavor changing neutral current decays are
forbidden at tree level in the SM, but allowed through the
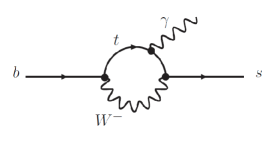
electroweak penguin processes as in Fig. 1.
Hence, they are sensitive to non-SM particles mediating the loop
(for example, charged Higgs or SUSY particles), which could
affect either the branching fraction or violation.
Figure 1:
Feynman diagram for the radiative decays,
showing the SM loop process with the -quark contribution.
In the SM, the photon emitted from a
() meson in the radiative decays,
is predominantly right-handed (left-handed). Therefore, the
polarization of the photon carries information on the original
flavor and the time-dependent asymmetry is suppressed
by the quark mass ratio () ags1 .
In several models beyond the SM, the photon acquires an appreciable
right-handed component due to the exchange of a virtual heavy
fermion in the loop process,
resulting in large values of mixing-induced asymmetries.
The same argument holds in any multibody final states
, where and are
charge-conjugate states ags2
(e.g., , ) conj .
A non-zero value of asymmetry will
be a clear hint of new physics.
II Experimental Apparatus
The Belle detector is a large-solid-angle magnetic
spectrometer that consists of a silicon vertex detector (SVD),
a 50-layer central drift chamber (CDC), an array of
aerogel threshold Cherenkov counters (ACC),
a barrel-like arrangement of time-of-flight
scintillation counters (TOF), and an electromagnetic calorimeter (ECL)
comprised of CsI(Tl) crystals located inside
a superconducting solenoid coil that provides a 1.5 T
magnetic field. An iron flux-return located outside
the coil is instrumented to detect mesons and to identify
muons (KLM). The detector is described in detail elsewhere Belle .
Two different inner detector configurations were used.
For the first sample
of pairs, a 2.0 cm radius beampipe
and a 3-layer silicon vertex detector (SVD1) were used;
for the latter samples,
a 1.5 cm radius beampipe, a 4-layer silicon detector (SVD2),
and a small-cell inner drift chamber were used.
III Analysis Technique
At the KEKB asymmetric-energy (3.5 on 8.0 GeV)
collider kekb , the is produced with a Lorentz
boost of nearly along the axis, which
is defined as opposite to the beam direction.
In the decay chain
,
where one of the mesons decays at time
to a final state , which
is our signal mode, and the other decays at time
to a final state that distinguishes between
and , the decay
rate has a time dependence given by
(1)
Here and are the
-violation parameters,
is the neutral lifetime,
is the mass difference
between the two neutral mass eigenstates,
,
and the -flavor charge equals ()
when the tagging meson is identified as
().
Since the and are approximately
at rest in the center-of-mass system (cms),
can be determined from the displacement in
between the and
decay vertices: ,
where is the speed of light.
III.1 Flavor Tagging and Vertex Reconstruction
The flavor of the accompanying meson is identified
by a tagging algorithm tag that categorizes
charged leptons, kaons, and
baryons found in the event.
The algorithm returns two parameters: the
-flavor charge , and , which
measures the tag quality
and varies from for no flavor discrimination to
for unambiguous flavor assignment.
If , the accompanying meson provides negligible
tagging information and we set the wrong tag probability to 0.5.
Events with are divided into six intervals.
The wrong tag fractions for the six intervals,
() and possible differences in
between and
decays () are determined using
high-statistics control samples of semi-leptonic
and hadronic decays belle_cc ; belle_b2s .
The vertex position of the signal-side decay
is reconstructed from the trajectory in
and from the daughters of the in mode,
with a constraint on the interaction point.
The tracks are required to have enough hits in the SVD for vertexing.
The tag-side vertex is determined from well reconstructed
tracks that are not assigned to the signal side.
We determine and
by performing
an unbinned maximum-likelihood (UML) fit to the observed
distribution.
The likelihood function is
(2)
where the product includes all events in the fit.
The probability density function (PDF) is given by
(3)
where runs over the signal and all background components.
The fractions of each component () depend on the region
and are calculated on an event-by-event basis as a function of the
fitted variable. is the resolution function and
is a broad Gaussian function that
represents an outlier component with a small fraction .
The only free parameters in the final fit are and
, which are determined by maximizing the likelihood
function given by Eq. 2.
We define the raw asymmetry in each bin by
, where
is the number of observed candidates with .
IV Time-dependent Analysis of
This analysis is done in Belle using
pairs ushiroda-kspi0gamma .
Since the time-dependent asymmetry
is not expected to change significantly as a
function of invariant mass,
we perform two measurements:
one for
by requiring to
lie in the range
,
and the other for
the full range of below .
The primary signature of these type of decays is the
high energy prompt photon.
They are selected from isolated ECL clusters,
with center-of-mass (cms)
energy in the range to GeV.
The polar angle of the photon direction in the laboratory frame is
restricted
to the barrel region of the ECL () for SVD1 data, but is extended to
the end-cap regions ()
for SVD2 data due to the reduced material in front of the ECL.
The selected photon candidates are required to be consistent with
isolated electromagnetic showers, i.e., of the
energy in an array of
CsI(Tl) crystals should be concentrated in
an array of crystals and
should have no charged tracks associated with it.
We also remove photons from ()
using a likelihood function described in Ref. pi0etaveto .
Neutral kaons () are reconstructed from two
oppositely charged pions
that have an invariant mass within of
the mass. Neutral pions () are formed from
two photons with an
invariant mass within of the mass.
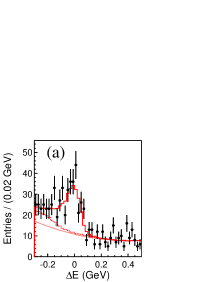
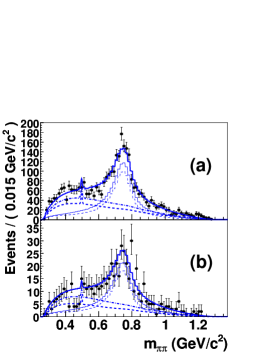
Figure 2:
(a) distribution within the signal slice
and (b) distribution within the
signal slice for the
whole region. Points with error bars are data.
The solid curves show the fit results. The dotted curves show the
background contributions,
while the dashed curves show the sum
of and background contributions.
The candidates are identified using
two kinematic variables: the energy difference
and the
beam-energy-constrained mass
,
where is the beam energy in the cms, and
and are the cms energy and momentum,
respectively, of the reconstructed candidate.
The signal region in and , which is used for the
measurements of -violating parameters,
is defined as and
.
After all selections are
applied, we obtain
candidates in the - fit region,
of which are in the signal box.
The signal yield is obtained from an
UML fit to
the - distribution as shown
in Fig. 2.
Figure 3
shows the distributions of the events with
for and and the raw asymmetry.
The violation parameters for for the full
invariant mass region
as well as for the mass region around
are summarized in Table 1.
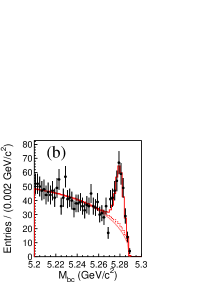
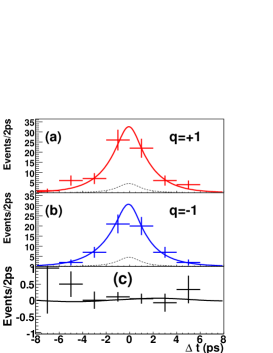
Figure 3:
(Top) Proper time distributions for
for (left) and (right) with .
The solid curve shows the total and dashed curve shows
the signal component.
(Bottom) Asymmetry in each bin with .
The solid curve shows the result of the UML fit.
V Time-dependent Analysis of
The first measurement of time-dependent
asymmetry in mode was performed by
Belle using
pairs lijin-ksrhogamma .
The advantage of this mode is that the decay vertex
can be reconstructed from two charged pions from the decays,
thus avoiding the complications and efficiency loss
from vertexing. The expected has opposite sign
to that of .
The signal is reconstructed in the decay
with and .
The selection criteria for high energy prompt photon and
neutral kaons are same
as those described in section IV,
except the photons are required
to lie in the barrel region of the ECL and the
invariant mass should be within
of its nominal mass.
We also reconstruct the decay to
study the system and to serve as a control sample.
The and
invariant masses are required to be less than 1.8 GeV/.
The candidates are selected
from the sample by requiring the
invariant mass to lie in the region,
.
Since the is wide, other modes that are not self-conjugate,
such as may also contribute.
Therefore, we first measure the effective -violating
parameters, and
, using the final sample
and then convert them to the -violating parameters
of using a dilution factor ,
described in Ref. lijin-ksrhogamma .
The signal is extracted from an
UML fit to the distribution
as shown in Fig. 4.
The requirement
is applied.
We obtain 299 events in the signal
region after vertexing.
Out of these we find a signal of events
with a fraction of 6.0% self-cross-feed (SCF),
continuum, along with 7.8 ,
21.5 other , and 9.0 events.
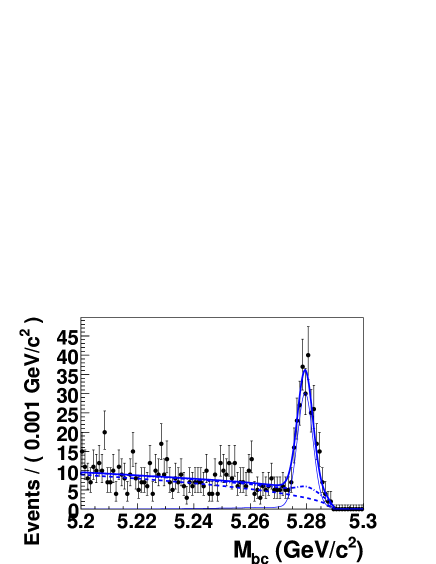
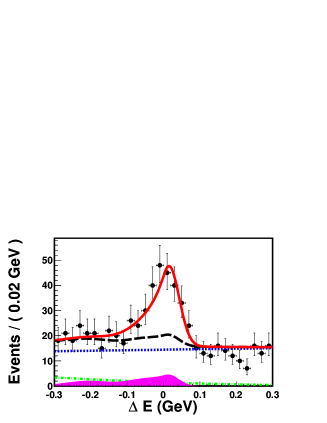
Figure 4:
distributions for
events.
Points with error bars are data. The curves show the results
from the dependent fit.
The dashed and dash-dotted curves are the and all background.
The thin curve is the total signal including SCF and the thick curve
is the total PDF.
We obtain
and
from an
UML fit to the
observed distribution.
The parameter
is related to for
with a dilution factor ,
that depends on the components and
allows for interference:
(4)
where are photon-helicity averaged amplitudes for
and
,
respectively.
The factors , distinguish between
and
. The phase space integral is over
the region.
We measure the dilution factor
to be from the charged mode
using a combination of various kaonic resonances with spin
to model the system.
By combining it with , we obtain
. The fits to the observed
distributions and the raw asymmetry are shown in the
Fig. 5.
The fit results are summarized in Table 1.
Figure 6 shows
the distributions for the spectrum.
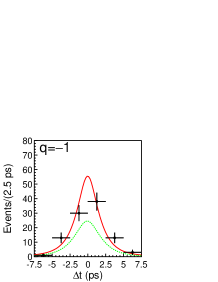
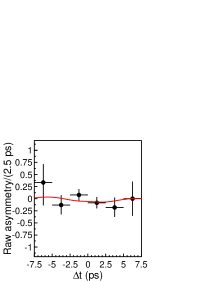
Figure 5:
Fit projections on the distributions with
(a)
and (b) for events with . The solid curves are the
fit while the dashed curves show the background contributions.
The raw asymmetry as a function of is shown in (c)
with a fit curve superimposed.Figure 6:
distributions for
(a) and
(b) .
The curves follow the convention in Fig. 4.
The thin dashed curve is the correctly reconstructed
signal.
Table 1: Results of the fits to the distributions.
The first errors are statistical and the second errors are systematic.
Decay Mode
VI First Observation of decay
This decay mode has advantages similar to
in the search for new physics.
Here the decay vertex can be reconstructed from the two
charged kaons from the decay.
The branching fractions for the charged mode
and an upper limit on the neutral mode have
already been reported
by the Belle alex_prl using
pairs.
We search for the neutral mode using the full data sample,
nearly eight times larger than was used in
our previous measurement and report the first observation with a
significance of .
The signal is reconstructed in the decay
and , with
and .
The invariant mass of the candidates is required to be within
,
where denotes the world-average mass pdg .
The selection criteria for the high energy prompt photon and
neutral kaons are the same
as those described in section IV,
except the photons are required
to lie in the barrel region and
the invariant mass of the combinations
has to be in the range 0.482 GeV/ GeV/.
The candidates are selected with a requirement
and
.
We define the signal region as
and
.
The dominant background is from the
continuum process, which is
suppressed by a requirement on likelihood ratio
from event shape variables and
the flight direction. In the mode,
some backgrounds from decays, like
, and
peak in the distribution.
We remove these backgrounds by applying
a veto on the invariant mass.
The non-resonant background ,
which peaks in the
- signal region, is estimated
using the mass sideband in data.
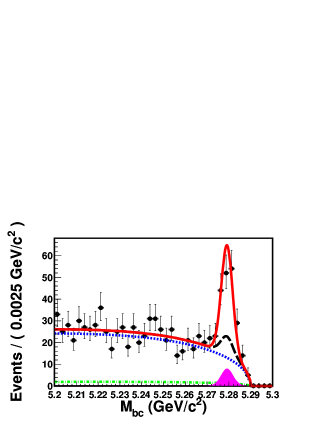
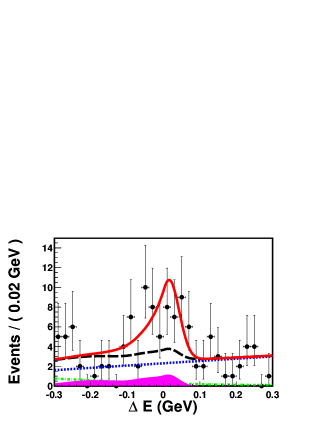
The signal yield is obtained from an extended
UML fit to the two-dimensional
- distribution. The projections of the
fit results into and are shown in
Fig. 7 and the fit results are summarized in
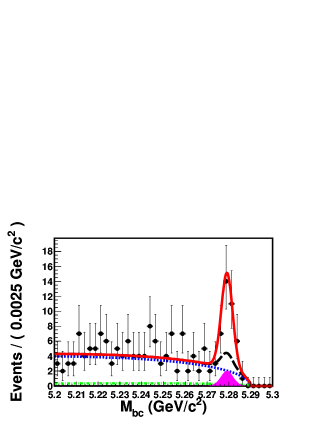
Table 2. The fit yields a signal of
() and () candidates.
The signal in the charged mode has a significance of
, whereas that for the neutral mode is ,
including systematic uncertainties.
Table 2: The signal yields (), corrected efficiencies (),
branching fractions () and significances ()
for the and decay modes.
Mode
()
()
()
Figure 7: The and projections
for (upper) and (lower).
The points with error bars represent the data. The different curves
show the total fit function (solid, red),
total background function (long-dashed, black),
continuum component (dotted, blue),
the component (dashed-dotted, green)
the non-resonant component as well as other charmless
backgrounds (filled histogram, magenta).
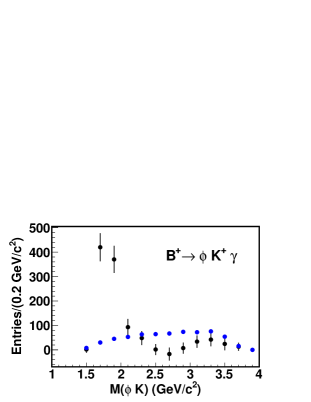
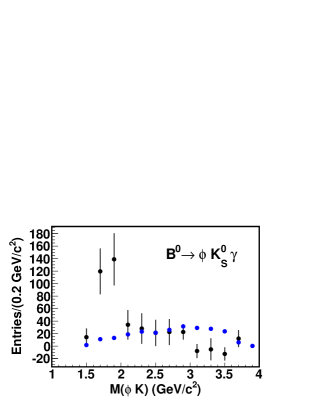
We also search for a possible contribution from
kaonic resonances decaying to .
To unfold the distribution,
we subtract all possible backgrounds and correct the
invariant mass for the efficiency.
The background-subtracted and efficiency-corrected
distributions are shown in Fig. 8.
Nearly of the signal events are concentrated
in the low-mass region ( GeV/).
It is clear that the observed
mass spectrum differs significantly from that expected in a
three-body phase-space decay.
Figure 8: The background-subtracted and efficiency-corrected
mass distributions for
(upper) and (lower).
The points with error bars represent the data. The
yield in each bin is obtained by the fitting procedure
described in the text. The three-body phase-space model from
the MC simulation is shown by the circles (blue).
VII Summary
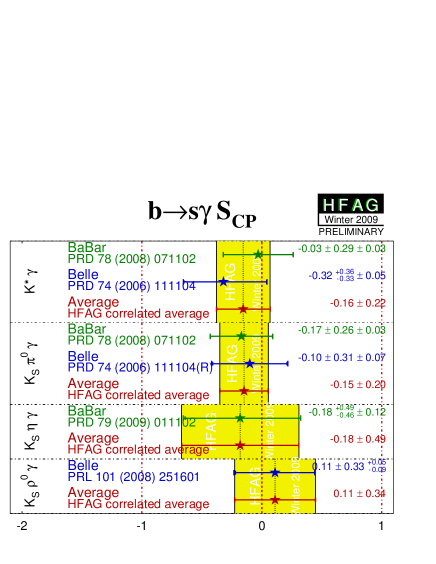
Figure 9: Summary of Belle and BaBar measurements of .
In summary, we report the first observation of radiative
decays in Belle using a data sample of
pairs. The observed signal yield is
() with a significance of
including systematic uncertainties.
We also precisely measure the branching fraction
with a significance of .
The signal events are mostly concentrated at low mass,
which is similar to a two-body radiative decay.
We report the measurements of time-dependent
violation parameters in and
decays, using and
pairs, respectively.
The Heavy Flavor Averaging Group (HFAG) hfag
summary of the measurements of the parameter
in modes by the Belle and BaBar is shown in
Figure 9.
With the present statistics,
these measurements are consistent with the
standard model predictions and
there is no indication of New Physics from right-handed
currents in radiative decays.
The neutral mode has enough statistics
for a future measurement of time-dependent violation.
More luminosity is necessary for a precise test of the SM.
Acknowledgements.
We thank the KEKB group for excellent operation of the
accelerator, the KEK cryogenics group for efficient solenoid
operations, and the KEK computer group and
the NII for valuable computing and SINET3 network support.
We acknowledge support from MEXT, JSPS and Nagoya’s TLPRC (Japan);
ARC and DIISR (Australia); NSFC (China);
DST (India); MEST, KOSEF, KRF (Korea); MNiSW (Poland);
MES and RFAAE (Russia); ARRS (Slovenia); SNSF (Switzerland);
NSC and MOE (Taiwan); and DOE (USA).
References
(1)
D. Atwood, M. Gronau and A. Soni, Phys. Rev. Lett. 79, 185 (1997).
(2)
D. Atwood, T. Gershon, M. Hazumi and A. Soni, Phys. Rev. D 71, 076003 (2005).
(3)
Throughout this paper, the inclusion of the charge-conjugate
decay mode is implied unless otherwise stated.
(4)
A. Abashian et al. (Belle Collaboration),
Nucl. Instrum. Methods Phys. Res., Sect. A 479, 117 (2002).
(5)
S. Kurokawa and E. Kikutani, Nucl. Instrum. Methods Phys. Res., Sect. A
499, 1 (2003), and other papers included in this volume.
(6)
H. Kakuno et al.,
Nucl. Instrum. Methods Phys. Res., Sect. A
533, 516 (2004).
(7)
K. Abe et al. (Belle Collaboration),
Phys. Rev. D 71, 072003 (2005).
(8)
K-F. Chen et al. (Belle Collaboration), Phys. Rev. D 72,
012004 (2005).
(9)
Y. Ushiroda et al. (Belle Collaboration), Phys. Rev. D 74, 111104(R) (2006).
(10)
P. Koppenburg et al. (Belle Collaboration), Phys. Rev. Lett. 93, 061803 (2004).
(11)
J. Li et al. (Belle Collaboration), Phys. Rev. Lett. 101, 251601 (2008).
(12)
A. Drutskoy et al. (Belle Collaboration), Phys. Rev. Lett. 92, 051801 (2004).
(13)
C. Amsler, et al., Physics Letters B 667, 1 (2008).
(14)
Heavy Flavor Averaging Group, winter 2009 update.
Check their webpage for updated results: http://www.slac.stanford.edu/xorg/hfag/.