XMM-Newton detection of a transient X-ray source in the vicinity of V838 Monocerotis
Abstract
We report the XMM-Newton/EPIC detection in 2008 March of a luminous (), variable X-ray source in the vicinity (within ) of the enigmatic star V838 Mon, which underwent a spectacular outburst in early 2002. Spectral modeling of the XMM-Newton X-ray source indicates the presence of two plasma components with characteristic temperatures of K and K, attenuated by an absorbing column ( cm-2) that is consistent with the visual extinction measured toward V838 Mon (). No such luminous source was detected in the immediate vicinity of V838 Mon in Chandra/ACIS-S observations obtained about one year after outburst or, most recently, in 2010 January. The two XMM source spectral components appear to be marginally spatially resolved, with the spatial centroid of the hard component lying closer to (within of) the position of V838 Mon than the broad-band source or the soft source component; however, if there are two sources at or near V838 Mon, the Chandra nondetections would imply that both of them are variable. An alternative is that there is a single variable source, and that the apparent spatial separation may actually be due to photon-counting statistics or is perhaps instrumental in origin. We consider constraints placed by the X-ray detection and nondetections on a stellar merger model for the 2002 V838 Mon outburst, in which the spun-up merger product drives a powerful magnetic dynamo. Alternatively, the transient behavior of the X-ray source could indicate that the X-rays arose as a consequence of an interaction between V838 Mon’s ejecta and its early-type (B3 V) companion.
Subject headings:
stars: supergiants, stars: novae, stars: individual: V838 Mon, stars: mass-loss1. introduction
V838 Mon is one of the most enigmatic and unusual objects observed in stellar astrophysics in recent decades. It was discovered undergoing an outburst at the beginning of 2002 January (Brown et al., 2002). About a month later, its brightness suddenly increased further, reaching a luminosity of (Crause et al., 2003) based on a distance of (Sparks et al., 2008). Although initially believed to be a nova, V838 Mon rapidly developed distinctly non-nova-like characteristics. In particular, the spectral evolution clearly showed many peculiar features not reconcilable with any classical model of stellar eruption (Wagner et al., 2002; Wagner & Starrfield, 2002; Rushton et al., 2005). Similar objects include the luminous red variable M31 RV in the bulge of the Andromeda galaxy (Rich et al. 1989; Bond & Siegel 2006 and references therein), and V4332 Sgr (Hayashi et al., 1994; Martini et al., 1999); hereafter, we refer to these objects as a single class, called “V838 Mon types” (Tylenda & Soker, 2006). Only in the case of V838 Mon, however, has the evolution after outburst been well documented by observations, including Hubble Space Telescope (HST) imaging of its spectacular system of light echoes (Bond et al., 2003, 2007).
After a phase of maximum luminosity, where their spectra resemble A-F giants or supergiants, V838 Mon types move on the HR diagram at roughly constant luminosity and decreasing effective temperature, reaching spectral type M0, after which the luminosity rapidly declines. In the cases of M31 RV, V4332 Sgr and V838 Mon, an order of magnitude drop in the luminosity was reached after , , and days (Mould et al., 1990; Tylenda et al., 2005; Tylenda, 2005), respectively. At the same time, the objects reach their minimum effective temperature and a maximum photospheric radius of . The subsequent evolution proceeds toward lower luminosity and photospheric radius with a slow increase in effective temperature. At the end of this evolution the V838 Mon types appear to be late M stars (Tylenda et al., 2005; Kimeswenger, 2006; Munari et al., 2007a; Kamiński et al., 2009) or L supergiants (Evans et al., 2003).
Various scenarios have been proposed to explain the nature of V838 Mon types. The main contending scenarios are: (i) a merger between two main-sequence stars (Soker & Tylenda, 2003); (ii) a nova-like mechanism involving a thermonuclear runaway on an accreting white dwarf (Iben & Tutukov, 1992); and (iii) a He shell flash within a post-asymptotic giant branch (post-AGB) star (Lawlor, 2005) . Tylenda & Soker (2006) discussed these different scenarios, arguing that the basic characteristics of the V838 Mon eruption are most consistently explained by a stellar merger.
The peculiar evolution of V838 Mon types after the observed stellar outburst provides evidence against a thermonuclear runaway. In a classical-nova event, the rapidly expanding ejecta quickly become transparent, exposing a very hot central source; thus the remnant evolves very quickly to the blue. By contrast, V838 Mon and similar objects have evolved to very low effective temperatures and have become extremely red.
In the He flash mechanism, the runaway process occurs in the He-burning shell of an asymptotic giant branch (AGB) or post-AGB star. Here the expected typical increase in luminosity is a factor of 2-3 during the phase of a thermal pulse (Wood & Zarro, 1981; Herwig, 2000) — much less than the variation observed in V838 Mon types.
In the case of a stellar merger, if we consider the total energy released during the V838 Mon eruption, a main-sequence star would have to accrete a mass of M⊙ on a time scale of months. The discovery of an unresolved stellar companion of spectral type B3 V (Desidera & Munari, 2002; Munari et al., 2002) as well as a small cluster of B stars in the vicinity of V838 Mon (Afşar & Bond, 2007) implies that V838 Mon itself has an age Myr and, furthermore, would require that the system was a triple star, prior to merger. Accordingly, Tylenda & Soker (2006) showed that the V838 Mon progenitor could be a M⊙ main-sequence star devouring a pre-main-sequence star.
If V838 Mon was initially comprised of a triple stellar system, the companion would be expected to play an important role in the dynamics of any stellar merger and collision. Resonance interactions (e.g., the Kozai mechanism Perets and Fabrycky 2009, Antonini et al. 2010 and references therein) between the three bodies could efficiently shrink the inner binary. Furthermore, the youth of V838 Mon implied by the presence of a B3-type companion as well as its membership in a young cluster argues against any nova-like outburst model, since a white dwarf would not have enough time to form, accrete material, and then erupt in a nova-like event.
If the V838 Mon outburst was caused by the merger of two stars, then there is reason to expect that V838 Mon might eventually become a luminous X-ray source. Soker & Tylenda (2007) proposed that the rapidly rotating merger product should become increasingly magnetically active over a period of a few years after outburst. This post-merger magnetic activity would be due to a large convective region in the extended envelope of the merger product, which is expected to rotate fast, giving rise to an efficient stellar dynamo. Given the strong empirical connection between stellar surface magnetic flux and X-ray emission (e.g., Pevtsov et al. 2003), one would therefore expect V838 Mon to be an X-ray source, under the stellar merger scenario. Furthermore, the peak X-ray flux from this magnetically governed, post-merger phase should lag well behind that of the initial, gravitationally driven optical/IR eruption. On the other hand, such a “delayed” appearance of X-ray emission might also be consistent with interactions between the expanding matter ejected from V838 Mon and its B3 V companion (Goranskij et al., 2008; Bond, 2009).
To determine whether the V838 Mon outburst resulted in X-ray emission, we obtained a long-exposure (Ks) X-ray observation of the region surrounding V838 Mon with the European Photon imaging Camera (EPIC) instrument on board the XMM-Newton observatory. We compared these XMM results, obtained years after the V838 Mon outburst, with those obtained by the Chandra X-ray Observatory about one year after outburst , at which time no bright X-ray source was apparent at the position of V838 Mon (Orio et al., 2003), as well as with a very recent (2010 January) Chandra Director’s Discretionary Time (DDT) observation obtained subsequent to submission of this paper. We discuss the implications of our findings on physical models for the optical/IR outburst of V838 Mon.
2. Data and Analysis
2.1. 2008 XMM-Newton Observation
V838 Mon was observed by XMM-Newton (ObsID 0500240201) during XMM Revolution 1515, starting on 2008 March 17 at 15:52:37 UT for a total of 110.6, 115.5, and 115.5 ks in prime full window imaging mode with the medium filter on the EPIC p-type/n-type semiconductor camera (pn) and Metal Oxide Semi-conductor CCD arrays (MOS1 and MOS2), respectively. We processed these data with the XMM-Newton SAS package, version 7.1.0, and Current Calibration File Release 241 (XMM-CCF-REL-241). We filtered out high-background periods and bad events from all observations using standard filters for imaging mode observations. The resulting net exposure times are 70.3, 97.8, and 98.2 ks, in the pn, MOS1, and MOS2 arrays, respectively.
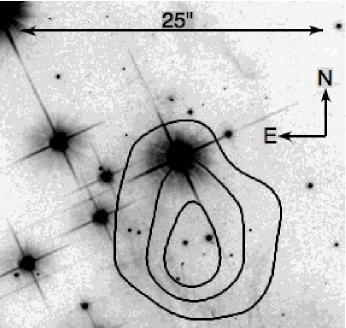
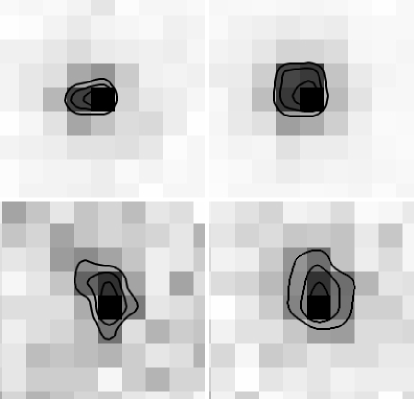
The central region of the resulting, broad-band ( keV) XMM/EPIC (pn+MOS1+MOS2) image of the V838 Mon field is overlaid on an HST image in Fig. 1. This overlay shows that X-ray emission is detected very near (within of) the position of V838 Mon, in the XMM/EPIC image. Although located nearly on-axis, the X-ray emission source(s) appears somewhat elongated, such that although the centroid is displaced from V838 Mon itself, the lower-level X-ray contours overlap its position. Fig. 2 compares the morphology of the detected source overlapping V838 Mon with that of the point source HD 102195 (Kashyap et al., 2008). This star was observed at a position on the EPIC detectors similar to that of V838 Mon, and its X-ray spectral energy distribution is similar to that of the V838 Mon source. The comparison shows that the broad-band source overlapping V838 Mon’s position appears marginally extended and asymmetric with respect to the XMM/pn and XMM/MOS1 PSFs (as the MOS2 detector’s PSF is somewhat poorer than those of MOS1 and pn, this image is not shown). It is worth noting, however, that the source extension, although apparent to the eye, is not significantly larger than the pn detector’s relatively broad PSF ( FWHM , HEW ).
To ascertain the accuracy of the absolute astrometry in the XMM observation and the likelihood of a chance association of an X-ray source with V838 Mon, we performed source detection on the EPIC/pn image. We correlated the list of X-ray sources detected in the full (0.5–10 keV) energy range of the XMM observation against the optical/IR USNO NOMAD source list (Zacharias et al., 2004). Within the () XMM/pn field there is no apparent systematic shift in the correlated NOMAD sources that lie within of an X-ray source. The vast majority (%) of these NOMAD sources lie within of an XMM source, although 20 sources exhibit larger () displacements. Among the EPIC/pn sources, sources have detected counts ( times the photon detection uncertainty of the composite source near V838 Mon), for a source density of per sq arcmin. Hence, the probability that the PSF of a random field source would overlap the position of V838 Mon is .
2.1.1 Spectral Analysis
To investigate the nature of the X-ray source overlapping the position of V838 Mon, we extracted source spectra from the three EPIC detectors using a circular region with a radius and centered on the coordinates of V838 Mon. Background spectra were extracted from regions near the X-ray emission, located on the same chip of the relevant detector, avoiding any apparent background sources, and with a total area on the sky of . We created target-specific response matrix files (RMFs) and ancillary response files (ARFs) using the tasks rmfgen and arfgen and binned the spectrum to a minimum of 25 counts per bin. The mean background-subtracted count rates in the background subtracted spectra are , , and in the pn, MOS1, and MOS2 observations, respectively. There was variation during the XMM exposure, however, such that the count rates were a factor larger than these mean values early in the observation and % smaller late in the observation (§2.1.3).

We simultaneously fit the spectra in XSPEC (ver. 12.3.1; Arnaud 1996) using models consisting of optically thin, collisional thermal plasma emission (raymond, Raymond & Smith 1977) suffering intervening absorption (wabs, Morrison & McCammon 1983). The spectrum is reasonably well matched (reduced ) using either single-component or two-component plasma models. We find, however, that the absorbing column necessary to achieve acceptable fits using a single-component model, cm-2, is too small to be compatible with the optical/IR extinction measured toward V838 Mon (see below). Hence, given that the XMM source is much more likely to be associated with V838 Mon than a random (i.e. foreground) field star (§3.1), the single-component model appears inadequate.
The best-fit two-component model (Fig. 3) is comprised of a “hot” plasma in the range and a ”cooler” plasma in the range , observed through intervening absorbing column densities in the ranges and , respectively (90% confidence ranges). Although the best fit does not tightly constrain these resulting values of intervening absorbing column, the 90% confidence ranges of for each wabs model component are consistent with each other and with the range of values toward V838 Mon reported in the literature, i.e., (Kimeswenger et al., 2002; Munari et al., 2005; Afşar & Bond, 2007). The observed X-ray fluxes for the hard and soft spectral components are and , respectively. The unabsorbed (intrinsic) X-ray fluxes are and . Hence, the hard component has an X-ray luminosity of and the soft component has an X-ray luminosity of , where the adopted distance of kpc is that inferred for V838 Mon by Sparks et al. (2008).
2.1.2 Broad-Band vs. Energy-Filtered Source Centroids
The need for two components to adequately model the EPIC spectra of the X-ray emission near V838 Mon (Fig. 3), combined with the apparent elongation of this X-ray emission (Fig. 1 and 2), is suggestive of the potential presence of two spatial components in this source. Since the peak emission is keV, for our spatial analysis we mainly concentrate on the EPIC pn data, as the pn detector is most sensitive at these energies and has the added benefit that its PSF, though broader than MOS1 or MOS2, is the most symmetric of the three EPIC detectors (Fig. 2 111See also: ). Based on the energy ranges spanned by the two spectral components in the composite model (Fig. 3), we created energy filtered images in the energy ranges 0.5 to 1.3 keV and 1.3 to 10 keV in an attempt to spatially distinguish the two thermal plasma components.
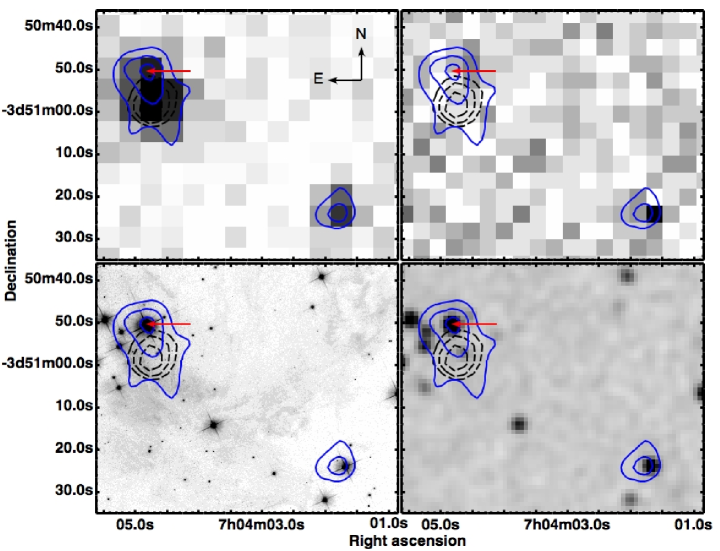
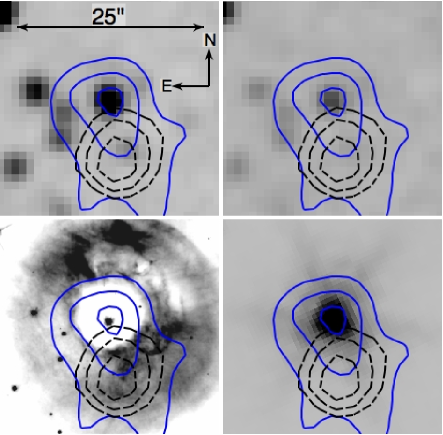
We find that these energy filters appear to separate the V838 Mon “source” into two distinct spatial distributions of X-ray emission (Fig. 4, upper left panel); similar energy-filtered images of HD102195 do not show such separation. The overlays of energy-specific X-ray emission contours of the soft and hard V838 Mon sources on HST and 2MASS images in Fig. 4 (lower panels) and 2MASS, HST, and Spitzer images in Fig. 5 indicate that the hard X-ray flux is coincident with the position of V838 Mon to within the relative astrometric accuracy of the XMM-Newton and 2MASS J-band images, whereas the soft X-ray flux — like the elongated, broad-band source itself — appears to lie a few arcsec south of V838 Mon. If distinct, these two sources evidently are not well resolved; their centroids appear to be separated by less than the FWHM of the pn PSF.
In order to compare the position of the broad-band X-ray source with that of V838 Mon, as well as to test for the presence of two distinct spatial components, source detection was performed independently on the V838 Mon X-ray source within broad (0.3–10 keV), soft (0.3–1.2 keV), and hard (1.5–10 keV) energy bands. Table 1 lists the positions of the broad-band, soft, and hard source centroids as well as their positional uncertainties and separation from V838 Mon. The results indicate that the hard-band emission emanates from within of the position of V838 Mon, i.e., that the hard-band source is coincident with V838 Mon to within the respective (centroiding and astrometric) positional uncertainties. The broad-band and soft-band centroids lie to the south of V838 Mon, however, closer to (within of) the position of 2MASS point source J07040465-0350572 (which also appears as a faint star in the HST images). The displacement of these centroids from that of the hard-band source centroid as well as V838 Mon itself is well within the FWHM of the pn PSF, but is times larger than the centroiding and astrometric positional uncertainties.
An X-ray source located west-southwest of V838 Mon is coincident with the 2MASS point source J07040168-0351239 (Fig. 4, upper right panel). This object is the brightest of a handful of X-ray sources within of V838 Mon that are detected in the XMM/EPIC observation as well as in both (2003 and 2010) Chandra/ACIS-S observations ( see §2.2.2). The coincidence of this field X-ray source with the optical/IR 2MASS point source reinforces the astrometric registration of the XMM imaging.
2.1.3 X-ray Light Curve
| energy range | RA(J2000.0) | DEC(J2000.0) | uncertainty (′′) | offset (′′) |
|---|---|---|---|---|
| … | 07:04:04.85a | -03:50:51.1a | … | … |
| 0.5 - 1.2 keV | 07:04:04.71 | -03:50:56.9 | 0.5 | 6.2 |
| 1.5 - 10 keV | 07:04:04.79 | -03.50:52.9 | 1.2 | 2.1 |
| 0.5 - 10 keV | 07:04:04.71 | -03:50:56.5 | 0.5 | 5.8 |
| a) Brown et al. (2002) |
We extracted source and background X-ray light curves from the XMM-Newton EPIC pn observation, with a temporal bin size of 20 ks. We present the resulting background-subtracted light curve in Fig. 6. The ( radius) source region used to extract the light curve in Fig. 6 encompasses the broad-band X-ray source overlapping the position of V838 Mon and covers the full energy range of pn sensitivity (0.5–10 keV). Ignoring the last (highly uncertain) data point, the light curve displays a steady decline in X-ray flux from the source near V838 Mon over the duration of the observation. The declining X-ray flux may indicate that a flare occurred at or just before the beginning of the observation, although there is no statistically significant trend in the spectral hardness of the source with time. Due to the small number of source photons, we are also unable to establish whether there was a centroid shift during the observation, despite the marginal evidence for a displacement between the soft and hard source centroids (Table 1).

2.2. 2003 and 2010 Chandra Observations
2.2.1 2003 February
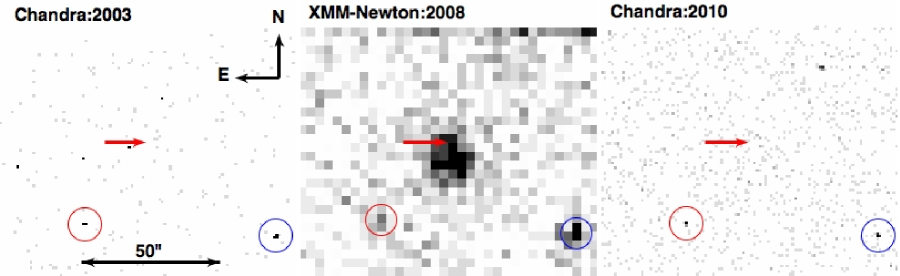
Our reanalysis of the 6.8 ks Chandra/ACIS-S observation of the field centered on V838 Mon obtained in Feb. 2003 confirms that no source was detected within of V838 Mon. This observation imposes a 3 count rate upper limit of ks-1 on any X-ray source within a radius of V838 Mon. Adopting the best-fit parameters for the hard and soft components deduced from XMM/EPIC spectral fitting (§2.1.1), this upper limit translates to a (3) upper limit of erg cm-2 s-1 for the observed (“absorbed”) flux from each of these components. Hence, the 2003 Chandra/ACIS-S exposure likely would have detected the V838 Mon source if its flux were at the levels found in the 2008 XMM/EPIC observation.
In support of the preceding assertion, we note that the observed flux measured for the only source detected by both the (2003) Chandra/ACIS-S and XMM/EPIC observations within the field displayed in Fig. 4 (i.e., the source located WSW of the composite V838 Mon source; Fig. 4, upper right panel) is found to be quite similar in the two observations (as well as in the 2010 Chandra exposure described below). Specifically, we estimate the 2003 and 2008 fluxes of this source as erg cm-2 s-1 and erg cm-2 s-1 (based on count rates of 1.0 ks-1 and 2.1 ks-1) as measured by Chandra/ACIS-S and XMM/EPIC, respectively.
2.2.2 2010 January
After submission of this paper, we obtained a further 24.47 ks DDT observation of V838 Mon with Chandra/ACIS-S on 2010 January 17 (ObsID 12009). The observation was performed in “faint” event data mode; the event data were subject to standard processing, calibration, and filters (via Chandra X-ray Center pipeline v8.2.1 and CALDB v4.1.5, respectively). The broad-band (0.5–10 keV) image (Fig. 7) reveals that no X-ray emission was detected within of V838 Mon’s position. This observation imposes a 3 ACIS-S count rate upper limit of ks-1 on any X-ray source(s) at the position of the source detected by XMM-Newton in 2008. Again adopting the best-fit parameters obtained from spectral fitting of the XMM/EPIC source (§2.1.1), we obtain a (3) upper limit of erg cm-2 s-1 for the observed (“absorbed”) flux from either the hard or soft spectral components. These limits correspond to upper limits on the unabsorbed X-ray fluxes of erg cm-2 s-1 for the hard component and erg cm-2 s-1 for the soft component, or X-ray luminosities of and , respectively.
3. Discussion
The detection by XMM-Newton in 2008 of a luminous (), time-varying X-ray source within a few arcsec of the position of V838 Mon (§2.1) — and the lack of detection of any source of such high luminosity in Chandra observations obtained years before and years after the XMM-Newton observation (§2.2) — strongly suggests that the eruption of V838 Mon left in its wake a luminous, transient X-ray source. In the discussion in §§4.2–4.3, we adopt this interpretation. However, we first address the possibility that the X-ray source is unrelated to V838 Mon and/or is a spatial composite.
3.1. A spatially offset and/or composite source near V838 Mon?
The spectral/spatial analysis described in §2.1.2 indicates that the broad-band X-ray source centroid exhibits a offset from the position of V838 Mon, somewhat larger than the offsets typical of correlated optical and X-ray sources in the XMM observation (§2.1). Hence, the source may be unrelated to V838 Mon. Furthermore, we find that there may have been two spatially and spectrally distinct sources of X-ray emission within of V838 Mon in 2008. However, we regard both results with suspicion.
First, it seems highly unlikely that any of the other random field stars within the source confusion region could have generated such strong and variable X-ray emission. As noted previously, the 2MASS source J07040465-0350572 would be most closely associated with the soft spectral component (if spatially distinct from the hard component). This 2MASS source could be a reddened, luminous ( ) late-type (K4) member of the V838 Mon cluster (Afşar & Bond, 2007; Bond & Afşar, 2007), on the basis of its visible/IR (HST/GSC2.3/DENIS/2MASS) magnitudes (, , , , , and ) and the visual extinction to V838 Mon itself (for which we adopt ; Munari et al. (2007a)). Its association with the soft X-ray component near V838 Mon would then imply that it is young and highly magnetically active. However, the X-ray luminosity inferred for the soft source, erg s-1, would be unusually large even for a flaring pre-main-sequence star, while its X-ray emission temperature would be unusually low for such an object. If this object is, instead, a foreground ( kpc) star suffering minimal interstellar extinction, it would be an M dwarf. Such stars do show strong X-ray flares — although the flare-to-quiescent flux ratio exhibited by the source near V838 Mon would be extreme for M flare stars (e.g., Smith, Guedel & Audard 2005).
More generally, the likelihood that two spatially distinct X-ray sources in such close proximity to each other could have appeared and disappeared synchronously is vanishingly small — as is the likelihood that a random field dwarf very close to the line of sight to V838 Mon should exhibit such a large flare. Furthermore, % of the XMM sources have offsets from their optical/IR counterparts that are similar to that between the XMM source near V838 Mon and V838 Mon itself.
Therefore, given the spectacular optical/IR behavior of V838 Mon since 2002, it seems instead far more logical to conclude that the source detected very near its position in 2008 by XMM-Newton consists of a single, spectrally complex and highly variable X-ray source associated with V838 Mon itself. We note that such an interpretation would require that the marginal hard-soft PSF offset measured in the XMM-Newton images (§2.1.2) is spurious, and is perhaps due to the decreasing signal to noise at higher energies (70% of the hard counts are attributed to the background while only 30% of the soft counts are attributed to the background). Alternatively, such a spurious offset could be instrumental in origin, although we are unaware of any instrumental effect that might have produced such a result.
3.2. The 2008 X-ray source at V838 Monocerotis: constraints on outburst models
Evidently, the X-ray source at V838 Mon is highly variable, on timescales ranging from hours (Fig. 6) to years (Fig. 7). Specifically, the XMM/EPIC light curve (Fig. 6) provides evidence that the source may have been undergoing a long-duration ( ks), energetic flare event, with a peak luminosity of and a significant hard ( K) component, during the 2008 March XMM/EPIC exposure. Meanwhile, the nondetection of the source by Chandra in 2010 January places a firm upper limit of on the level of “quiescent” emission from this source. We now consider these results in the context of the stellar merger model for the 2002 V838 Mon optical/IR outburst as proposed by Soker & Tylenda (2007).
As described in Soker & Tylenda (2007) the general relationship between stellar dynamo strength and X-ray luminosity is
| (1) |
with Rossby number () in the range and a constant depending on the stellar structure. For G giants (Gondoin, 2005) while in the case of main-sequence (MS) stars (Pizzolato et al., 2003). Pre-MS stars, instead, are in or near the saturated regime with typical (Preibish et al., 2005). Adopting conservative assumptions regarding the level of magnetic activity appropriate for giant stars, Soker & Tylenda (2007) showed that the maximum luminosity of X-ray emission from V838 Mon would be . If we instead adopt the scaling between and appropriate for main-sequence stars, the predicted peak becomes , while assuming the (saturation regime) scaling appropriate for pre-MS stars, the maximum would be between and 1035 erg s-1, adopting (Kamiński et al., 2009).
The conservative upper limit imposed on the “quiescent” level of X-ray emission by the 2010 Chandra observation, , would then imply that the putative V838 Mon merger remnant is well below the saturated regime, i.e., the remnant is not pre-MS-like in terms of its magnetic dynamo properties. On the other hand, the ratio of source in its flare-like state (in 2008) relative to that in its “quiescent” state (in 2003 and 2010), (flare)(quiescent), would seem to indicate that the putative merger has left V838 Mon in an state of extreme magnetic volatility resembling that of deeply embedded young stellar objects (Tsujimoto et al., 2005).
The Soker & Tylenda (2007) model also predicts that there should be a time lag between the merger event itself and the generation of a magnetic dynamo in the merger product (via spin-up of the envelope of the merger product) that is sufficiently energetic to produce an X-ray-bright corona, and that the phase of maximum luminosity is followed by a period of slow decline, with a characteristic time scale . The “delayed” appearance of an X-ray source at the position of V838 Mon (absent in 2003; present in 2008), taken at face value, might appear to offer early support for such a model. However, the disappearance of the X-ray source by early 2010 raises the possibility that the source may have displayed other strong but short-lived X-ray outbursts (such as the one detected by XMM-Newton) between the optical/IR outburst in 2002 and the first (2003 Chandra) X-ray observation of V838 Mon. So there is in fact no real constraint on the timing of the onset of strong, variable X-ray emission from V838 Mon. We conclude that one should be very cautious in interpreting the 2008 XMM source at V838 Mon as supporting (or refuting) the ”reborn dynamo” model.
On the other hand the detection of a transient X-ray source by XMM-Newton appears incompatible with He flash models for the V838 Mon outburst, as AGB stars are not associated with such luminous, variable X-ray sources (e.g., Kastner & Soker 2004a) unless such stars reside in binary systems involving transfer of AGB mass loss (e.g., Karovska et al. 2005).
3.3. An interaction with the B3 V companion?
One possible alternative to the merger scenario as a source of the X-ray source detected in 2008 is that of the interaction of the B3 V companion with ejecta from V838 Mon (Tylenda et al., 2009). In December 2006 the companion disappeared from the optical spectrum, only to reappear again in February 2007 (Munari et al., 2007b; Goranskij et al., 2008). The eclipse-like phenomenon followed by the strengthening of the emission line spectrum can be explained by the occultation of the B3 V companion by a dense cloud ejected in 2002 and crossing in late 2006 the stellar line of sight. The velocities of the expanding ejecta were measured to be in the range (Crause et al., 2003; Kipper et al., 2004; Geballe et al., 2007). Assuming an outflow velocity of (Tylenda, 2005), the time interval between the V838 Mon eruption and the onset of interactions between its ejecta and its B3 companion star indicates a binary separation of . Later, in September 2007, the star disappeared again due to its complete immersion into the massive cloud ejected during the 2002 outburst (Bond, 2009).
At the time of the first (2003) Chandra observation, therefore, interactions between V838 Mon ejecta and the B3 V companion had yet to occur, while by the time of the (2008) XMM observation the B3 V companion was being engulfed inside the expanding matter ejected by V838 Mon. Hence, the late (circa 2008 March) appearance of X-ray emission from V838 Mon could suggest the onset of ejecta-companion interactions, and the subsequent disappearance of the X-ray source by 2010 January might then indicate the cessation of such interactions.
Establishing the potential role of the B3 V star in the energetic emission detected by XMM in 2008 is beyond the scope of this paper. However, we note that such high X-ray luminosities cannot arise from the simple interactions of infalling matter with the matter above the stellar photosphere unless extreme accretion rates and infall velocities are involved. The latter would appear to be precluded by the main-sequence (as opposed to compact object) nature of the secondary (Shaviv & Starrfield, 1988). Hence other processes — such as magnetospheric (reconnection) events generated by the infalling gas or perhaps wind-wind collisions — would appear to be required, if the X-rays were generated via ejecta-companion interactions.
4. Summary and Conclusions
Our March 2008 XMM-Newton/EPIC observation of V838 Mon, obtained about six years after the spectacular eruption of this enigmatic star, reveals a luminous, variable X-ray source centered within of V838 Mon’s position. Spectral analysis of the XMM-Newton/EPIC X-ray source suggests that it consists of a relatively hard ( K), luminous ( erg s-1) component and a softer ( K) but more intrinsically luminous ( erg s-1) component. The absorbing columns inferred toward each of these components are similar ( cm-2) and are consistent with the visual extinction measured toward V838 Mon (). No X-ray source(s) of such luminosity was present at or near V838 Mon’s position during Chandra/ACIS-S observations obtained about one year after outburst (in 2003) or in 2010. The two XMM source spectral components appear to be marginally spatially resolved, with the spatial centroid of the hard component lying within of V838 Mon, but the Chandra nondetections indicate that the apparent spatial separation may be due to photon counting statistics or is perhaps instrumental in origin.
The inferred X-ray luminosity and large temperature range inferred for the transient X-ray source at V838 Mon, as well as its extreme variability, are consistent with a stellar merger scenario for the optical/IR outburst of V838 Mon, in which the X-ray emission arises as a consequence of an energetic magnetic dynamo induced in the envelope of the merger product. Alternatively, the delayed onset and subsequent disappearance of the luminous X-ray source near V838 Mon might be attributed to interactions between matter ejected during the 2002 outburst and V838 Mon’s early-type companion. Further X-ray observations are required to determine the nature of the X-ray emission detected on March 2008 in the vicinity of V838 Mon.
References
- Afşar & Bond (2007) Afşar, M. & Bond, H. E. 2007, AJ, 133, 387
- Antonini et al. (2010) Antonini, F., Faber, J., Gualandris, A., & Merritt, D. 2010, ApJ, 713, 90
- Arnaud (1996) Arnaud, K.A. 1996, Astronomical Data Analysis Software and Systems V, eds. Jacoby G. and Barnes J., p17, ASP Conf. Series volume 101
- Banerjee et al. (2006) Banerjee, D. P. K., Su, K. Y. L., Misselt, K. A., & Ashok, N. M. 2006, ApJ, 644, L57
- Bond (2009) Bond, H. E. 2009, BAAS, 214, 430.06
- Bond et al. (2003) Bond, H. E., et al. 2003, Nature, 422, 405
- Bond & Siegel (2006) Bond, H. E., & Siegel, M. H. 2006, AJ, 131, 984
- Bond et al. (2007) Bond, H. E., et al. 2007, in The Nature of V838 Mon and Its Light Echo, ed. R. L. M.
- Bond & Afşar (2007) Bond, H. E. & Afşar, M. 2007, ASPC, 363, 241
- Brown et al. (2002) Brown, N. J., Wagen, E. O., Scovil, C., Nelson P., Oksanen A., Solonen J., & Price A., 2002 IAUC Circ. 7785
- Crause et al. (2003) Crause, L., Lawson, W., Kilkenny, D., van Wyk, F., Marang, F., & Jones, A. 2003, MNRAS, 341, 785
- Desidera & Munari (2002) Desidera, S. & Munari, U. 2002, IAU Circ. 7982
- Evans et al. (2003) Evans, A., Geballe, T. R., Rushton, M. T., Smalley, B., van Loon, J. Th., Eyres, S. P. S., & Tyne, V. H. 2003, MNRAS,, 343, 1054
- Geballe et al. (2007) Geballe, T. R., Rushton, M. R., Eyres, S. P. S., Evans, A., van Loon, J. Th., & Smalley, B. 2007, A&A, 467, 269
- Gondoin (2005) Gondoin, P. 2005, A&A, 444, 531
- Goranskij et al. (2008) Goranskij, V., Zharova, A., Barsukova, E., Fabrika, S., & Valeev, A. 2008, arXiv:0810.1887
- Hayashi et al. (1994) Hayashi, S. S., Yamamoto, M., & Hirosawa, K. 1994, IAUC Circ. 5942
- Herwig (2000) Herwig, F. 2000, A&A, 360, 952
- Iben & Tutukov (1992) Iben, I. & Tutukov, A. V. 1992, ApJ, 389,369
- Kamiński et al. (2009) Kamiński, T., Schmidt, M., Tylenda, R., Konacki, M., & Gromadzki, M. 2009, ApJS, 182, 33
- Kashyap et al. (2008) Kashyap, V. L., Drake, J. J., & Saar, S. H. 2008, ApJ, 687, 1339
- Kastner & Soker (2004) Kastner, H. & Soker, N. 2004a, ApJ, 608, 978
- Kimeswenger (2006) Kimeswenger, S. 2006, AN, 327, 44
- Karovska et al. (2005) Karovska, M., Schlegel, E., Hack, W., Raymond, J. C., & Wood, B. E. 2005, ApJ, 623, L137
- Kimeswenger et al. (2002) Kimeswenger, S., Lederle, C., Schmeja, S., & Armsdorfer, B. 2002, MNRAS, 336, L43
- Kipper et al. (2004) Kipper, T., et al. 2004, A&A, 416, 1107
- Lawlor (2005) Lawlor, T. M. 2005, MNRAS, 361, 695
- Martini et al. (1999) Martini, P., Wagner, R. M., Tomaney, A., Rich, R. M., della Valle, M., & Hauschildt, P. H. 1999, AJ, 118, 1034
- Morrison & McCammon (1983) Morrison, R. & McCammon, D. 1983, ApJ, 270, 119
- Mould et al. (1990) Mould, J., et al. 1990, ApJ, 353, L35
- Munari et al. (2002) Munari, U., et al. 2002, A&A, 389L, 51
- Munari et al. (2005) Munari, U., et al. 2005, A&A, 434, 1107
- Munari et al. (2007a) Munari, U., Navasardyan, H., & Villanova, S. 2007a, ASPC, 363, 13
- Munari et al. (2007b) Munari, U. et al. 2007b, A&A 474, 585
- Orio et al. (2003) Orio, M., Starrfield, S. G., & Tepedenlegliolu, E. 2003, IAU Circ. 8110
- Perets & Fabrycky (2009) Perets, H. B. & Fabrycky, D. C. 2009, ApJ, 697, 1048
- Pevtsov et al. (2003) Pevtsov, A. A., Fisher, G. H., Acton, L. W., Longcope, D. W., Johns-Krull, C. M., Kankelborg, C. C., & Metcalf, T. R. 2003, ApJ, 598, 1387
- Pizzolato et al. (2003) Pizzolato, N., Maggio, A., Micela, G., Sciortino, S., & Ventura, P. 2003, A&A, 397, 147
- Preibish et al. (2005) Preibisch, T., et al. 2005, ApJ S. 160, 401
- Raymond & Smith (1977) Raymond, J. C., & Smith, B. W. 1977, ApJS, 37, 195
- Rich et al. (1989) Rich, R.M., Mould, J., Picard, A., Frogel, Jay, A., & Davies, R. 1989, ApJ, 341L, 51
- Rushton et al. (2005) Rushton, M. T., et al. 2005, MNRAS, 360, 1281
- Shaviv & Starrfield (1988) Shaviv, G. & Starrfield, S., 1988, ApJ, 335, 383
- Smith et al. (2005) Smith, K., Guedel, M., & Audard, M. 2005, A&A 436, 241
- Soker & Tylenda (2003) Soker, N. & Tylenda, R. 2003, ApJ, 582L, 105
- Soker & Tylenda (2006) Soker, N. & Tylenda, R. 2006, MNRAS, 373, 733
- Soker & Tylenda (2007) Soker, N. & Tylenda, R. 2007, MNRAS, 375, 909
- Sparks et al. (2008) Sparks, W. B. , et al. 2008, AJ, 135, 605
- Tsujimoto et al. (2005) Tsujimoto, M., Feigelson, E. D., Grosso, N., Micela, G., Tsuboi, Y., Favata, F., Shang, H. & Kastner, J. H. 2005, ApJS, 160, 503
- Tylenda et al. (2005) Tylenda, R., Crause, L., Górny, S. K., & Schmidt, M. R. 2005, A&A, 439, 651
- Tylenda (2005) Tylenda, R. 2005, A&A, 436, 1009
- Tylenda & Soker (2006) Tylenda, R. & Soker, N. 2006, A&A, 451, 2237
- Tylenda et al. (2009) Tylenda, R., Kaminski, T., & Schmidt, M. 2009, A&A, 503, 899
- Wagner et al. (2002) Wagner, R. M., Halpern, J. P., & Jackson, M. 2002, IAUC Circ. 7785
- Wagner & Starrfield (2002) Wagner, R. M. & Starrfield, S. G. 2002, IAUC Circ. 7992
- Wood & Zarro (1981) Wood, P. R. & Zarro, D. M. 1981, ApJ, 247, 247
- Zacharias et al. (2004) Zacharias, N., Monet, D. G., Levine, S. E., Urban, S. E., Gaume, R., & Wycoff, G. L. 2004, AAS, 205, 4815