A diode laser stabilization scheme for single ion spectroscopy
Abstract
We present a scheme for stabilizing multiple lasers at wavelengths between 795 and 866 nm to the same atomic reference line. A reference laser at 852 nm is stabilized to the Cs line using a Doppler-free frequency modulation technique. Through transfer cavities, four lasers are stabilized to the relevant atomic transitions in . The rms linewidth of a transfer-locked laser is measured to be 123 kHz with respect to an independent atomic reference, the Rb line. This stability is confirmed by the comparison of an excitation spectrum of a single ion to an eight-level Bloch equation model. The measured Allan variance of at 10 s demonstrates a high degree of stability for time scales up to 100 s.
I Introduction
Since the first preparation of a single trapped ion Neuhauser1980PRAv22p1137a , ion-trap experiments have become increasingly sophisticated. Ultra high precision spectroscopy has lead to single-ion frequency standards Diddams2001Sv293p825 ; Schmidt2005Sv309p749 and today the most accurate clock is based on single-ion spectroscopy Rosenband2008Sv319p1808 . Trapped ions have also developed into very promising candidates for the implementation of schemes of quantum computation, and universal gate operations Leibfried2003Nv422p412 ; Schmidt-Kaler2003Nv422p408 ; Home2006NJPv8p188 as well as quantum algorithms Chiaverini2004Nv432p602 ; Reichle2006Nv443p838 ; Brickman2005PRAv72p50306 have been demonstrated. In quantum communication, first building blocks of a quantum network have also been realized with ions Olmschenk2009Sv323p486 . Besides these applications, ions have proven to be textbook-like model systems to study fundamental questions in quantum optics and quantum mechanics Jost2009Nv459p683 .
In such experiments the ions are optically cooled and manipulated by laser light. Depending on the chosen ion and the desired application, the lasers have to be frequency-stabilized well below the typical frequencies involved such as the natural linewidth () of the optical transition that is to be driven, Zeeman splitting (), or the vibrational frequency in the trap (). Furthermore, data are typically collected over long periods of time, such as hours or even days, since experiments exhibit low count rates. A laser system used for single ion spectroscopy therefore faces the requirements of offering good frequency stability over both short and long periods of time.
In early experiments the choice of ion species was governed by the availability of laser sources, typically dye lasers, at the characteristic wavelengths of the ion. Technical progress and the availability of a broad spectrum of wavelengths has made robust and inexpensive diode lasers increasingly attractive. However, significant technical effort to frequency-stabilize these lasers has remained indispensable. A popular approach is to lock a laser to a passive cavity built from ultra-low expansion material and placed in a pressure-sealed container or in vacuum C.Raab1998APBv67p683 . This eliminates the extreme sensitivity of the cavity resonance to pressure changes due to the dependence of the refractive index of air Riedle1994RoSIv65p42 . Nevertheless such cavities are not totally drift free, they only minimize the drift of the laser frequency mostly caused by temperature fluctuations in the environment. Other approaches use scanning transfer cavities in combination with a stable HeNe reference laser. This technique is slow compared to others as it is limited by the scanning frequency of the cavity Matsubara2005JJoAPv44p229 . An open cavity transfer scheme combining active piezo and temperature stabilization of the cavity length has been used to build a difference frequency spectrometer Riedle1994RoSIv65p42 , whereby a custom-made pyrex cavity transfers the stability of a HeNe laser onto another laser with a cavity modulation technique.
A scheme similar to the one we will present here has been used for high-precision frequency measurements of the line of alkali atoms A.Banerjee2004ELv65p172 : a reference laser is locked to the Rb line by saturated absorption spectroscopy. Its 10 kHz linewidth is transferred to a second laser of the same type via an in-vacuum ring cavity. This second laser was then used to measure the absolute frequency of the Rb line using a second saturated absorption spectroscopy set-up. The ultimate but also cost-intensive solution for stable referencing is the use of recently developed frequency combs. In ultra high precision spectroscopy the use of frequency combs is becoming more and more common Maric2008PRAv77p32502 .
In this article we present a scheme for the stabilization of four diode lasers that are resonant with various transitions in . All four lasers are stabilized with respect to the crossover line (F=3 ) of atomic Cs using a Pound-Drever-Hall (PDH) transfer lock pound490 ; Drever1983APBv31p97 ; G.C.Bjorklund1983APBv32p145 . The scheme employs a reference laser at the Cs wavelength and open low-finesse transfer cavities built from inexpensive commercially available components that avoid the need of a vacuum container and ultra low expansion materials. A combined temperature and piezo length stabilization of the cavities is controlled by self-built locking electronics. In general this method can be readily transferred to any desired wavelength by an appropriate coating of the cavity mirrors.
II Stabilization scheme
The level scheme of and the four relevant transitions are displayed in figure 1.
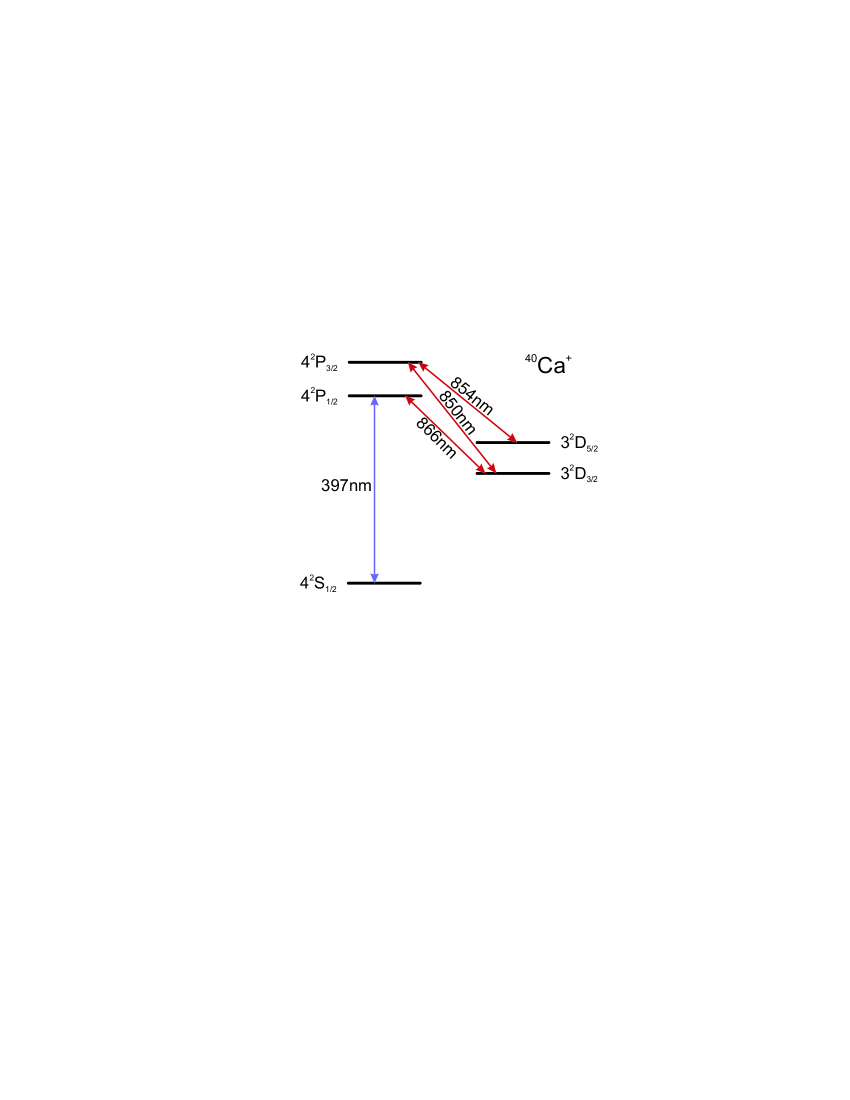
All lasers are commercial grating-stabilized diode lasers. The laser at 397nm is a frequency-doubled grating-stabilized diode laser. The four lasers are stabilized using the same stabilization scheme that consists of a series of consecutive PDH locks.
In this scheme, a reference laser at 852 nm is locked to the Cs D2 line using frequency modulation at 20 MHz in combination with Doppler-free absorption spectroscopy in a Cs vapor cell. The stability of this laser is transferred to the other lasers by the use of open length-stabilized low-finesse cavities (section III). Each transfer cavity is brought into resonance with both the reference laser and one of the lasers at the same time by temperature tuning. A PDH lock stabilizes the length of the cavity with respect to the reference laser. Each laser is then stabilized with another PDH lock to its respective transfer cavity. The advantage of this scheme is that not only the linewidth on a short time scale is reduced due to the lock to the cavity, but also long term drifts are eliminated due to the referencing to an atomic line.
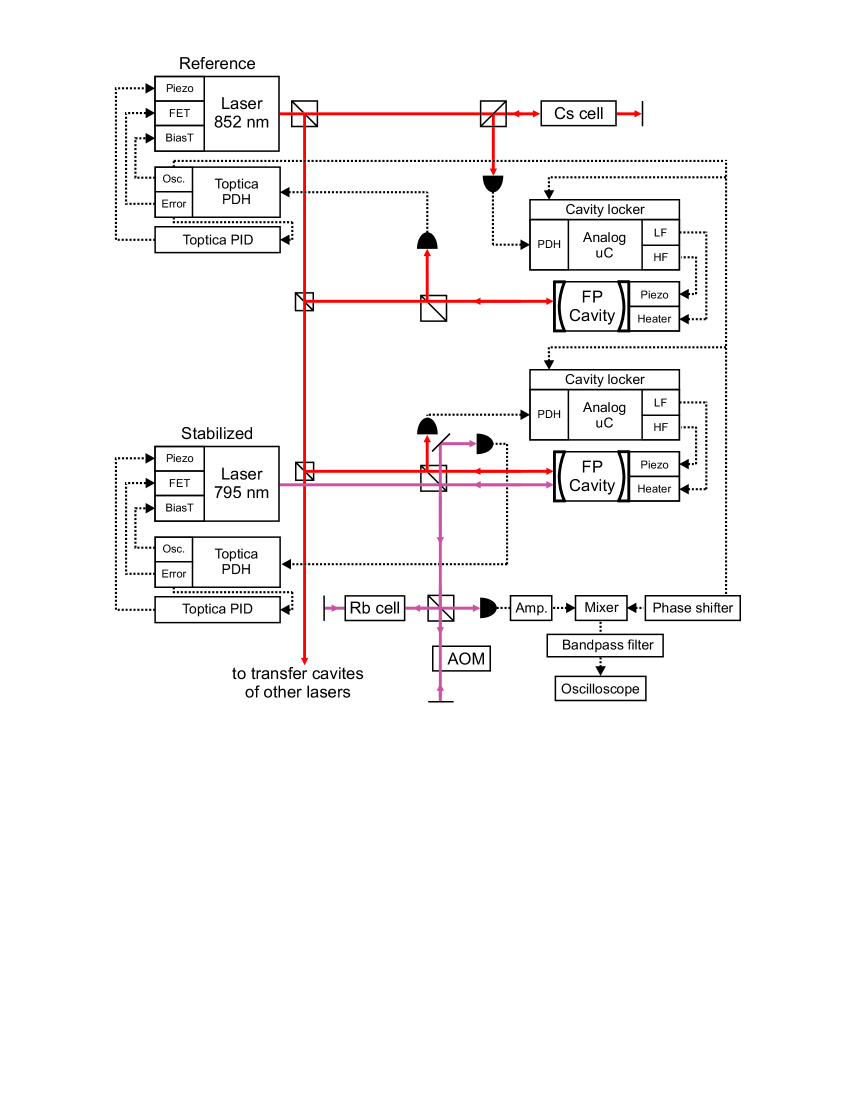
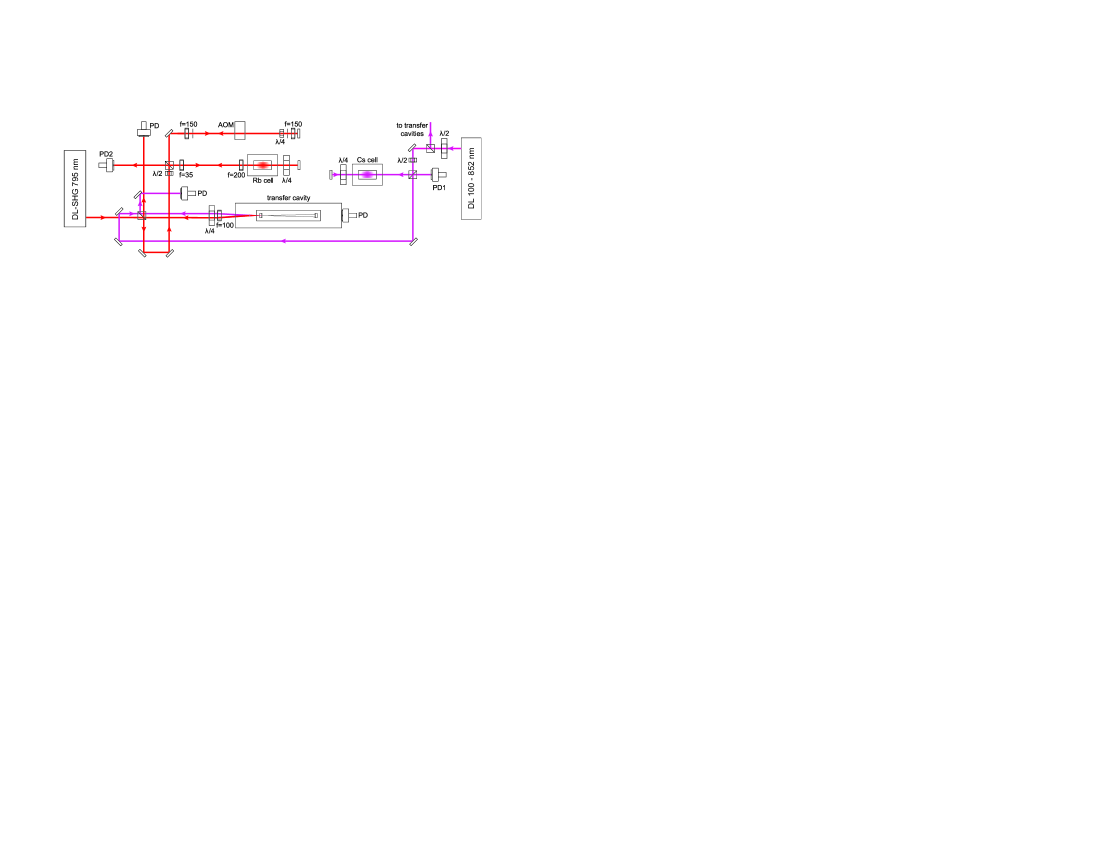
As an example, figure 2 shows a schematic of the locking chain for the 795 nm laser, the master laser for the 397 nm system. A beam splitter sends part of the 852 nm reference beam to a Cs vapor cell and the remaining power to the transfer cavities. The error signal derived from the saturated absorption spectroscopy on the Cs cell is fed back onto a piezo controlling the length of the first cavity via a self-built electronic device for stabilization called ”cavity locker” (section IV). The cavity locker has a PDH module that uses the 20 MHz oscillation signal from a current modulation of the reference laser to demodulate the absorption signal. A digitally implemented servo amplifier controls the piezo of the cavity. At the same time a low frequency regulation stabilizes the temperature via a heating wire. The error signal from the light reflected from this first cavity is used to stabilize the reference laser to this cavity with the help of commercial electronics.
The transfer cavity of the 795 nm laser is stabilized to the reference laser employing the error signal derived from the reflected 852 nm beam. A second cavity locker, again using the local oscillator of the reference laser for demodulation, feeds the signal back onto heater and piezo of the cavity. The 795 nm laser itself is stabilized to the transfer cavity via its reflection signal. The three other lasers are stabilized, by means of additional transfer cavities and cavity lockers, in exactly the same way.
In the following, we describe the relevant elements of the stabilization scheme in detail.
III Cavities
The confocal Fabry-Perot cavities are built from two mirrors 111Layertec () with 15 cm distance and have 500 MHz free spectral range. Finesse and linewidth are measured to be 270 and 1.9 MHz, respectively.
The two mirrors are mounted at the two ends of an aluminium lens tube 222Thorlabs as depicted in Figure 3.
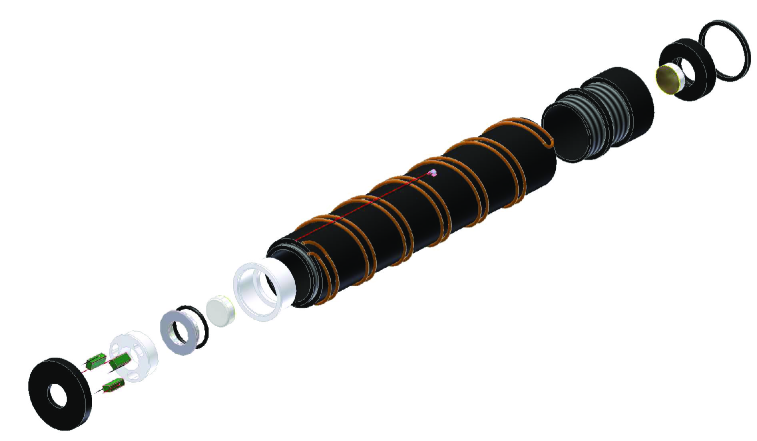
Having a high temperature expansion coefficient, aluminium assures the temperature tunability of the mirror distance (). A heating wire with resistance is wound around the tube and a PT100 temperature sensor is attached. The whole tube itself is wrapped in insulating material and placed inside a bigger aluminium container that is mounted on the optical table. One mirror is glued to an end piece of the tube that can be screwed in and out for course length adjustment. The other mirror is glued to an aluminium washer that is mounted in a two-piece teflon holder together with 3 piezo actuators and a rubber ring as shown in Figure 3. The holder is designed such that the aluminum washer with the mirror is pressed by the piezo stacks 333Piezomechanik PSt 150/2x3/7 against the rubber ring 444inner diameter = 16 mm, thickness = 1.5 mm that sits in between the aluminum washer and the outer teflon part. The piezo stacks are guided by three holes in the inner teflon part that sits inside the outer one. They are held by an end cap that is screwed onto the aluminium tube and pre-loads the flexible rubber ring. Thereby the piezos find sufficient resistance to compress the rubber ring thus changing the length of the cavity. A maximum voltage of is applied to the piezos corresponding to a length change of about and resulting in a shift of the resonance over about three free spectral ranges. Scanning over a wider frequency range is attained by changing the temperature.
IV Cavity Locker
The stabilization of the cavities to the reference laser is realized with a self-built electronic device called ”cavity locker” Almendros2009 . The cavity locker consists of a PDH input stage, a microcontroller555Analog Devices EVAL-ADUC7026QSZ, a scanning unit, and outputs for low- and high-frequency feedback (figure 2). The PDH stage consists of an input amplifier, a mixer, a phase shifter, and a bandpass filter, and it demodulates the photo diode signal using the rf modulation signal of the reference laser current as local oscillator (figure 2). The PDH error signal which it produces is the input for the servo amplifier which is implemented with software on the microcontroller. In control mode the low frequency output of the servo amplifier drives the heating wire, and the high frequency output drives the cavity piezos. If the control loop is open, the piezo can be scanned by the scanning unit and the temperature is stabilized to the value defined by a temperature set point potentiometer.
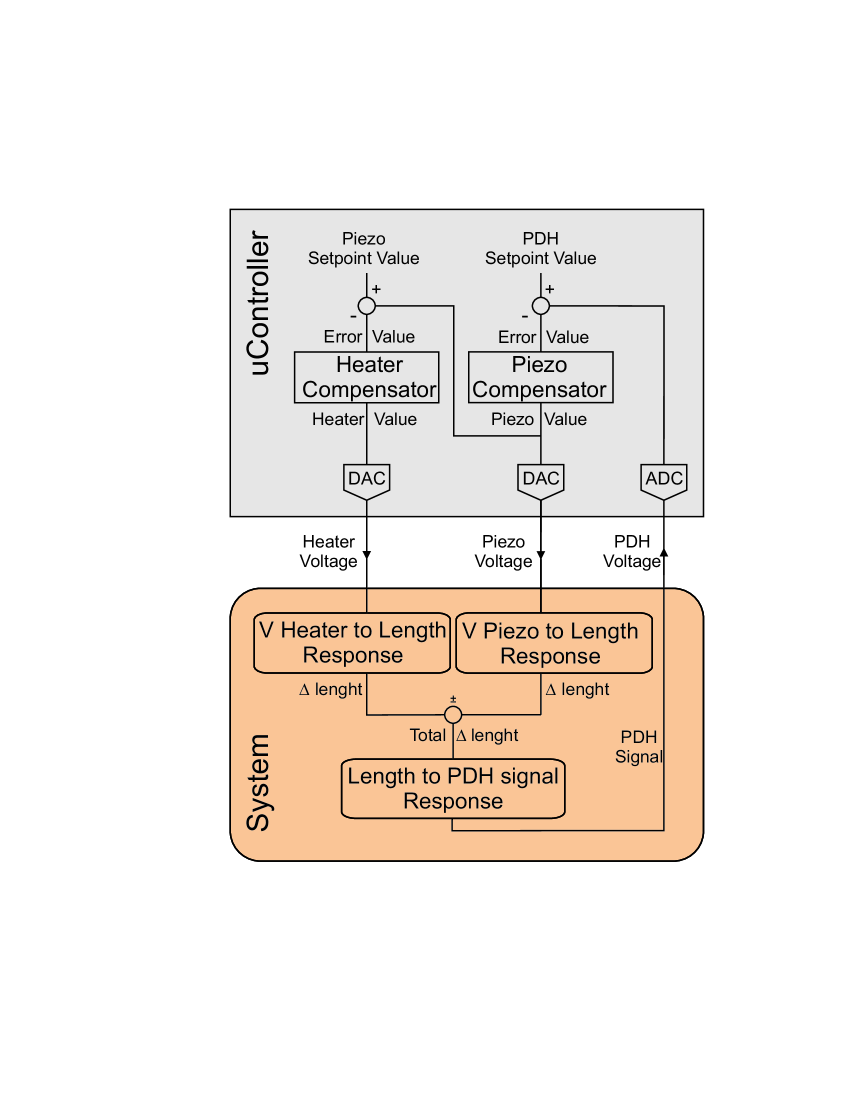
The servo amplifier implemented on the evaluation board consists of two compensators, one for the piezos and one for the heating wire. In closed-loop operation the heater compensator is programmed to regulate the length of the cavity in such a way that the piezos remain in their mid position (figure 4). This assures that the piezo voltage is kept within . Both compensators are programmed (in language) after analyzing the response of the system. The speed of the piezo compensator loop is limited by the eigen-frequency of the piezo actuators measured to be 3 kHz.
V Characterization
V.1 Cs spectroscopy
The right part of figure 5 shows the set-up of the Doppler-free absorption spectroscopy on the Cs cell. The absorption signal detected with PD1 is shown in figure 6 together with the corresponding error signal produced by the Pound-Drever-Hall stage of the cavity locker.
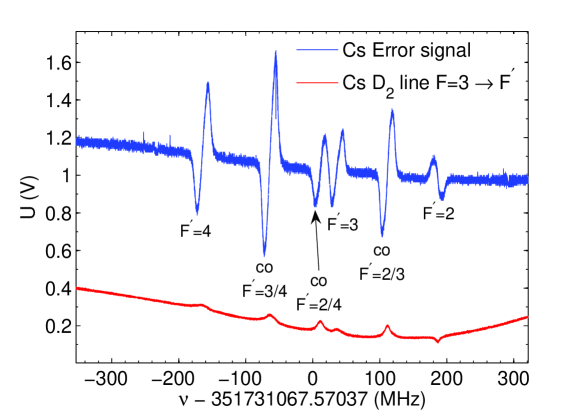
The transition used as reference is the crossover line.
V.2 Individual stabilizations
To characterize the stability of the individual Pound-Drever-Hall locks of the lasers to the cavities, the root mean square frequency deviation with respect to the cavities are measured. For this purpose the error signal of each laser was fitted with the corresponding theoretical curve and the slope at the set point was extracted; the frequency axis was gauged via the sidebands arising from the modulation of the laser current. A root mean square frequency deviation of 38 kHz was obtained, measured from the in-loop error signal recorded over 2 ms.
V.3 Characterization of the transfer lock
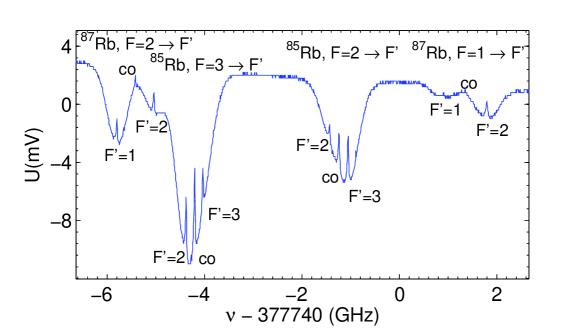
To estimate the absolute stability of the transfer locked lasers, one of them was compared with an independent atomic reference, a Doppler-free rubidium resonance in a gas cell. For this purpose a second Doppler-free absorption spectroscopy was set up and the master laser of the 397 nm SHG system was tuned to the D1 line of at 794.979 nm Banerjee2003OLv28p1579 . In figure 5 this setup is shown.
The full Rb Doppler-free absorption signal obtained by scanning the frequency of the 795 nm laser is depicted in figure 7. Since the cell contains Rb isotopes in their natural abundances, absorption lines for (72.2 %) and (27.8 %) are observed. The Doppler-free hyperfine structure is well resolved. The frequency axis was gauged using the literature value Steckvp of the ground state hyperfine splitting of of . The different hyperfine dips are easily identified using the splittings known from the literature Steckvp ; Steckvpa .
The transfer lock is characterized by generating a PDH error signal from the saturated absorption spectroscopy signal on , using the modulation of the laser light at 20 MHz from the lock to its transfer cavity. The signal recorded with a fast photo diode (PD2) 666New Focus model 1801 (Bandwidth 125 MHz) behind the Rb cell is amplified, mixed down with a mixer 777Mini Circuits ZAD-1H and filtered by a bandpass filter 888Mini Circuits SIF-21.4+ (see figure 2 bottom).
With the whole stabilization chain locked, i.e. the master laser at 795 nm is locked via the transfer cavity to the stable reference laser, the laser was tuned to resonance with the strongest line in , the crossover line. Scanning the AOM of figure 5 we identified the desired transition and set the frequency to resonance, i.e. to the point with the steepest slope of the error signal. Figure 8 shows the error signal of the crossover line obtained by scanning the AOM.
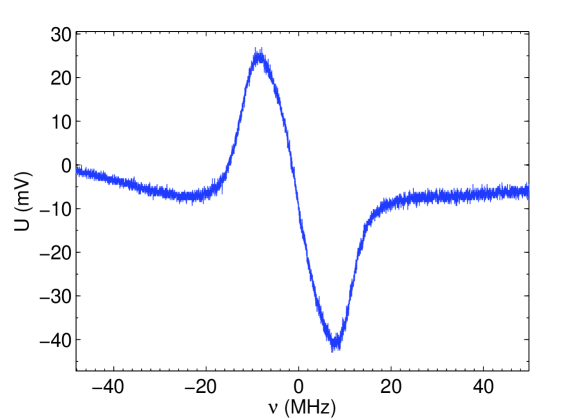
The error signal also serves as a frequency gauge for converting the voltage recorded with the oscilloscope into frequency. For this purpose the AOM is linearly scanned with amplitude around the resonance. The recorded slope is fitted linearly to determine the conversion factor between frequency and voltage for each measurement.
To measure the short-term stability of the locking chain, the Rb error signal was recorded for a fixed AOM frequency at three different times during one day over a time span of 200 ms with different sampling rates. From the voltage trace on the oscilloscope, rms deviations of 143 kHz, 123 kHz and 133 kHz were measured, respectively. Recalling the result of 38 kHz for a single PDH lock from section V.2, the stability of 123 kHz for three consecutive locks is consistent with the former measurement. However, the result from the spectroscopy measurement is more relevant as it has been measured with respect to an independent reference and can thus be assumed to hold for the spectroscopy.
In order to measure the long term stability of the setup, the mean value of the voltage of the Rb error signal was recorded with a computer. A Labview program read out the voltage from the oscilloscope and stored the mean value over the time for a duration of 2 hours. The mean value () of the error signal drifted by about one short-term rms deviation (), i.e. about 130 kHz, during these two hours.
The main cause of instability are acoustic noise or pressure drifts, to which open transfer cavities are particularly sensitive: there is a remaining systematic error resulting from the different refractive indices of air at the wavelengths of the two lasers Riedle1994RoSIv65p42 . Since among the lasers and the Cs reference the difference in refractive indices is largest for 852 and 795 nm, the error for the 795 nm laser can be regarded as an upper limit for all lasers.
An analysis following Ref. Riedle1994RoSIv65p42 reveals that the observed drift is equivalent to a pressure change of 1 mbar. Since the pressure in our lab is not controlled, it is reasonable to assume that the frequency drift is caused by a pressure drift. Apart from dynamic fluctuations, the daily cyclic variation of the atmospheric pressure is on the order of 1 mbar for our latitudes. This sensitivity to pressure fluctuation is the main limitation of schemes using open transfer cavities.
V.4 Allan variance
For a full characterization of the stability of the 795nm laser oscillator, the Allan variance Allan1966 was calculated from the three short term measurements as well as from the long term measurement. The four results are plotted in figure 9. The three measurements over 200 ms show good agreement between and . The Allan variance decays with over these two orders of magnitude, down to the region. This indicates the presence of white frequency noise caused in electronic components. It is expected that the accuracy of an oscillator increases with further integration time until other effects, such as long term drifts, start to dominate Riehle2004 . In accordance with this the Allan variance for the long term measurement rises again starting from up to . The slope is proportional to indicating that the dominant noise type is a random walk of frequency noise caused by the environmental conditions. This is in agreement with the observation of high sensitivity to pressure fluctuations.
Long and short-term measurements connect well for time scales of to . Although no data was recorded between 0.1 and 1 s, a flat behavior of may be assumed in that region. This suggests an expected flicker noise floor for low frequencies.
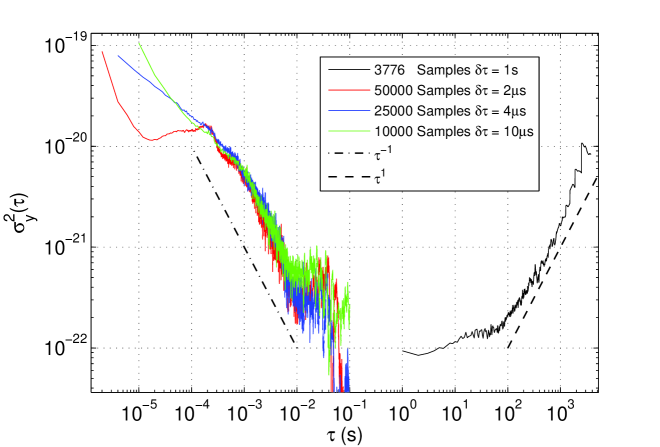
For the long term measurement each data point was averaged by the oscilloscope over 1 s, with no dead time between subsequent points. This assures that no fast oscillations were disregarded by the measurement apparatus. The three short term measurements were only sampled, i.e. each data point was recorded after the sampling period specified in figure 9. To make sure that there is no high frequency noise present, an additional Fast Fourier Transform (FFT) of the Rb error signal was recorded with the oscilloscope.
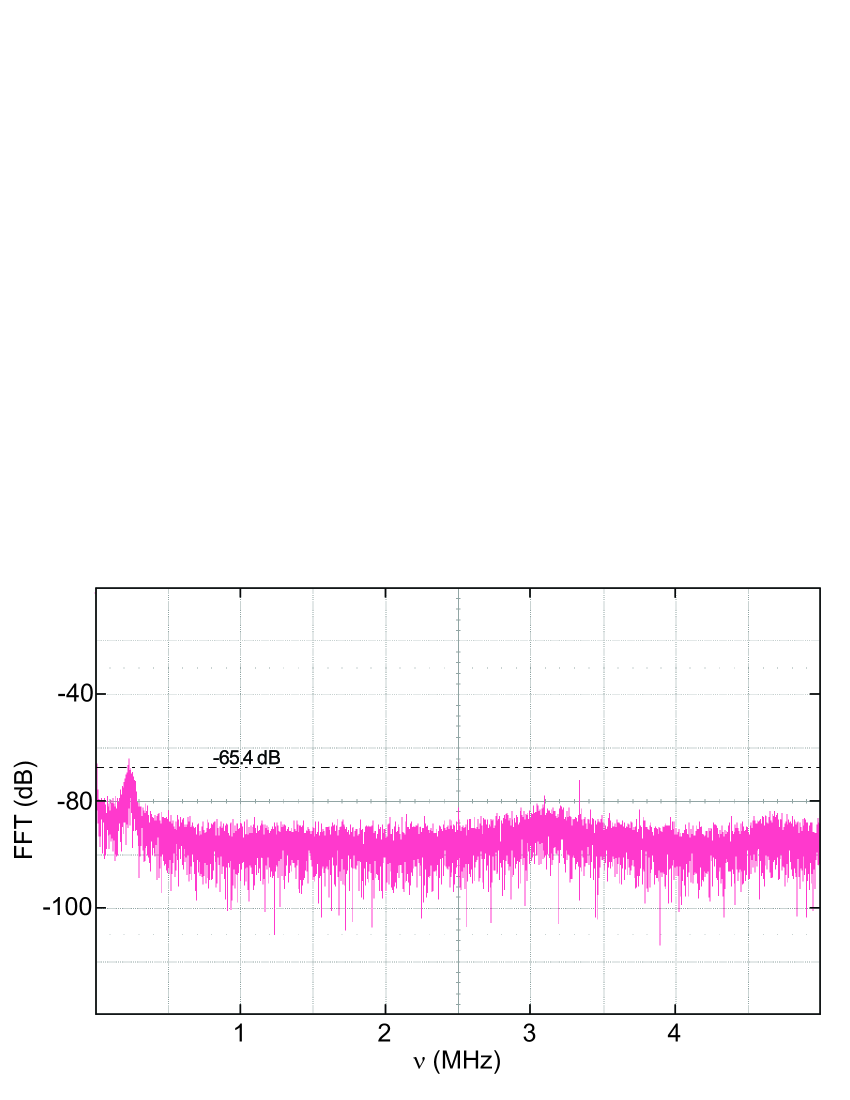
Figure 10 shows the FFT for a bandwith of 5 MHz. All noise with higher frequency than that is filtered by the bandpass filter (figure 2). The most prominent peak at 250 kHz with an amplitude of -65.4 dB is still accounted for in the Allan variance measurement with sampling rate . For higher frequencies there is no significant noise present. Therefore sampling without averaging on the time scale of the short-term measurements is expected to not miss any higher-frequency noise contributions.
VI Single ion spectroscopy
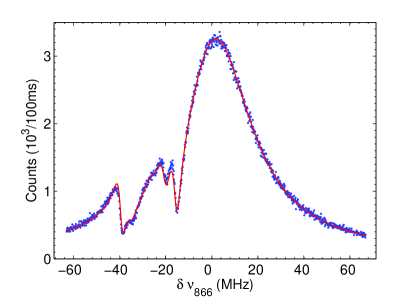
To test the stabilization scheme, excitation spectra of single ions have been recorded using the ion trap set-up described in Gerber2009NJoPv11p13 . The ion is continuously excited by two lasers at nm and nm, and the fluorescence light of the ion is collected by a high numerical aperture lens also described in Gerber2009NJoPv11p13 , and detected with a PMT while the 866 nm laser is scanned over the resonance. The laser is red-detuned to provide Doppler cooling. Figure 11 shows the excitation spectrum of a single ion with excitation under to the B-field direction. The and beams were set to vertical and horizontal polarization, respectively. Each data point represents the count rate on the PMT integrated over . The complex structure of the spectrum is caused by two-photon (dark) resonances between the and the level.
The red line is an eight-level Bloch equation model calculation Schubert1995PRAv52p2994 that was fitted to the data with a numeric (Matlab-based) fitting routine. The agreement with the model is very good exhibiting a reduced of 1.8. The linewidths of the lasers extracted from the fit are for the blue laser and for the infrared laser. This is consistent with the linewidth measured with respect to Rb, as described in section V.3.
VII Conclusions
We have described a laser frequency stabilization scheme for single-ion spectroscopy with high short- and long-term stability. The residual rms deviation of 123 kHz is well below all significant transition linewidths of and allows us to resolve well dark resonances in the excitation spectra. The Allan variance proves high long-term stability limited only by pressure changes in the laboratory. The scheme is particulary well suited for measurements with low count rates that require stable conditions over a long time period. For the longest experimental run until the publication of this article, stable conditions for 40 hours were achieved. During this time no noticeable frequency drift on the MHz scale was observed.
The linewidth of the laser system is comparable with systems used for ultra-high precision spectroscopy Maric2008PRAv77p32502 . The advantage in comparison with other transfer stabilization schemes lies in the use of open table-top cavities. The cavities are built mostly from off-the-shelf parts, no vacuum or ultra low expansion material is needed. A combined temperature and piezo length stabilization of the transfer cavities controlled by a micro controller is at the heart of the system.
We thank F. Dubin for technical support.
We acknowledge support from the European Commission (SCALA, contract 015714; EMALI, MRTN-CT-2006-035369), the Spanish MICINN (QOIT, CSD2006-00019; QLIQS, FIS2005-08257; QNLP, FIS2007-66944), and the Generalitat de Catalunya (2005SGR00189; FI-AGAUR fellowship of C.S.).
References
- (1) W. Neuhauser, M. Hohenstatt, P. E. Toschek, and H. Dehmelt, Phys. Rev. A 22, 1137 (1980)
- (2) S. A. Diddams, Th. Udem, J. C. Bergquist, E. A. Curtis, R. E. Drullinger, L. Hollberg, W. M. Itano, W. D. Lee, C. W. Oates, K. R. Vogel, and D. J. Wineland, Science 293, 825 (2001)
- (3) P. O. Schmidt, T. Rosenband, C. Langer, W. M. Itano, J. C. Bergquist, and D. J. Wineland, Science 309, 749 (2005)
- (4) T. Rosenband, D. B. Hume, P. O. Schmidt, C. W. Chou, A. Brusch, L. Lorini, W. H. Oskay, R. E. Drullinger, T. M. Fortier, J. E. Stalnaker, S. A. Diddams, W. C. Swann, N. R. Newbury, W. M. Itano, D. J. Wineland, and J. C. Bergquist, Science 319, 1808 (2008)
- (5) D. Leibfried, B. DeMarco, V. Meyer, D. Lucas, M. Barrett, J. Britton, W. M. Itano, B. Jelenkovic, C. Langer, T. Rosenband, and D. J. Wineland, Nature 422, 412 (2003)
- (6) F. Schmidt-Kaler, H. Häffner, M. Riebe, S. Gulde, G.P.T. Lancaster, T. Deuschle, C. Becher, C.F. Roos, J. Eschner, and R. Blatt, Nature 422, 408 (2003)
- (7) J.P. Home, M.J. McDonnell, D.M. Lucas, G. Imreh, B.C. Keitch, D.J. Szwer, N.R. Thomas, S.C. Webster, D.N. Stacey, and A.M. Steane, New J. Phys 8, 188 (2006)
- (8) J. Chiaverini, D. Leibfried, T. Schaetz, M. D. Barrett, R. B. Blakestad, J. Britton, W. M. Itano, J. D. Jost, E. Knill, C. Langer, R. Ozeri, and D. J. Wineland, Nature 432, 602 (2004)
- (9) R. Reichle, D. Leibfried, E. Knill, J. Britton, R. B. Blakestad, J. D. Jost, C. Langer, R. Ozeri, S. Seidelin, and D. J. Wineland, Nature 443, 838 (2006)
- (10) K.-A. Brickman, P. C. Haljan, P. J. Lee, M. Acton, L. Deslauriers, and C. Monroe, Phys. Rev. A 72, 050306 (2005)
- (11) S. Olmschenk, D. N. Matsukevich, P. Maunz, D. Hayes, L.-M. Duan, and C. Monroe, Science 323, 486 (2009)
- (12) J. D. Jost, J. P. Home, J. M. Amini, D. Hanneke, R. Ozeri, C. Langer, J. J. Bollinger, D. Leibfried, and D. J. Wineland, Nature 459, 683 (2009)
- (13) C. Raab, J. Bolle, H. Oberst, J. Eschner, F. Schmidt-Kaler, and R. Blatt, Appl. Phys. B 67, 683 (1998)
- (14) E. Riedle, S. H. Ashworth, Jr. J. T. Farrell, and D. J. Nesbitt, Review of Scientific Instruments 65, 42 (1994)
- (15) K. Matsubara, S. Uetake, H. Ito, Y. Li, K. Hayasaka, and M. Hosokawa, Japanese Journal of Applied Physics 44 (1A), 229 (2005)
- (16) A. Banerjee, D. Das, and V. Natarajan, Europhys. Lett. 65, 172 (2004)
- (17) M. Maric, J. J. McFerran, and A. N. Luiten, Physical Review A 77, 032502 (2008)
- (18) R. V. Pound, Review of Scientific Instruments 17 (11), 490 (1946)
- (19) R.W.P. Drever and J.L. Hall, Applied Physics B 31, 97 (1983)
- (20) G.C. Bjorklund, M.D. Levenson, W. Lenth, and C. Ortiz, Applied Physics B 32, 145 (1983)
- (21) M. Almendros, PhD thesis, in preparation, ICFO - The Institute of Photonic Science, 2009.
- (22) A. Banerjee, D. Das, and V. Natarajan, Opt. Lett. 28, 1579 (2003)
- (23) D.A. Steck, Rubidium 87 d line data, http://steck.us/alkalidata (2008)
- (24) D.A. Steck, Rubidium 85 d line data, http://steck.us/alkalidata (2008)
- (25) D.W. Allan, Proc. IEEE 54, 221 (1966)
- (26) F. Riehle, Frequency Standards. (Wiley-Vch, Weinheim, 2004)
- (27) S. Gerber, D. Rotter, M. Hennrich, R. Blatt, F. Rohde, C. Schuck, M. Almendros, R. Gehr, F. Dubin, and J. Eschner, New J. Phys. 11, 013032 (2009)
- (28) M. Schubert, I. Siemers, R. Blatt, W. Neuhauser, P. E. Toschek, Phys. Rev. A 52, 2994 (1995)