X-ray emission from the extended emission-line region of the powerful radio galaxy 3C 171
Abstract
We present Chandra X-ray observations of the powerful radio galaxy 3C 171, which reveal an extended region of X-ray emission spatially associated with the well-known 10-kpc scale optical emission-line region around the radio jets. We argue that the X-ray emission comes from collisionally ionized material, originally cold gas that has been shock-heated by the passage of the radio jet, rather than being photoionized by nuclear radiation. This hot plasma is also responsible for the depolarization at low frequencies of the radio emission from the jet and hotspots, which allows us to estimate the magnetic field strength in the external medium. We show that it is likely that both the cold emission-line gas and the hot plasma in which it is embedded are being driven out of the host galaxy of 3C 171 at supersonic speeds. A significant fraction of the total energy budget of the central AGN must have been expended in driving this massive outflow. We argue that 3C 171, with its unusual radio morphology and the strong relation between the jet and large amounts of outflowing material, is a member of a class of radio galaxies in which there is strong interaction between the radio jets and cold material in the host galaxy; such objects may have been very much more common in the early universe.
keywords:
galaxies: jets – galaxies: individual (3C 171) – galaxies: ISM – X-rays: galaxies1 Introduction
In powerful radio galaxies, extended optical emission-line regions (EELR) are often found to be aligned with the axis defined by the extended radio emission (e.g., McCarthy et al. 1987; McCarthy 1993; McCarthy, Baum & Spinrad 1996). A long-standing question (e.g., Baum & Heckman, 1989; Tadhunter et al., 1998) is whether these EELR are ionized by photons from the nucleus or by shocks driven by the jets. Shocks are part of the standard model for these powerful objects (e.g., Begelman & Cioffi, 1989) but direct observational evidence for them has been somewhat elusive, and to date has mostly come from the X-ray band (e.g., Kraft et al. 2003; O’Dea et al. 2006; Wilson, Smith & Young 2006). However, in the most powerful radio sources, normally found at high redshift, there is often evidence from one or more of the line kinematics, the line ratios or the relationship with the radio morphology that the optical emission lines are either ionized or at least strongly affected by jet-driven shocks, which requires a direct interaction between the jets and the cold ( K) phase of the IGM of the host galaxy (e.g., Sólorzano-Iñarrea, Tadhunter & Bland-Hawthorn 2002; Nesvadba et al. 2008). Photoionization presumably still operates, as it must in any source with a radiatively efficient accretion flow, but the interaction between jets and cold material dominates the energetics of the EELR. Understanding such interactions is important in models in which accretion onto the central black hole affects the properties of galaxies hosting powerful AGN (‘feedback’), while physical conditions in and kinematics of the EELR in these systems may give us important information about the energetics of the radio source as a whole. Unfortunately, in nearby, comparatively low-luminosity radio galaxies, which have the advantage that they can be studied with high spatial resolution, EELR are generally small, centrally peaked and can adequately be described by central-illumination models; they are plausibly just powerful versions of the ionization cones seen in local radio-quiet AGN such as Seyfert galaxies (e.g., Baum & Heckman, 1989). Thus the study of EELR in nearby radio-loud sources does not in general shed any light on jet-gas interactions.
There is evidence, however, that a small minority of low-redshift radio galaxies are also more adequately described by a shock-ionization model. One good candidate for a shock-ionization source at low redshift is 3C 171, an unusual radio galaxy. Low-resolution radio imaging (Heckman, van Breugel & Miley, 1984; Blundell, 1996) shows that in its inner regions it is similar to a normal FRII, but low-surface-brightness plumes instead of normal lobes extend north and south from the hotspots. High-resolution images show knotty jets connecting the radio core with the hotspots (Hardcastle et al., 1997). 3C 171 is associated with a prominent EELR, elongated along the jet axis, and the emission-line gas is brightest near the hotspots (Heckman et al., 1984), suggesting that the radio-emitting plasma is responsible for powering the emission-line regions. Clark et al. (1998) made William Herschel Telescope observations of the emission-line regions and showed that their ionization states are most consistent with a shock-ionization model, with the disturbed kinematics and high-velocity line splitting being indicative of direct driving of motions in the line-emitting gas by the jets. The velocity centroids of the lines observed are blueshifted at the level of a few hundred km s-1 relative to the systemic velocity in the east and similarly redshifted in the west, consistent with a jet-driven outflow (note that the two-sided appearance of the radio jets implies, given the normal assumption of relativistic jet speeds, that the jets are not far from the plane of the sky, in which case these radial velocities may substantially underestimate the outflow speed of the cold gas). The results of Clark et al. were confirmed by later studies with integral-field spectroscopy and with the Hubble Space Telescope (HST) (Sólorzano-Iñarrea & Tadhunter, 2003; Tilak et al., 2005). In terms of its apparent strong interactions between jet and cold IGM, 3C 171 may be a low-redshift analog of EELR around radio galaxies at high redshift, where cold gas is expected to be more abundant in radio source host galaxies.
3C 171 is also the only radio galaxy to date in which physical conditions in the EELR have been probed with detailed radio depolarization studies. Heckman et al. (1984) pointed out the depolarization of the radio source near the hotspots, while Hardcastle et al. (1997) showed that the depolarization was spatially very closely connected with the EELR. More recently Hardcastle (2003) (hereafter H03) used high-frequency radio polarimetry to measure the depolarization and Faraday rotation in the source as a function of position. Radio depolarization of the type seen in 3C 171 comes about as a result of unresolved structure in the Faraday rotation due to magnetoionic material in front of the source. As Faraday rotation depends on the electron density and magnetic field strength integrated along the line of sight, measurements of depolarization provide a measurement of the product of electron density and magnetic field strength in the external medium (Burn, 1966) which is essentially independent of the other physical conditions in that medium, such as temperature, so long as it is ionized. The key result of H03 was that the line-emitting material of the EELR, though spatially coincident with the observed depolarization, cannot itself be responsible for the depolarization (given the physical parameters deduced from the observations and the known physical parameters of line-emitting clouds, the clouds have far too low a covering factor). Instead the EELR-emitting clouds must be embedded in a more diffuse, and presumably hotter, medium whose parameters were constrained by the radio data.
X-ray studies of 3C 171 allow a search for this diffuse phase of the external medium of the source. At the time that H03 was writing the only imaging X-ray data available were a ROSAT HRI observation that had previously been shown (Hardcastle & Worrall, 1999) to give no detection of extended emission. Based on this and on assumed values for the characteristic magnetic field strength in the external medium, H03 placed some limits on the properties of the hot phase which suggested that an X-ray detection with deeper observations was unlikely. However, more recently, a short Chandra observation taken on 2007 Dec 22 (obsid 9304), with an effective sensitivity a factor of a few deeper than that of the ROSAT observations and a much higher spatial resolution, (Massaro et al. in prep) showed extended X-rays that clearly correlated very well with the observed region of radio depolarization, implying that the depolarizing medium could indeed be imaged directly.
The results of the Chandra snapshot motivated us to make the deep Chandra observation that is the subject of the present paper. In this paper we first describe the deep X-ray observation (Section 2) and the principal imaging and spectroscopic results (Section 3). In Section 4 we first argue that the extended X-ray emission is definitely thermal in origin and associated with the depolarizing medium and then go on to discuss the implications of this model for the dynamics and energetics of the source. Our conclusions are summarized in Section 5.
Throughout the paper we assume a cosmology with with km s-1 Mpc-1, and . This gives a luminosity distance to 3C 171, at , of 1194 Mpc and an angular scale of 3.77 kpc arcsec-1.
2 Observations
We observed 3C 171 with the ACIS-S array on Chandra on 2009 Jan 08 for a livetime of 59461.4 s (obsid 10303). The observations were taken in VFAINT mode to allow the best possible background rejection. Processing was carried out in the standard manner using ciao 4.1. In addition to applying the VFAINT background rejection corrections, we removed the standard 0.5 pixel position randomization during processing. There were no times of high background (flares) during the observation and so we use all of the data in the analysis that follows.
3C 171 was observed with XMM-Newton on 2009 Apr 07 as part of an unrelated program of observations of the nuclei of intermediate-resolution 3CRR sources (Hardcastle, Evans & Croston, 2009) for a livetime before filtering of 18320.8 s (pn) and 23044.6 s (MOS), giving a total sensitivity in principle very similar to that of the Chandra observation. Unfortunately this observation was badly affected by high particle background – the count rate in the pn observation was typically an order of magnitude above the expected background level between 10 and 15 keV, and the MOS cameras were almost as badly affected. This effectively removes our ability to use the XMM data to study the large-scale environment of the source, and so in this paper we use them only for comparison with the small-scale spectroscopy from Chandra. For these purposes high background is not so problematic, and so we lightly filtered the pn data to remove the worst of the flaring, giving an effective observation time of 13101.8 s, and left the MOS data unfiltered.
For comparison with the X-ray we use the radio data described by H03, the 1.4-GHz image from the 3CRR Atlas111See http://www.jb.man.ac.uk/atlas/ ., the (HST) data in the [OIII] and [OII] lines described by Tilak et al. (2005), and the ground-based H image of Tadhunter et al. (2000), the last two kindly provided by Clive Tadhunter. For our analysis we aligned the peak of the nuclear component in the Chandra data (see below) with the position of the radio core. This required a shift of 0.22 arcsec in a roughly E-W direction, which is well within the known uncertainties on Chandra’s absolute astrometric accuracy222See http://asc.harvard.edu/cal/ASPECT/celmon/ .. As we have no other compact features in common between the radio and X-ray maps, we retain the roll angle of the satellite from the default astrometry. The HST images were also aligned with the radio core at their brightest point; as this region is resolved with HST the alignment is probably only good to arcsec.
3 Results
3.1 Imaging
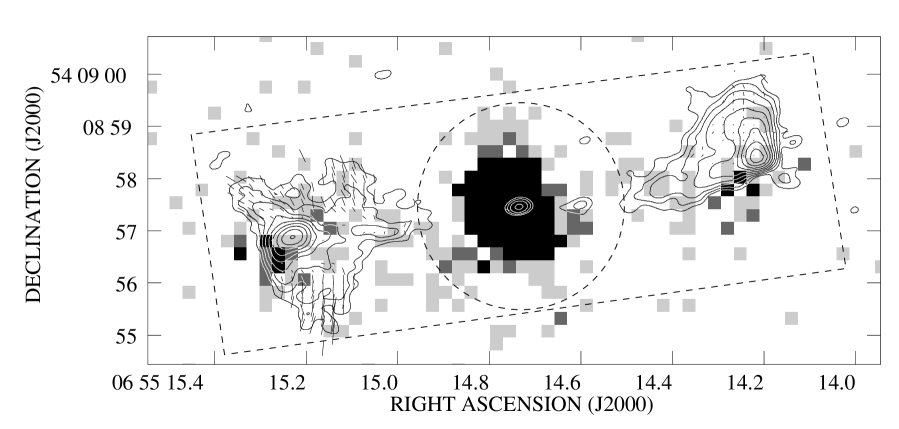

On small scales, Chandra resolves the emission from 3C 171 into a bright compact nuclear component, possibly slightly extended in a N-S direction, and low-surface-brightness emission roughly coincident with the main E-W axis of the radio jet (Fig. 1). In a 2.5-pixel source circle, with background taken in a concentric annulus between 2.5 and 4 pixels, there are 1070 0.5-5.0 keV counts in the core, while the extended emission aligned along the radio jet, taking a rectangular region with two identical adjacent background regions and masking out everything within 4 pixels of the nucleus (as shown in Fig. 1), contains counts. The brightest parts of the extended X-ray emission are found near the radio hotspots, but the brightness peak is offset from the radio in both cases (0.5-1 arcsec to the S of the W hotspot, and a similar distance to the E and SE of the E hotspot). In 2.5-pixel source circles these brightness peaks contain counts (E peak) and counts (W peak) and thus account for the majority of the X-ray emission from the source.
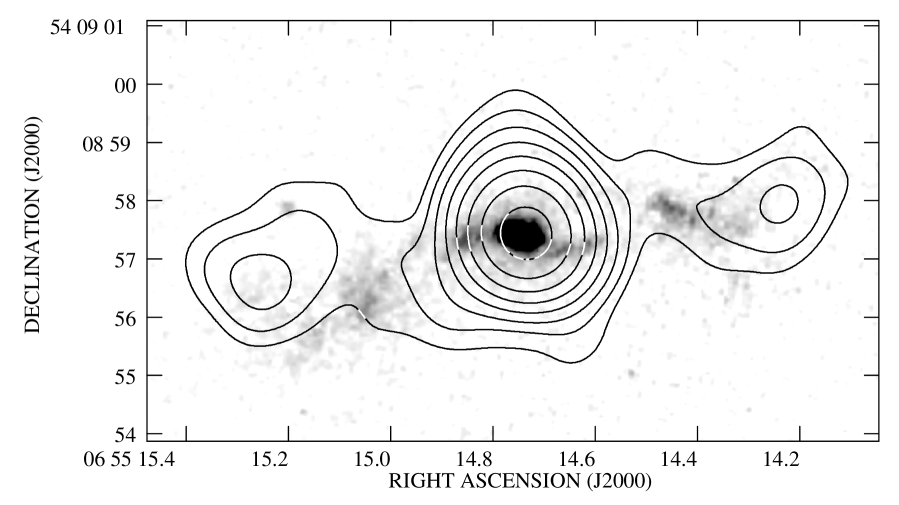
It is immediately apparent from the polarization vectors in Fig. 1 that there is a good correlation between X-ray emission and depolarization (seen as unpolarized regions in this low-frequency radio map): there is no depolarized region that does not have coincident X-ray emission and only one part of the radio source coincident with X-ray emission (to the N of the W hotspot) that shows significant radio polarization. The X-ray emission also broadly follows the region delineated by the optical emission-line region (Fig. 2). The clearest differences are near the E hotspot, where the [OIII] emission runs south of the X-rays (although the [OII] data show a very similar structure to the X-ray emission) and at the W hotspot, where the peak brightness in the X-rays has no corresponding optical emission. The X-rays also appear very similarly distributed to the H emission seen in the ground-based imaging of Tadhunter et al. (2000). There is clearly an intimate connection between the X-ray emission, the radio depolarization, and the optically emitting gas.
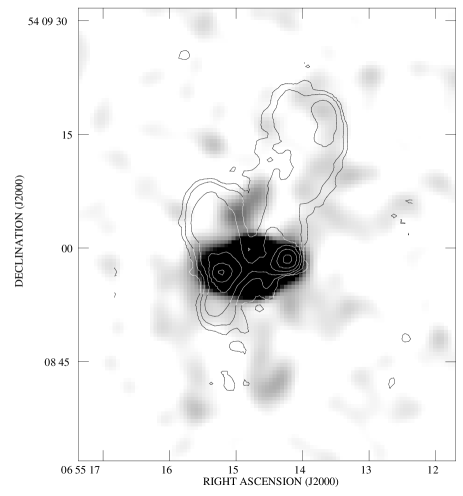
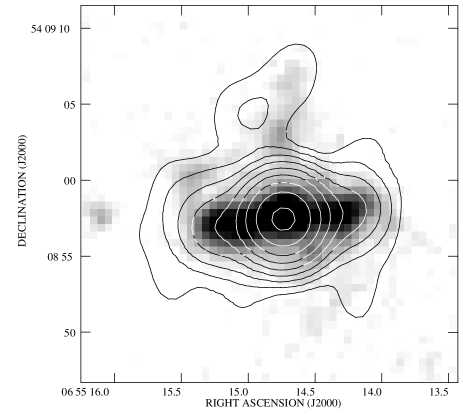
On larger scales, there is little evidence of any extended X-ray emission associated with 3C 171 (Fig. 3). The most obvious feature extends about 10 arcsec N of the nucleus, and is roughly coincident with a similar linear H feature seen by Tadhunter et al. (2000) (Fig. 4). This extended feature contains 0.5-5.0 keV counts. Weak extended emission is coincident with the W radio lobe (Fig. 3) but does not appear to trace the radio structure. At most a few tens of counts in the 0.5-5.0 keV energy band can be associated with all the emission on scales larger than that of the jet.
3.2 Spectroscopy
Spectral fitting was carried out using XSPEC 12. Spectra were grouped to have a minimum of 20 counts per bin after background subtraction. Spectral fitting to Chandra data was done in the 0.4-7.0 keV energy range in which Chandra is well calibrated, while for XMM-Newton the 0.3-8.0 keV energy range was used. All fits included Galactic absorption with an assumed cm-2. Errors quoted are for 1 degree of freedom ().
We began by considering the Chandra spectrum of the bright core, which was previously discussed by Hardcastle et al. (2009). The core has a count rate of 0.076 photons per 3.2 s frame, so pileup is expected to be negligible. In the 2.5-pixel source region discussed above, the data were well fitted () using the standard model for narrow-line radio galaxies, consisting of a power law with only Galactic absorption together with another power-law component with much higher intrinsic absorption. The unabsorbed component is required — fitting with an absorbed power law only gives — but its photon index is not constrained and we fix it to the value of 2.0 adopted by Hardcastle et al. (2009). Other forms for this component, such as soft thermal emission, cannot be ruled out. The properties of the absorbed component are well constrained; the absorbing column is cm-2 and the photon index is . The implied absorption-corrected rest-frame 2-10 keV luminosity of the absorbed component is erg s-1. Iron features are often seen in the spectra of narrow-line FRIIs, but none is present in 3C 171.
The spectrum of the extended emission, using the region discussed above, could be fitted either with an APEC model (abundance fixed to 0.35 solar, a typical value for the intra-group medium; , keV) or a power law (, ). The presence of some emission at high energies, and the absence of any peak in the emission around 1 keV, were the main factors favouring the power-law model. Better fits with APEC models could be obtained by reducing the abundance, so we do not regard the difference in here as in any way conclusive; with spectra of this signal-to-noise it is not possible to distinguish between power-law and thermal models in complete generality. Nor can we distinguish with these data between single-phase and multiphase, or between photoionized and collisionally ionized gas; there is no simple model within XSPEC that would adequately represent a photoionized plasma. For the thermal model, the (absorbed) 2-10 keV flux is erg cm-2 s-1, the (absorbed) flux in the 0.1-2.4 keV ROSAT band used by H03 is erg cm-2 s-1 (consistent with the H03 upper limit; the flux is higher than in the hard X-ray band due to the soft spectrum of the extended emission), and the rest-frame 2-10 keV unabsorbed luminosity is erg s-1.
We investigated whether there was any difference in hardness ratio between the hotspot regions and the rest of the extended emission. To do this we split the data at 1 keV and considered the ratio of hard to soft counts in (1) the two 2.5-pixel hotspot regions considered above and (2) the remainder of the extended region, in both cases using the same adjacent background rectangles. Although the hotspots appear softer than the rest of the extended emission, the difference is not significant at better than about the 1.5 sigma level, and the extended region near to the core is more likely to be contaminated by hard photons from the heavily absorbed core region.
Finally we considered joint fits to the Chandra and XMM-Newton data. XMM does not have the resolution to separate the compact and extended regions seen with Chandra and so for both instruments we extracted a spectrum using a 25-arcsec source circle centered on the AGN. The spectrum of this region is obviously dominated by the absorbed emission from the AGN itself, but will contain a contribution from the extended component. We fitted a model consisting of an unabsorbed power law with normalization and photon index fixed to the values determined with the Chandra spectroscopy, an absorbed power law with free normalization, photon index and absorbing column, and either an APEC model with abundance 0.35 solar or a further power law. In either model the parameters of the AGN component were well constrained and similar to those derived from Chandra alone. For the thermal model () we found cm-2 and photon index , while the thermal component had keV. The power-law model () had cm-2, a photon index of , and a photon index for the additional unabsorbed power law of . The XMM data thus show that the active nucleus of 3C 171 does not seem to have varied in normalization, photon index or absorbing column over the three months between the two observations, but they do not really help us to distinguish between a thermal and a non-thermal model for the extended emission.
4 Discussion
4.1 Thermal or non-thermal?
The interpretation of these observations clearly hinges on the nature of the central region of extended X-ray emission. As we have seen, spectroscopy marginally favours a non-thermal origin for this emission over an APEC plasma with abundance values typical for the intragroup or intracluster medium. We know that the jets, hotspots and lobes of radio galaxies can all emit non-thermal emission via the inverse-Compton process. However, there seem to us to be several compelling reasons for preferring a thermal model for all the extended X-ray emission:
-
1.
Non-thermal emission from jets and hotspots generally shows some correspondence with the radio emission; if there are offsets, the offsets are more typically in the direction of the nucleus; crucially, there are no documented offsets for hotspots where the hotspot counterpart lies outside the boundaries of the radio emission, and it is very hard to see how such a situation can arise. In 3C 171 the peaks of the extended emission clearly lie outside the boundaries of the radio emission (Fig. 1). The inner part of the extended emission is not associated with any feature in the knotty inner jet, whereas synchrotron emission from FRII jets tends to trace jet structure quite well (e.g., Wilson, Young & Shopbell, 2001; Kraft et al., 2005). Inverse-Compton emission from the small-scale lobes would be expected to be well matched morphologically to the radio structure, but this is not seen in 3C 171: in any case the predicted inverse-Compton emission from 3C 171, if it follows the trend seen in other FRIIs at similar redshift (e.g., Croston et al., 2005) is negligible.
-
2.
The good agreement between the structure in emission lines and the X-rays, which may extend to regions where there is no radio emission at all, is very hard to explain in a non-thermal model.
-
3.
The strong correlation between X-ray emission and depolarization, and particularly the fact that this correlation appears better for the X-ray emission than for emission at any other waveband, is impossible to explain in a non-thermal model.
In what follows we therefore investigate the consequences of considering a thermal model for the extended X-ray emission in 3C 171.
4.2 Shock-ionized or photoionized?
Is the extended X-ray emission thermal bremsstrahlung from shock-heated thermal material or could it be dominated by unresolved emission lines photoionized by the flux from the active nucleus? These two models imply different density, temperature and pressure profiles for the X-ray-emitting plasma. In particular, the rough constancy in both the X-ray brightness along the jet and the X-ray to optical emission line flux ratio on scales between and 20 kpc from the nucleus implies a roughly constant ionization parameter if both the optical and X-ray emission is produced by photoionization; as the photon number density drops as , the density profile (assuming an ionization-cone geometry) must also go roughly as . By contrast, in a thermal bremsstrahlung model the density must be roughly constant throughout the emitting region.
One piece of evidence favouring the photoionized model comes from the ratio of optical emission line flux to soft X-ray flux, following Bianchi, Guainazzi & Chiaberge (2006) who analysed the extended X-ray and radio structures in a sample of nearby Seyfert galaxies. The total flux of [OIII] emission in a 10-arcsec aperture centered around the peak of the source is erg s-1 cm-2 (Tilak, priv. comm.). If we scale this to include only the emission at distances arcsec from the nucleus, it drops by a factor 2. The unabsorbed X-ray flux of the extended emission in the 0.5-2.0 keV band used by Bianchi et al. is erg s-1 cm-2, so the ratio of the optical to soft X-ray flux is roughly a factor 2.5. The flux ratio seen here thus is comparable to, though at the low end of, that seen in the Seyferts analysed by Bianchi et al., where both the [OIII] emission and the X-rays are inferred to be photoionized by the nucleus. However, in 3C 171 we know that the [OIII] emission is most likely to be shock-ionized (Clark et al., 1998), so this agreement may be a coincidence.
We can place some simple limits on the photoionized model using the requirement of constant ionization parameter, following the analysis of Weaver et al. (1995). Let the emitting geometry be a cone between radial distances of and , so that the radius of the cone at a distance is given by , and let the density be given by . Then the total luminosity of the cone is given by
| (1) | |||||
and we see that, if geometrical factors are fixed and the emissivity for a given ionization parameter in the relevant band is known (Weaver et al. give erg cm3 s-1) the luminosity determines the density. (We assume a filling factor of order unity since we know that low filling factors will prevent the X-ray-emitting plasma from depolarizing the radio emission; see below.) The soft X-ray luminosity, given the flux above, is erg s-1. If we take pixels arcsec kpc, arcsec kpc, and kpc (based on the spatially resolved optical emission-line gas, see H03) then we find cm-3, and so cm-3. We have the additional requirement that the ionization parameter , defined as
| (2) |
be erg s-1 cm (Weaver et al., 1995) and for the constraint on that we have just derived this implies that the ionizing luminosity has to be erg s-1; even allowing for anisotropy of the ionizing continuum, this seems very high compared to the X-ray luminosity of the nucleus computed in Section 3.2. Moreover, when we consider the temperature of the photoionized gas (likely to be K, see Krolik & Kallman 1984) we can see that the external pressures are likely to be such that the radio source would drive a shock into this material anyway (see below, Section 4.4); so it is hard to see how a self-consistent photoionization model can be derived. We therefore focus in what follows on the implications of a model in which the X-ray emission comes from collisionally ionized, shock-heated material.
4.3 The depolarizing medium?
Is the extended X-ray emission coming directly from the depolarizing medium inferred from the radio data (H03)? From polarization observations at high frequency, H03 inferred that the product cm-3 nT kpc-1, where is the electron density in the depolarizing medium, is the field strength, and is the scale size of field reversals, required by observations to be kpc; given the uncertainties and simplifying assumptions, this constraint is probably only an order-of-magnitude estimate. Note in particular that H03 assumed a cylindrical geometry with radius 5 kpc and length 50 kpc for the depolarizing medium, based on the appearance of the source in optical emission lines.
On the assumption of a collisionally ionized, thermal origin for the X-rays, we can use the APEC normalization to work out a mean electron density. We begin by using the parameters of H03 for the geometry of the depolarizing region; this gives cm-3 if we assume that the emission region is a uniformly filled cylinder. Thus, for kpc, we obtain a constraint on the external magnetic field, nT. H03 preferred lower field strengths, but there is no reason in principle why they cannot be higher. A plausible upper limit is given by the field strength that gives an energy density equal to that in the gas, i.e.
| (3) |
since we do not expect the external gas to be magnetically dominated. This constraint gives nT for keV, which is entirely consistent with the lower limit derived from the depolarization observations, and implies pc for our adopted density, which is reasonable as we know that some of the Faraday structure was resolved by the highest-resolution observations of H03. Moreover, for the density and temperature implied by the thermal model for the extended X-rays, we find a pressure in the X-ray-emitting gas equal to around dyn cm-2, which is very consistent with what might be expected for pressure balance with emission-line clouds having cm-3, kT = K. We conclude that it is very plausible that we are directly imaging the depolarizing medium, in which case the depolarization data require that the magnetic field energy density in the X-ray-emitting plasma be within a factor of a few of the thermal energy density. A consequence of this is that the filling factor of the X-ray emitting material must be of order unity, since low-filling-factor plasma cannot effectively depolarize the radio emission; thus the X-ray-based pressures should be a good measure of the true pressure around the jet.
The choice of geometry for the hot gas affects the inferred parameters. As mentioned above, H03’s assumptions were based on the properties of the [OIII] emission-line gas. Given the extent of the Chandra extended emission, a length of the cylinder of around 42 kpc and a radius around 5.6 kpc (without correction for the resolution of the instrument) might be estimated. Since goes as , the effect on the inferred density of adopting these X-ray-derived parameters would be negligible; unless the source is very far from the plane of the sky, the likely effect of any correction for projection would be similarly limited. Accordingly we retain the parameters used by H03 in what follows.
4.4 Dynamics, outflows and source energetics
If the X-ray emitting gas genuinely represents the depolarizing medium, and fills the space in between the cold emission-line clouds with a filling factor close to unity, and if the emission-line clouds acquire their observed radial velocity offsets as a result of interaction with the jet, as implied by the association of high velocities with jet structures seen by Clark et al. (1998), then it seems very plausible that the hot phase is moving along with the cold clouds. In particular, if the cold clouds are swept up, shock-ionized material, as argued by Clark et al., then the material in between them will be swept up too. From the line splitting observed by Clark et al., we can put a lower limit on the velocity of the cold clouds away from the nucleus of km s-1; as mentioned above, this is highly conservative given the evidence that the jet axis lies close to the plane of the sky. In addition to the thermal energy stored in the gas, , which is around erg, we require that the radio source must have supplied the kinetic energy of the outflow, , which is erg, given that the mass of the hot gas, , is around . However, if the outflow is driven by a shock, the expansion speed may be much higher. We next consider the dynamics and energetics of a possible shock in 3C 171.
We may compare the pressures derived in the previous section to the minimum energy in the radio components in order to gain some insight into the source dynamics. In the brightest region of the E hotspot, which we model as a cylinder with a length of 0.7 arcsec and a width of 0.225 arcsec based on the high-resolution radio images of H03, we fitted a broken power-law model in electron energy to the electron energy spectrum to determine the minimum energy. We conservatively assume no protons and , and find a minimum pressure (assuming a fully tangled field, so that ) of around dyn cm-2. This is substantially higher than the external pressure inferred in the previous section, so it seems clear that the hotspot and the region of the jet head around it are capable of driving a shock into the external medium, explaining the presence both of the hot and cold phases of ionized gas. Modelling this bright region of the hotspot as a uniform cylinder significantly understates the complexity of the radio emission, but no plausible more detailed model would reduce the minimum pressure by 1.5 orders of magnitude. On the other hand, the minimum pressure in the large-scale lobes, on scales of tens of kpc, is dyn cm-2, giving a plausible reason why these large-scale lobes avoid the central regions of the source.
If we assume that the minimum pressure in the lobes, estimated above, is comparable to (it clearly cannot be less than) the pressure in any external hot-gas environment, then we can work out the Mach number of the shock being driven by the jets, given that
| (4) |
where is the adiabatic index, 5/3 in this case; this implies a moderate-strength shock of , a density contrast across the shock of around 2.6, and a pre-shock temperature of 0.6 keV, in turn implying a shock speed around 1400 km s-1. These values seem plausible. The temperature estimate for the hot gas is consistent with what might be expected for a poor group of galaxies. From the temperature-luminosity relationship for groups (e.g., Osmond & Ponman, 2004), we expect a total bolometric luminosity for such a system on the order of erg s-1, which is comparable to the upper limit on the group-scale bolometric unabsorbed luminosity for keV if we assume there are counts in group-scale emission, erg s-1. Finally, the required external density on scales of a few kpc, cm-3, although a little high, seems to be within a factor of a few of what is plausible for a poor group (see, e.g., the entropy profiles of Ponman, Sanderson & Finoguenov 2003). Thus all the evidence seems consistent with the idea that the X-ray emission is shocked gas from a powerful jet propagating into a poor group environment, though we cannot rule out the possibility that the shock is instead being driven through much colder, denser external material which would not be visible in the X-ray (a point we return to below, Section 4.5). If we assume that the hot and cold phases are moving out with the jet at 1400 km s-1, then the kinetic energy of the outflow becomes erg.
If the estimates of shock speed above are correct, then the projected jet length of around 16 kpc implies a source lifetime years, which is not atypical for dynamic age estimates of small radio galaxies (projection would imply longer timescales). The jet then has to supply at least the excess thermal and kinetic energy of the gas, which is erg for km s-1, on this timescale, giving a required total jet power of erg s-1. This is in one sense a lower limit on the jet power since it excludes the energy stored in the lobes, but in another sense an upper limit since it assumes that all the gas moves at the putative shock speed and neglects any projection effects. Nevertheless it is interesting that this jet power is very comparable to the bolometric radiative AGN power that can be estimated from the unabsorbed X-ray luminosity (Section 3.2), given that widely used bolometric corrections from the 2-10 keV band are an order of magnitude or more (e.g., Marconi et al., 2004).
4.5 3C 171, 3C 305, and other radio galaxies
So far we have not addressed the question of the difference between 3C 171 and most other radio galaxies of similar radio luminosity, which have classical double radio morphology with double lobes that extend back from the hotspots to form a ‘cocoon’ around the radio jets. It is hard to escape the impression that the peculiar radio morphology of 3C 171 is a result of its unusual extended emission-line region and the associated X-ray-emitting and radio-depolarizing medium. This impression is strengthened by the similarity between 3C 171 and 3C 305. 3C 305 is a lower-power, nearer, smaller radio source, but also has twin FRII-like jets and hotspots (Heckman et al., 1982; Jackson et al., 2003) together with disrupted, perpendicular plumes rather than conventional lobes (Heckman et al. 1982), and has jets associated with optical emission-line gas that is itself associated with radio depolarization (Heckman et al., 1982), that is likely shock-ionized (Jackson et al., 2003) and is spatially coincident with extended X-ray emission that has been imaged with Chandra (Massaro et al., 2009). In 3C 305, an outflow of neutral hydrogen is also associated with the jet (Morganti et al., 2005). These two radio galaxies, 3C 171 and 3C 305, seem to us to be the best-studied examples of a class of powerful radio-loud AGN that is relatively rare, at least at low redshift, in which there is a strong, disruptive interaction between the IGM of the host galaxy and the powerful, FRII-type radio jets. (We will discuss the interpretation of the radio depolarization in 3C 305 and its relationship to the extended X-ray emission in a future paper.)
What property of the IGM makes 3C 171 and 3C 305 special? Although, for convenience, we have discussed the dynamics of the source in terms of propagation into the hot, high-pressure phase of the IGM, it seems clear that special properties of this phase cannot account for the peculiar structures of these two radio sources. All powerful FRII sources seem to propagate into environments of at least comparable richness, and many inhabit richer groups (e.g., Croston et al., 2004) while detailed observations have shown that quite strong asymmetries in the distribution of intragroup hot gas (e.g., Hardcastle et al., 2007) do not produce radio sources as distorted as 3C 171 and 3C 305. We are therefore forced to the conclusion that the strong interaction is between the radio source and the cold phase of the IGM. In many radio galaxies the amount of cold gas is negligible, but we know that it is significant at least in 3C 305 (Morganti et al., 2005). We propose that both radio sources have acquired their peculiar structure by propagating into initially cold material that is dense enough to be dynamically important on kpc scales. The shock-heating of this material produces both the X-ray emission and the optical emission lines that we see. Even after the shock, the material along the jet axis is dense enough that the thermal pressure forces the post-hotspot outflow in a direction transverse to the jet, causing it to expand into the observed perpendicular plume structures. This picture naturally explains why these sources are rare at the present day – large masses of cold gas aligned with the jet on kpc scales are not usually present in the elliptical hosts of powerful radio galaxies. However, we expect them to be much more common in the early universe; an example may be provided by the morphologically very similar, though much larger, X-ray structures seen along the jet axis of the powerful radio galaxy PKS 1138262 (Carilli et al., 2002). If this is the case, their jet-driven (rather than radiatively driven) heating and expulsion of cold gas from the central regions of the host galaxy may be related to observational constraints on the masses and star-formation histories of massive elliptical galaxies (e.g., Tadhunter, 2007) and their study at low redshift gives us important insights into the process of high-redshift massive galaxy formation.
5 Summary and conclusions
Our main results on 3C 171 can be summarized as follows.
-
1.
We find an extended region of X-ray emission coincident with the well-studied extended optical emission-line region in 3C 171.
-
2.
In what we feel is the most plausible interpretation, the X-ray emission is thermal and is due to collisionally ionized hot plasma in which the cold clouds of optical line-emitting material are embedded. On these scales photoionization models require very high continuum luminosities and are hard to render consistent with the dynamics of the source and the observed radio depolarization.
-
3.
In the collisionally ionized interpretation, the X-ray emitting material is capable of producing the depolarization of the radio emission from the jets and hotspots studied by H03. The physical conditions we estimate from the X-ray observation give rise to very reasonable constraints on the magnetic field strength in the medium external to the radio source, , and a scale for the magnetic field reversals in the range .
-
4.
If the hot plasma is moving with the cold line-emitting material, then it dominates the energetics of the outflow. The total energy budget required depends on the outflow speed adopted, but lies in a range between a few and a few erg s-1, comparable to the bolometric radiative luminosity of the active nucleus.
These results are significant for two reasons. Firstly, the very good agreement between the physical conditions implied by the optical line emission, the X-rays and the radio depolarization gives us some confidence that we have at least a basic picture of the complex multi-phase medium (consisting of at least warm gas, hot plasma and magnetic fields) in which the jet is embedded. Over the coming decades, our ability to study polarization structures in radio galaxies will be greatly improved, while our ability to image them with high resolution in X-rays may unfortunately be significantly diminished. It is therefore important to develop methods of inferring physical conditions from radio polarization (and optical emission-line) studies alone, and our work shows that this can be done. Secondly, they imply that many of the sources in which extended emission-line regions have been detected may also have energetically dominant outflows of hot plasma; if confirmed by X-ray studies of suitable targets, this makes optical emission-line studies central to an understanding of the interaction between radio galaxies and the cold gas in their environments.
acknowledgements
We thank Judith Croston for helpful discussions of the central density in poor groups, Clive Tadhunter for providing emission-line images, and Avanti Tilak for help with the [OIII] luminosity of 3C 171. MJH thanks the Royal Society for a research fellowship. FM acknowledges the Foundation BLANCEFLOR Boncompagni-Ludovisi, née Bildt, for the grant awarded him in 2009 to support his research. Work at SAO was supported by NASA grant GO9-0110X.
References
- Baum & Heckman (1989) Baum, S.A., Heckman, T., 1989, ApJ, 336, 681
- Begelman & Cioffi (1989) Begelman, M.C., Cioffi, D.F., 1989, ApJ, 345, L21
- Bianchi et al. (2006) Bianchi, S., Guainazzi, M., Chiaberge, M., 2006, A&A, 448, 499
- Blundell (1996) Blundell, K.M., 1996, MNRAS, 283, 538
- Burn (1966) Burn, B.J., 1966, MNRAS, 133, 67
- Carilli et al. (2002) Carilli, C.L., Harris, D.E., Pentericci, L., Röttgering, H.J.A., Miley, G.K., Kurk, J.D., van Breugel W., 2002, ApJ, 567, 781
- Clark et al. (1998) Clark, N.E., Axon, D.J., Tadhunter, C.N., Robinson, A., O’Brien, P., 1998, ApJ, 494, 546
- Croston et al. (2004) Croston, J.H., Birkinshaw, M., Hardcastle, M.J., Worrall, D.M., 2004, MNRAS, 353, 879
- Croston et al. (2005) Croston, J.H., Hardcastle, M.J., Harris, D.E., Belsole, E., Birkinshaw, M., Worrall, D.M., 2005, ApJ, 626, 733
- Hardcastle (2000) Hardcastle, M.J., 2000, A&A, 357, 884
- Hardcastle (2003) Hardcastle, M.J., 2003, MNRAS, 339, 360 [H03]
- Hardcastle & Worrall (1999) Hardcastle, M.J., Worrall, D.M., 1999, MNRAS, 309, 969
- Hardcastle et al. (1997) Hardcastle, M.J., Alexander, P., Pooley, G.G., Riley, J.M., 1997, MNRAS, 288, 859
- Hardcastle et al. (2009) Hardcastle, M.J., Evans, D.A., Croston, J.H., 2009, MNRAS, 396, 1929
- Hardcastle et al. (2007) Hardcastle, M.J., Kraft, R.P., Worrall, D.M., Croston, J.H., Evans, D.A., Birkinshaw, M., Murray, S.S., 2007, ApJ, 662, 166
- Heckman et al. (1982) Heckman, T.M., Miley, G.K., Balick, B., van Breugel, W.J.M., Butcher, H.R., 1982, ApJ, 262, 529
- Heckman et al. (1984) Heckman, T.M., van Breugel W.J.M., Miley, G.K., 1984, ApJ, 286, 509
- Jackson et al. (2003) Jackson, N., Beswick, R., Pedlar, A., Cole, G.H., Sparks, W.B., Leahy, J.P., Axon, D.J., Holloway, A.J., 2003, MNRAS, 338, 643
- Kraft et al. (2003) Kraft, R.P., Vázquez, S., Forman, W.R., Jones, C., Murray, S.S., Hardcastle, M.J., Worrall, D.M., Churazov, E., 2003, ApJ, 592, 129
- Kraft et al. (2005) Kraft, R.P., Hardcastle, M.J., Worrall, D.M., Murray, S.S., 2005, ApJ, 622, 149
- Krolik & Kallman (1984) Krolik, J.H., Kallman, T.R., 1984, ApJ, 286, 366
- Marconi et al. (2004) Marconi, A., Risaliti, G., Gilli, R., Hunt, L.K., Maiolino, R., Salvati, M., 2004, MNRAS, 351, 169
- Massaro et al. (2009) Massaro, F., et al., 2009, ApJ, 692, L123
- McCarthy (1993) McCarthy, P.J., 1993, ARA&A, 31, 639
- McCarthy et al. (1996) McCarthy, P.J., Baum, S., Spinrad, H., 1996, ApJS, 106, 281
- McCarthy et al. (1987) McCarthy, P.J., van Breugel, W., Spinrad, H., Djorgovski, S., 1987, ApJ, 321, L29
- Morganti et al. (2005) Morganti, R., Oosterloo, T.A., Tadhunter, C.N., van Moorsel, G., Emonts, B., 2005, A&A, 439, 521
- Nesvadba et al. (2008) Nesvadba, N.P.H., Lehnert, M.D., De Breuck, C., Gilbert, A.M., van Breugel W., 2008, A&A, 491, 407
- O’Dea et al. (2006) O’Dea, C.P., Mu, B., Worrall, D.M., Kastner, J., Baum, S., de Vries W.H., 2006, ApJ, 653, 1115
- Osmond & Ponman (2004) Osmond, J.P.F., Ponman, T.J., 2004, MNRAS, 350, 1511
- Ponman et al. (2003) Ponman, T.J., Sanderson, A.J.R., Finoguenov, A., 2003, MNRAS, 343, 331
- Sólorzano-Iñarrea & Tadhunter (2003) Sólorzano-Iñarrea, C., Tadhunter, C.N., 2003, MNRAS, 340, 705
- Sólorzano-Iñarrea et al. (2002) Sólorzano-Iñarrea, C., Tadhunter, C.N., Bland-Hawthorn, J., 2002, MNRAS, 331, 673
- Tadhunter (2007) Tadhunter, C., 2007, NewAR 51 153
- Tadhunter et al. (1998) Tadhunter, C.N., Morganti, R., Robinson, A., Dickson, R., Villar-Martin, M., Fosbury, R.A.E., 1998, MNRAS, 298, 1035
- Tadhunter et al. (2000) Tadhunter, C.N., Villar-Martin, M., Morganti, R., Bland-Hawthorn, J., Axon, D., 2000, MNRAS, 314, 849
- Tilak et al. (2005) Tilak, A., O’Dea, C.P., Tadhunter, C., Wills, K., Morganti, R., Baum, S.A., Koekemoer, A.M., Dallacasa, D., 2005, AJ, 130, 2513
- Weaver et al. (1995) Weaver, K.A., Mushotzky, R.F., Serlemitsos, P.J., Wilson, A.S., Elvis, M., Briel, U., 1995, ApJ, 442, 597
- Wilson et al. (2006) Wilson, A.S., Smith, D.A., Young, A.J., 2006, ApJ, 644, L9
- Wilson et al. (2001) Wilson, A.S., Young, A.J., Shopbell, P.L., 2001, ApJ, 547, 740